| Param | Original file | Final file |
|---|---|---|
| Filename | modeM0/AS1A02_191T01_9000000854_06449cztM0_level2.evt | modeM0/AS1A02_191T01_9000000854_06449cztM0_level2_quad_clean.evt |
| Size (bytes) | 1,182,646,080 | 216,365,760 |
| Size | 1.1 GB | 206.3 MB |
| Events in quadrant A | 8,175,179 | 1,334,575 |
| Events in quadrant B | 8,618,406 | 1,361,306 |
| Events in quadrant C | 8,041,681 | 1,325,407 |
| Events in quadrant D | 9,740,112 | 1,267,717 |
| Mode SS | |||
|---|---|---|---|
| Quadrant | BADHDUFLAG | Total packets | Discarded packets |
| A | 0 | 372 | 0 |
| B | 0 | 372 | 0 |
| C | 0 | 372 | 0 |
| D | 0 | 372 | 0 |
| Mode M0 | |||
|---|---|---|---|
| Quadrant | BADHDUFLAG | Total packets | Discarded packets |
| A | 0 | 37187 | 3 |
| B | 0 | 38135 | 2 |
| C | 0 | 37117 | 2 |
| D | 0 | 41963 | 2 |
| Mode M9 | |||
|---|---|---|---|
| Quadrant | BADHDUFLAG | Total packets | Discarded packets |
| A | 0 | 20 | 0 |
| B | 0 | 20 | 0 |
| C | 0 | 20 | 0 |
| D | 0 | 20 | 0 |
| Quadrant | Total seconds | Saturated seconds | Saturation percentage |
|---|---|---|---|
| A | 18344 | 122 | 0.665068% |
| B | 18344 | 129 | 0.703227% |
| C | 18344 | 77 | 0.419756% |
| D | 18344 | 258 | 1.406454% |
Noise dominated data is calculated using 1-second bins in cleaned event files. If a bin has >2000 counts, and if more than 50% of those come from <1% of pixels, then it is considered to be noise-dominated and hence unusable.
| Quadrant | # 1 sec bins | Bins with >0 counts | Bins with >2000 counts | High rate bins dominated by noise | Noise dominated (total time) | Noise dominated (detector-on time) | Marked lightcurve |
|---|---|---|---|---|---|---|---|
| A | 20284 | 18347 | 0 | 0 | 0.00% | 0.00% | 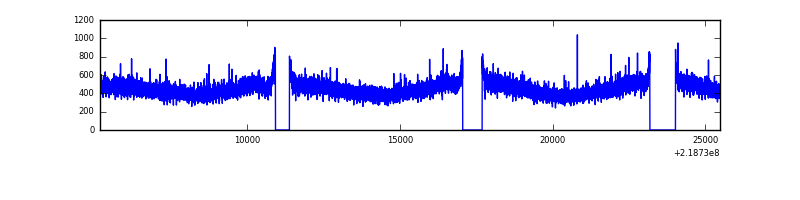 |
| B | 20284 | 18347 | 17 | 17 | 0.08% | 0.09% | 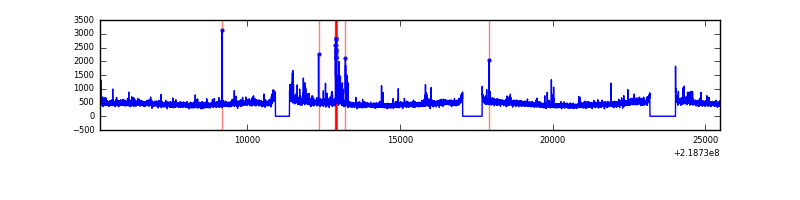 |
| C | 20284 | 18347 | 0 | 0 | 0.00% | 0.00% | 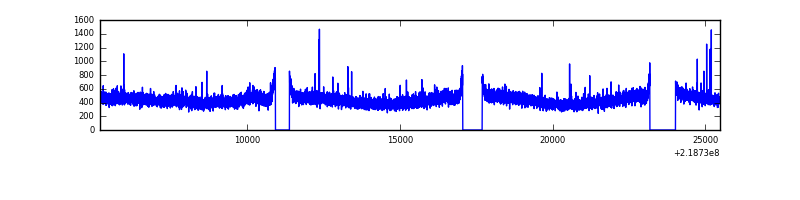 |
| D | 20284 | 18347 | 62 | 62 | 0.31% | 0.34% | 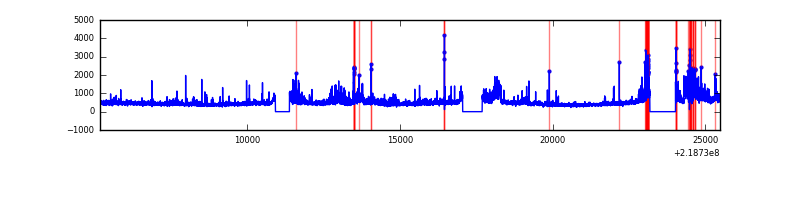 |
Top three noisy pixels from each quadrant. If the there are fewer than three noisy pixels in the level2.evt file, extra rows are filled as -1
| Pixel properties | Quadrant properties | ||||||
|---|---|---|---|---|---|---|---|
| Quadrant | DetID | PixID | Counts | Sigma | Mean | Median | Sigma |
| A | 8 | 15 | 37232 | 82.37 | 2104 | 2054 | 427.1 |
| A | 10 | 133 | 25320 | 54.48 | 2104 | 2054 | 427.1 |
| A | 0 | 226 | 20016 | 42.06 | 2104 | 2054 | 427.1 |
| B | 0 | 228 | 200415 | 487.95 | 2119 | 2068 | 406.5 |
| B | 4 | 81 | 81869 | 196.32 | 2119 | 2068 | 406.5 |
| B | 15 | 204 | 50936 | 120.22 | 2119 | 2068 | 406.5 |
| C | 10 | 170 | 21647 | 41.4 | 2041 | 2048 | 473.5 |
| C | 8 | 128 | 18211 | 34.14 | 2041 | 2048 | 473.5 |
| C | 9 | 54 | 16893 | 31.35 | 2041 | 2048 | 473.5 |
| D | 2 | 63 | 1207827 | 2413.36 | 2037 | 1969 | 499.7 |
| D | 8 | 195 | 315113 | 626.71 | 2037 | 1969 | 499.7 |
| D | 2 | 136 | 194940 | 386.2 | 2037 | 1969 | 499.7 |
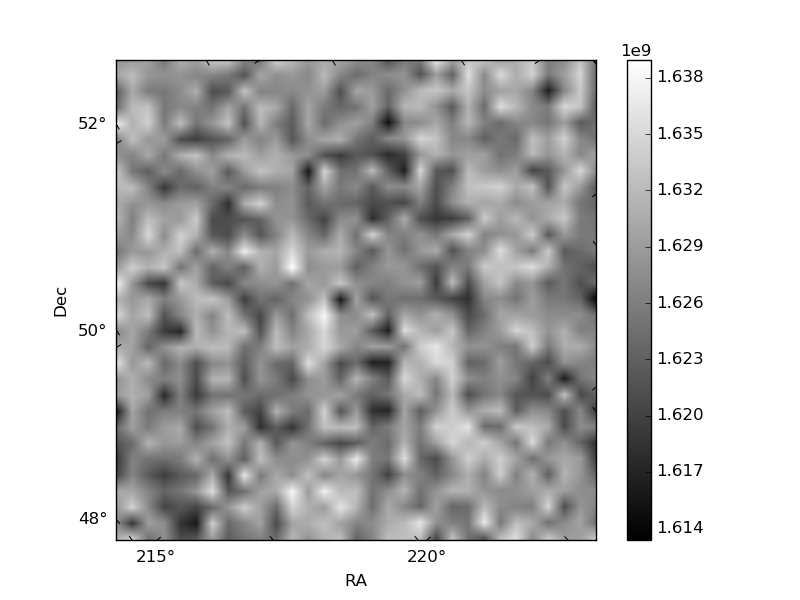
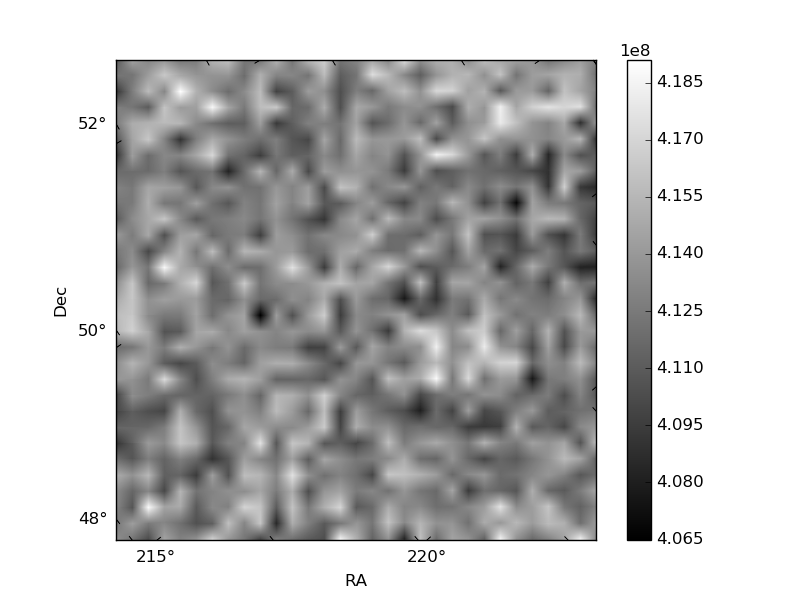
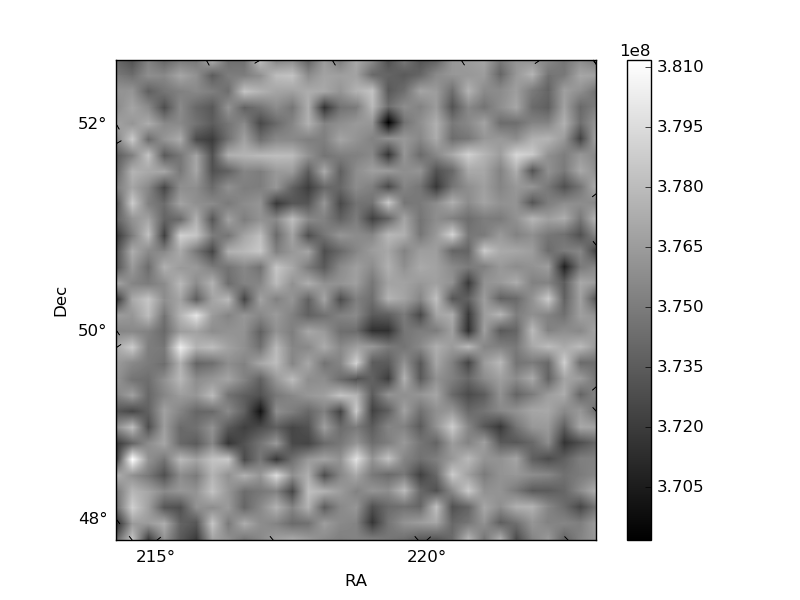
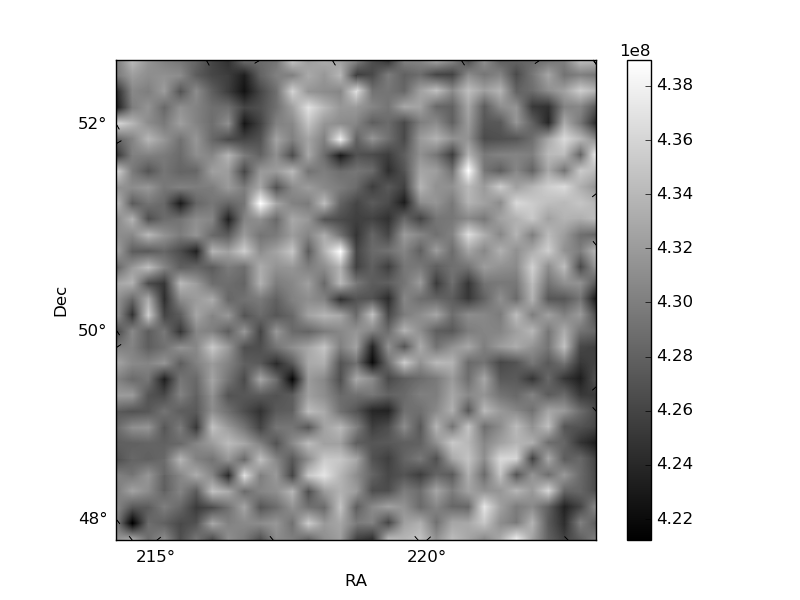
Histogram calculated using DETX and DETY for each event in the final _common_clean file
| Quadrant A | 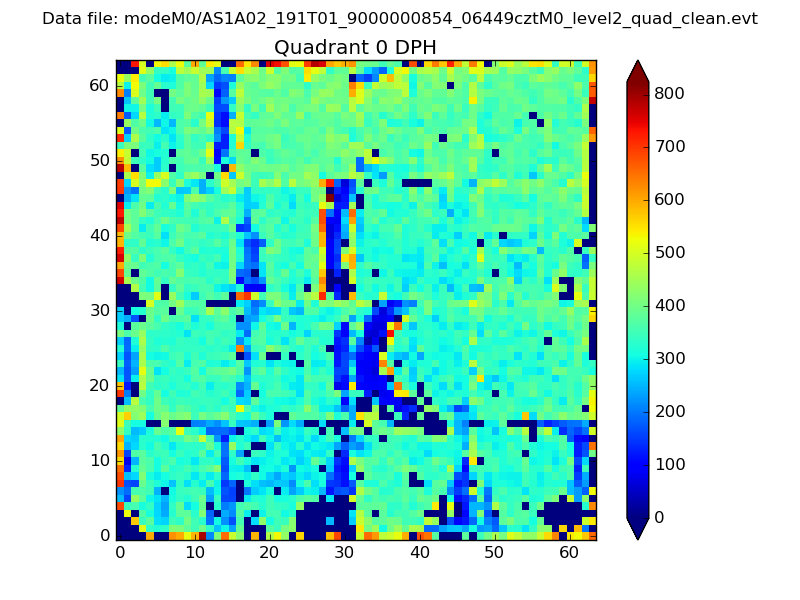 |
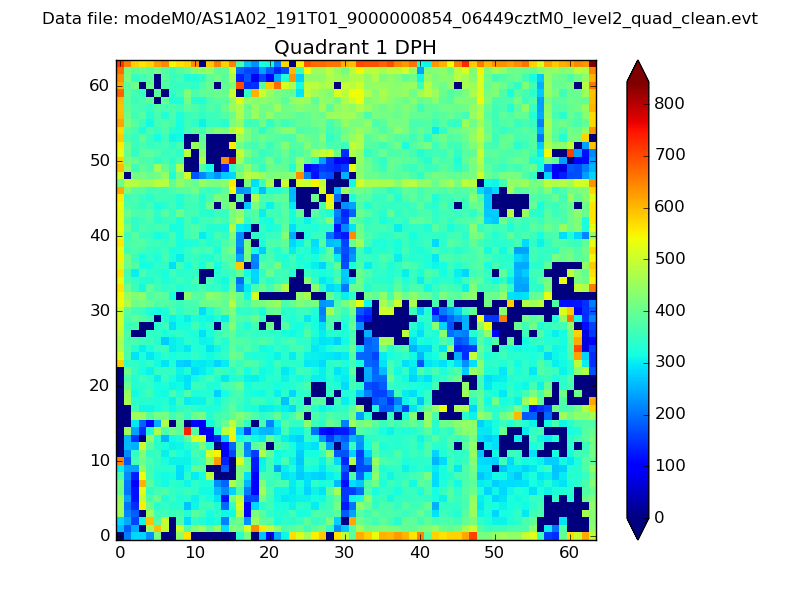 |
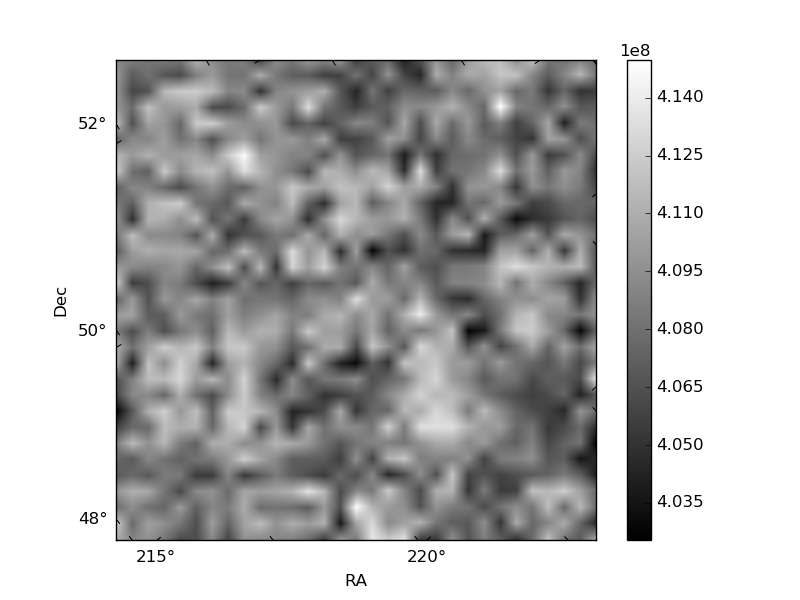
Quadrant B |
|---|---|---|---|
| Quadrant D | 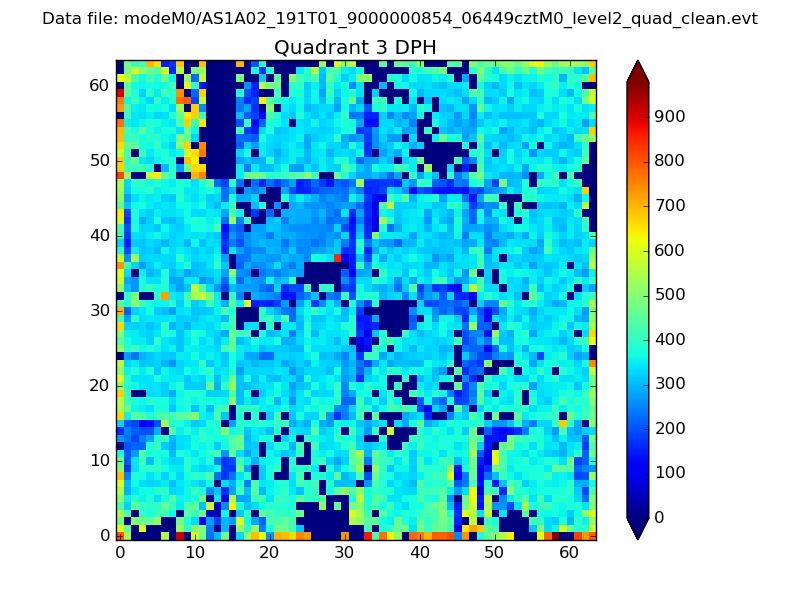 |
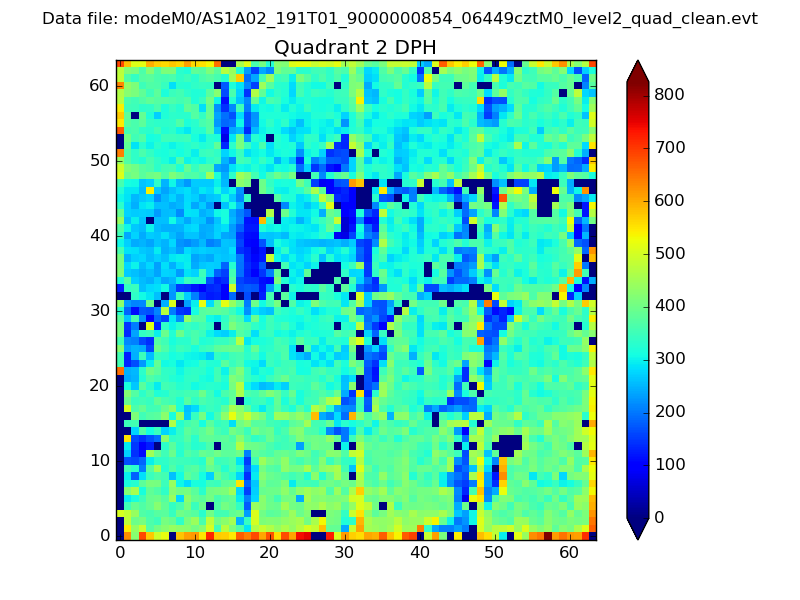 |
Quadrant C |
| Plot type | Count rate plots | Images |
|---|---|---|
| Comparison with Poisson distribution Blue bars denote a histogram of data divided into 1 sec bins. Red curve is a Poisson curve with rate = median count rate of data. |
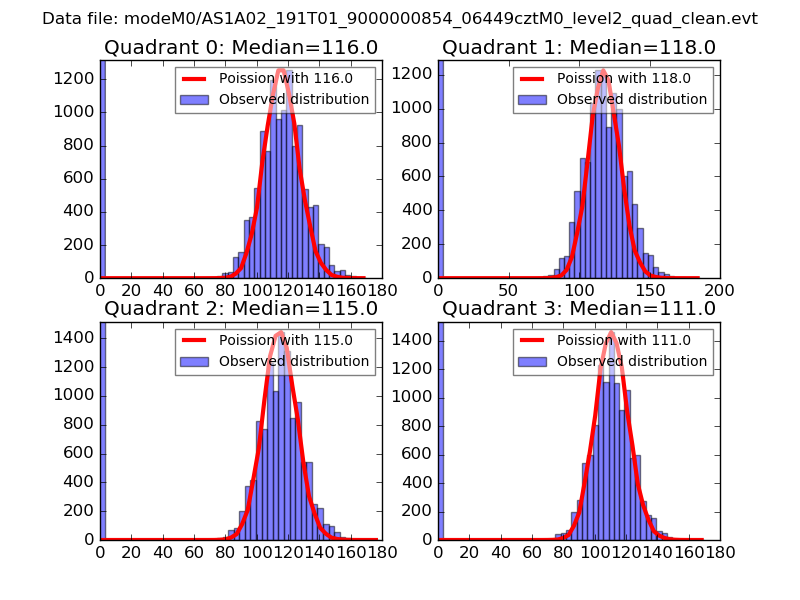 |
 |
| Quadrant-wise count rates Data is divided into 100 sec bins |
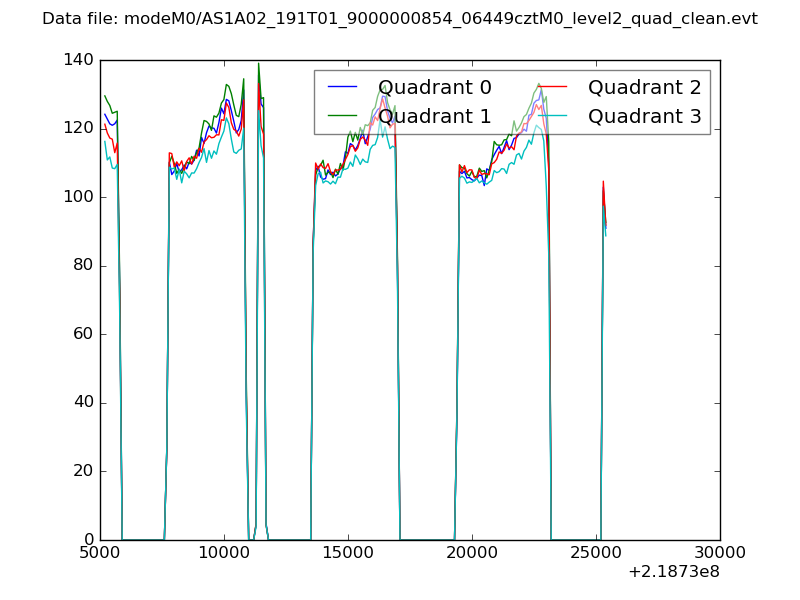 |
|
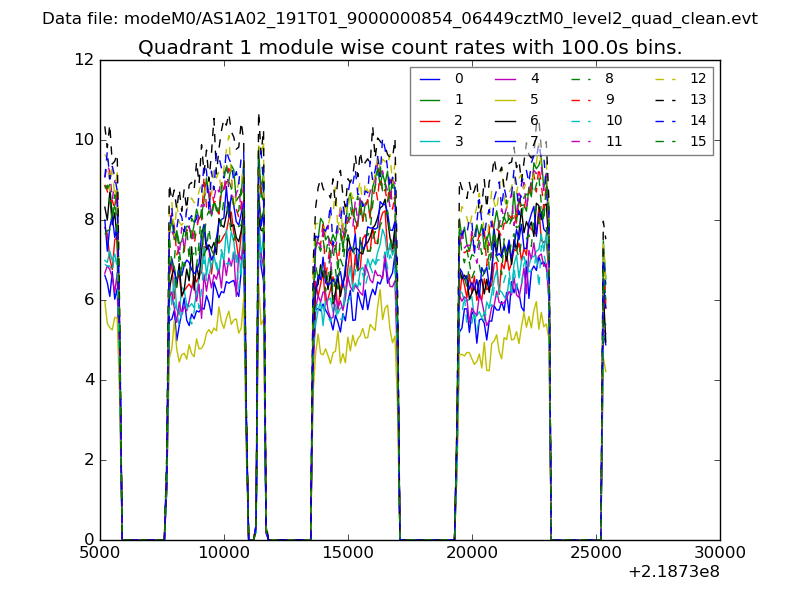
| Module-wise count rates for Quadrant A Data is divided into 100 sec bins |
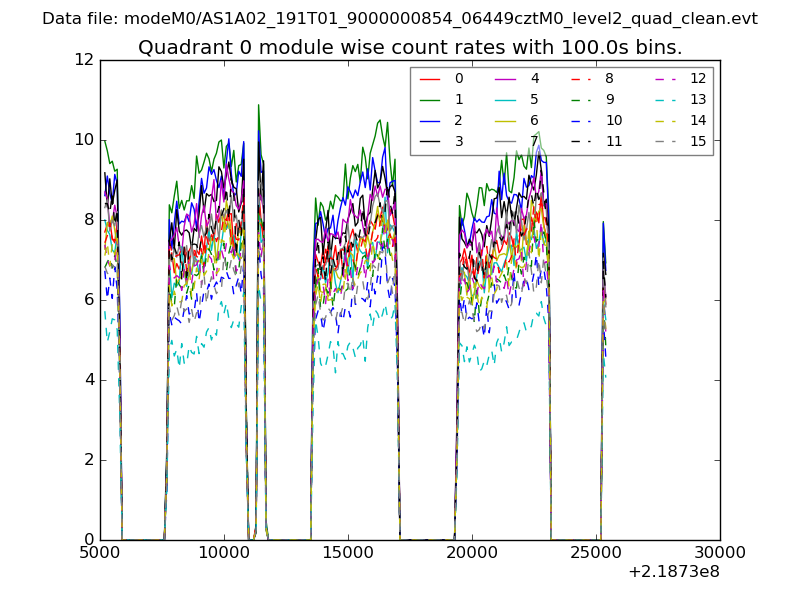 |
 |
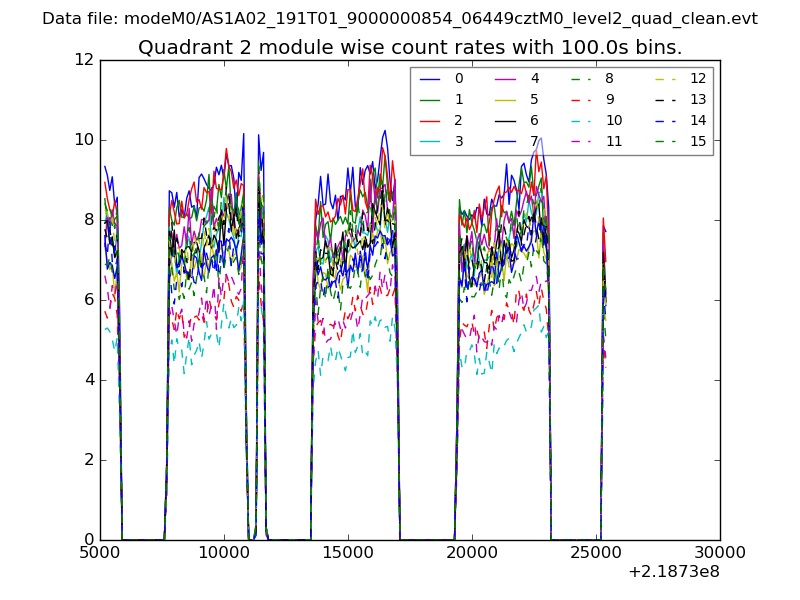
| Module-wise count rates for Quadrant B Data is divided into 100 sec bins |
 |
 |
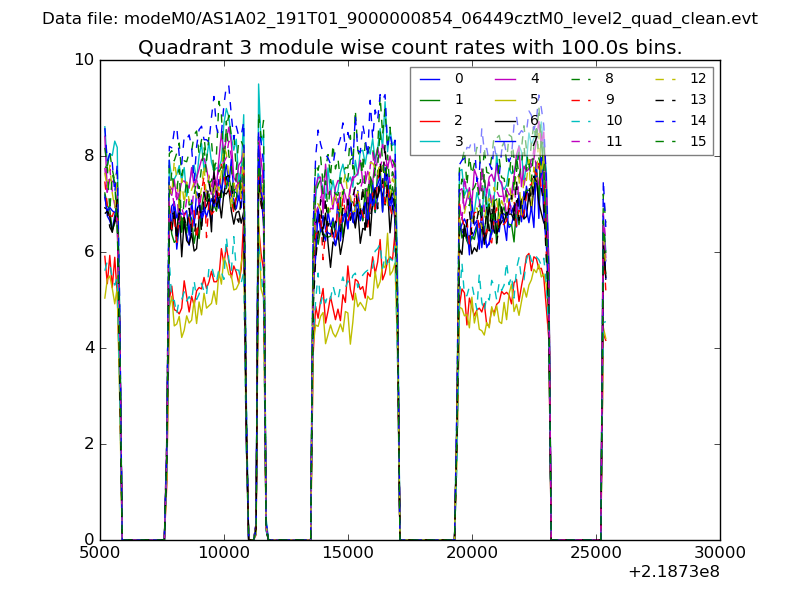
| Module-wise count rates for Quadrant C Data is divided into 100 sec bins |
 |
 |
| Module-wise count rates for Quadrant D Data is divided into 100 sec bins |
 |
 |
| Parameter | Plot |
|---|---|
| CZT HV Monitor | 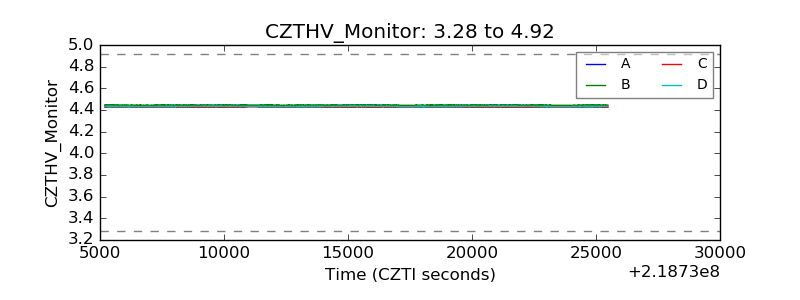 |
| D_VDD | 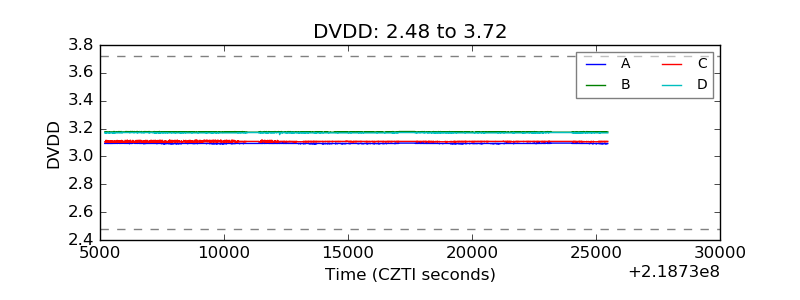 |
| Temperature 1 | 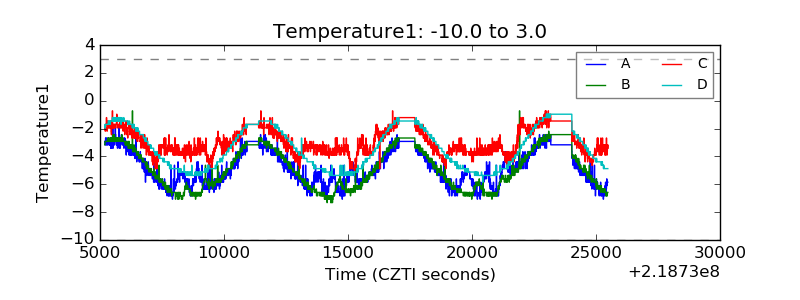 |
| Veto HV Monitor | 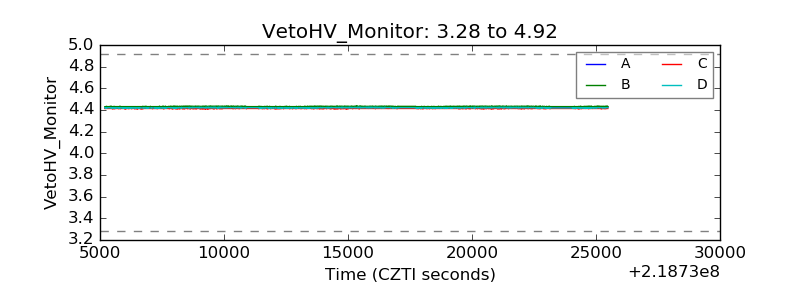 |
| Veto LLD | 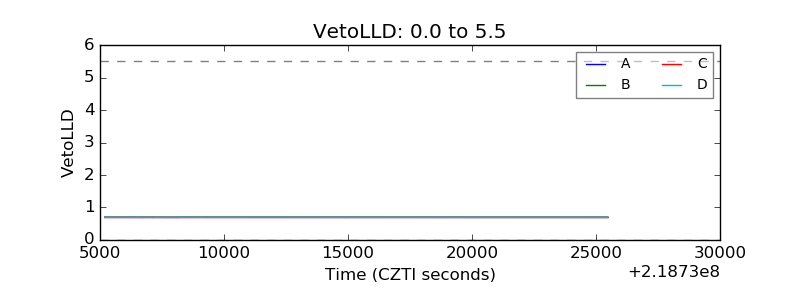 |
| Alpha Counter | 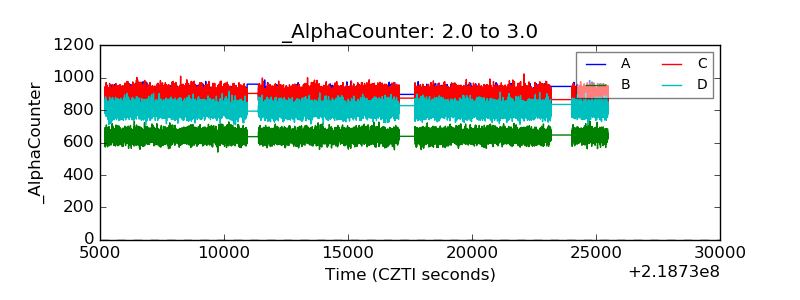 |
| _CPM_Rate | 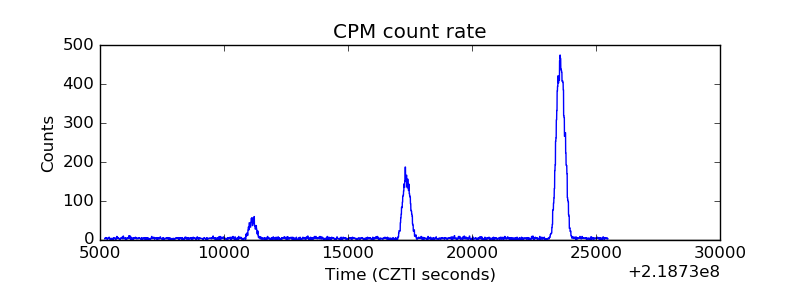 |
| CZT Counter | 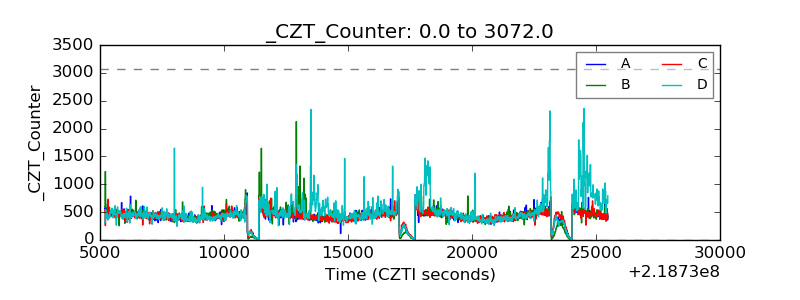 |
| +2.5 Volts monitor |  |
| +5 Volts monitor | 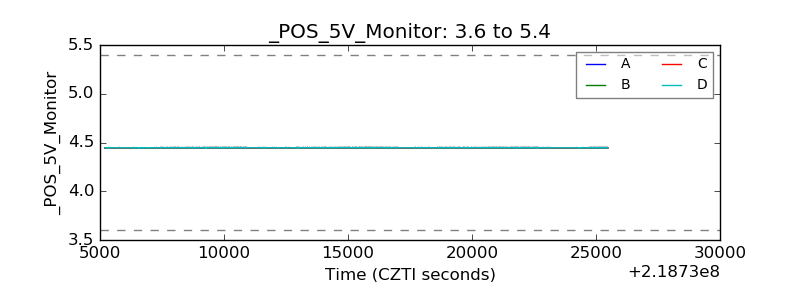 |
| _ROLL_ROT | 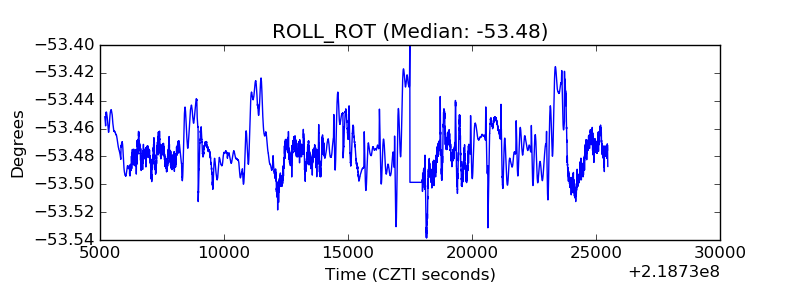 |
| _Roll_DEC | 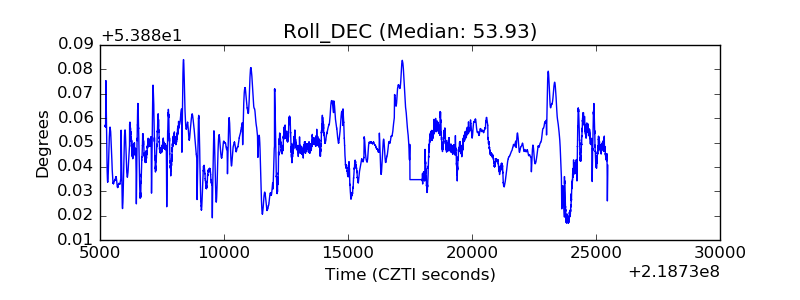 |
| _Roll_RA | 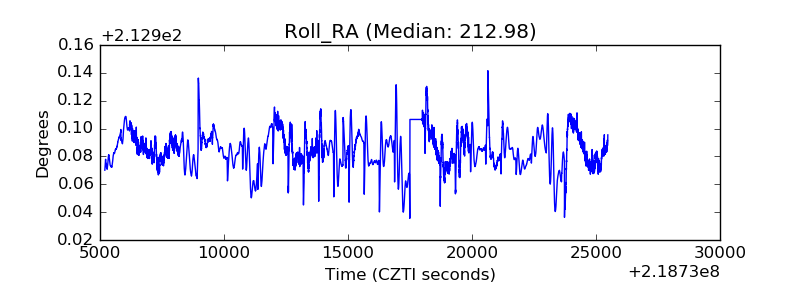 |
| Veto Counter | 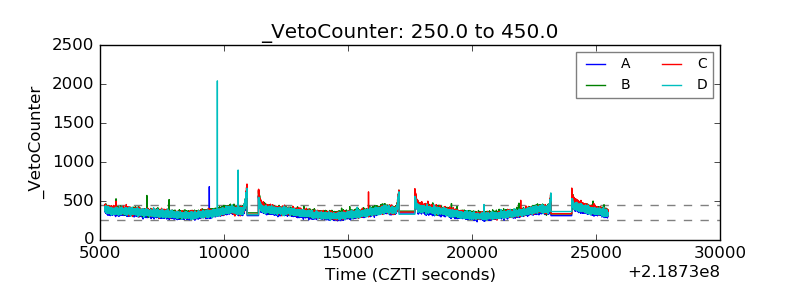 |