| Param | Original file | Final file |
|---|---|---|
| Filename | modeM0/AS1A02_191T01_9000000854_06450cztM0_level2.evt | modeM0/AS1A02_191T01_9000000854_06450cztM0_level2_quad_clean.evt |
| Size (bytes) | 515,309,760 | 87,408,000 |
| Size | 491.4 MB | 83.4 MB |
| Events in quadrant A | 3,142,726 | 546,051 |
| Events in quadrant B | 3,234,514 | 556,950 |
| Events in quadrant C | 3,105,143 | 545,791 |
| Events in quadrant D | 5,652,533 | 514,359 |
| Mode SS | |||
|---|---|---|---|
| Quadrant | BADHDUFLAG | Total packets | Discarded packets |
| A | 0 | 142 | 0 |
| B | 0 | 142 | 0 |
| C | 0 | 142 | 0 |
| D | 0 | 142 | 0 |
| Mode M0 | |||
|---|---|---|---|
| Quadrant | BADHDUFLAG | Total packets | Discarded packets |
| A | 0 | 14185 | 3 |
| B | 0 | 14369 | 2 |
| C | 0 | 14172 | 2 |
| D | 0 | 21785 | 2 |
| Mode M9 | |||
|---|---|---|---|
| Quadrant | BADHDUFLAG | Total packets | Discarded packets |
| A | 0 | 18 | 0 |
| B | 0 | 18 | 0 |
| C | 0 | 18 | 0 |
| D | 0 | 18 | 0 |
| Quadrant | Total seconds | Saturated seconds | Saturation percentage |
|---|---|---|---|
| A | 6948 | 36 | 0.518135% |
| B | 6948 | 44 | 0.633276% |
| C | 6948 | 24 | 0.345423% |
| D | 6948 | 310 | 4.461716% |
Noise dominated data is calculated using 1-second bins in cleaned event files. If a bin has >2000 counts, and if more than 50% of those come from <1% of pixels, then it is considered to be noise-dominated and hence unusable.
| Quadrant | # 1 sec bins | Bins with >0 counts | Bins with >2000 counts | High rate bins dominated by noise | Noise dominated (total time) | Noise dominated (detector-on time) | Marked lightcurve |
|---|---|---|---|---|---|---|---|
| A | 8768 | 6950 | 0 | 0 | 0.00% | 0.00% |  |
| B | 8768 | 6950 | 0 | 0 | 0.00% | 0.00% |  |
| C | 8768 | 6950 | 0 | 0 | 0.00% | 0.00% |  |
| D | 8768 | 6950 | 124 | 124 | 1.41% | 1.78% | 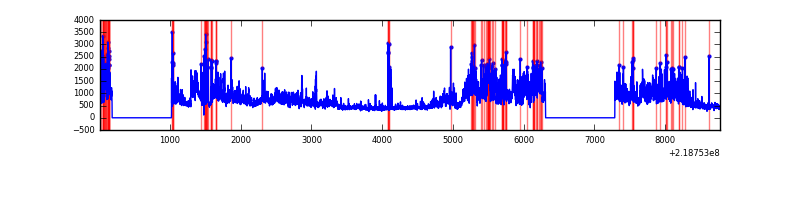 |
Top three noisy pixels from each quadrant. If the there are fewer than three noisy pixels in the level2.evt file, extra rows are filled as -1
| Pixel properties | Quadrant properties | ||||||
|---|---|---|---|---|---|---|---|
| Quadrant | DetID | PixID | Counts | Sigma | Mean | Median | Sigma |
| A | 8 | 15 | 16531 | 94.64 | 809 | 792 | 166.3 |
| A | 0 | 226 | 7750 | 41.84 | 809 | 792 | 166.3 |
| A | 12 | 194 | 7483 | 40.23 | 809 | 792 | 166.3 |
| B | 4 | 81 | 22504 | 135.89 | 821 | 800 | 159.7 |
| B | 12 | 111 | 16360 | 97.42 | 821 | 800 | 159.7 |
| B | 0 | 228 | 15475 | 91.88 | 821 | 800 | 159.7 |
| C | 9 | 54 | 8861 | 43.79 | 790 | 791 | 184.3 |
| C | 13 | 61 | 6269 | 29.72 | 790 | 791 | 184.3 |
| C | 1 | 16 | 6201 | 29.35 | 790 | 791 | 184.3 |
| D | 2 | 63 | 2389765 | 12510.19 | 779 | 754 | 191.0 |
| D | 8 | 195 | 110221 | 573.23 | 779 | 754 | 191.0 |
| D | 2 | 136 | 66858 | 346.16 | 779 | 754 | 191.0 |
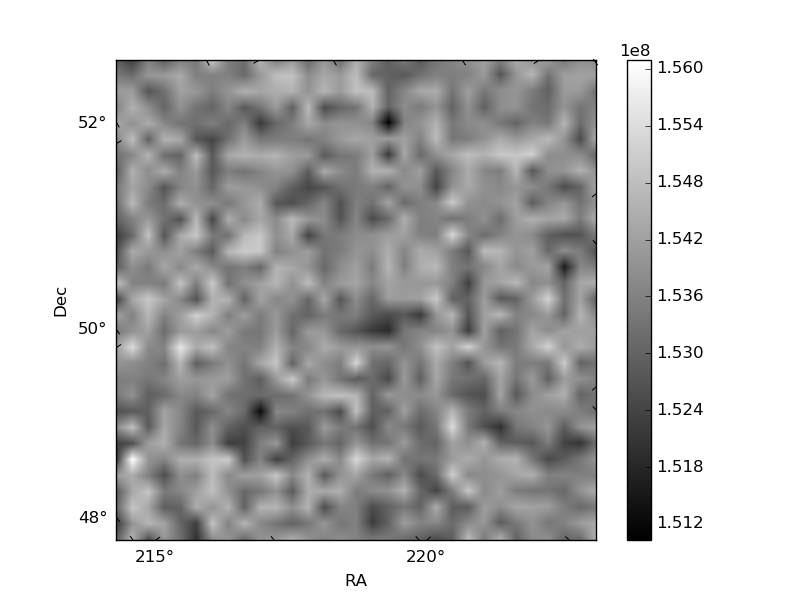
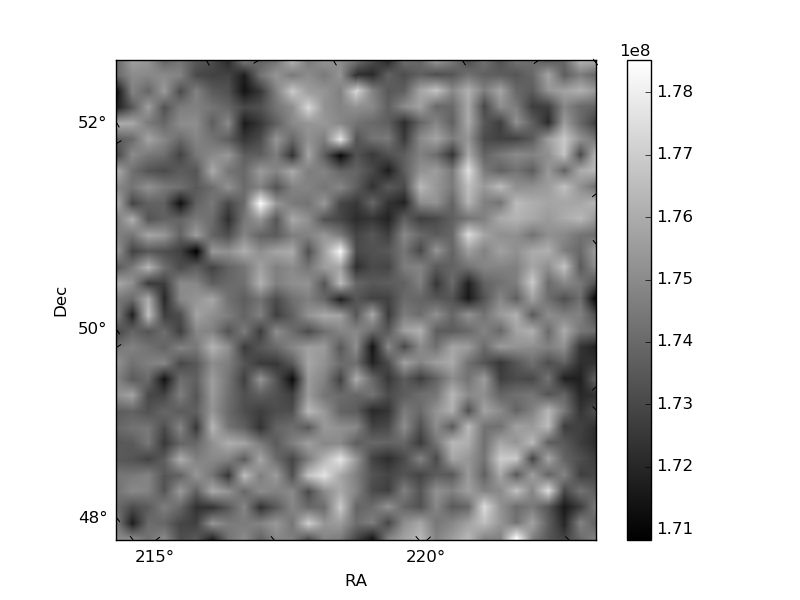
Histogram calculated using DETX and DETY for each event in the final _common_clean file
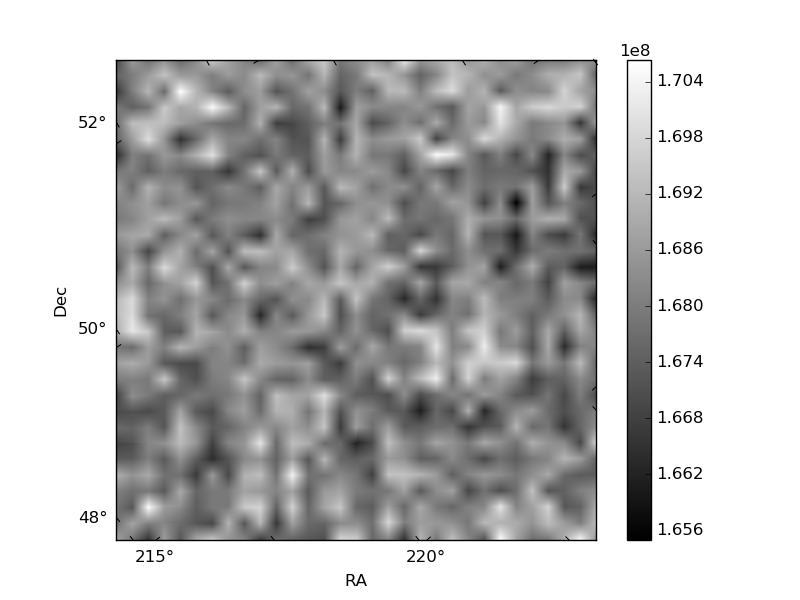
| Quadrant A | 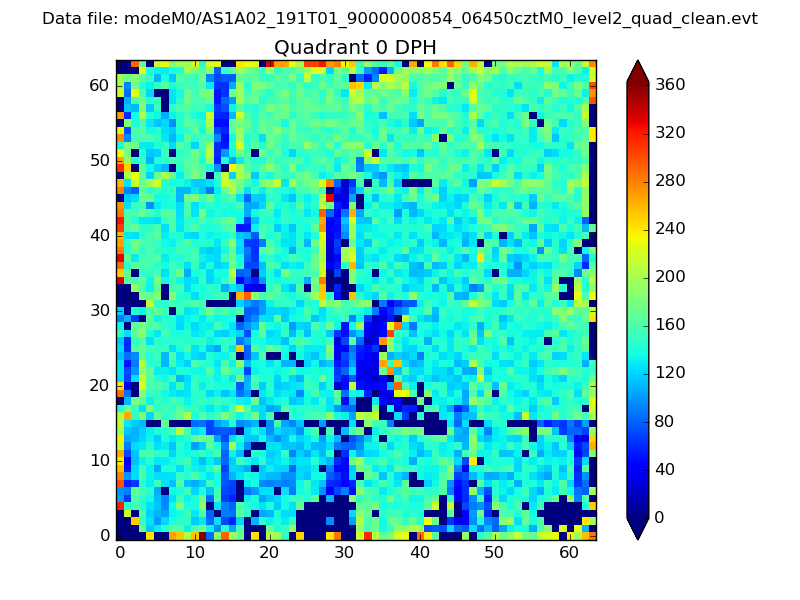 |
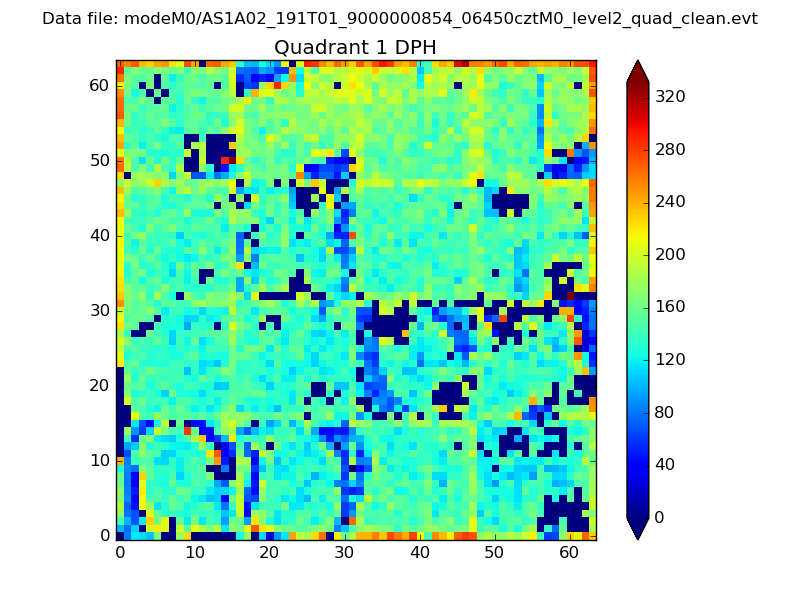 |
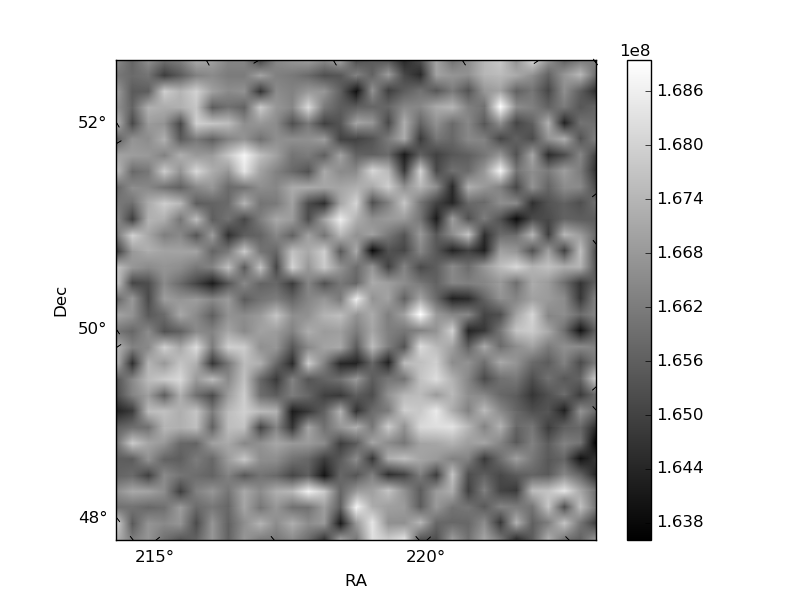
Quadrant B |
|---|---|---|---|
| Quadrant D | 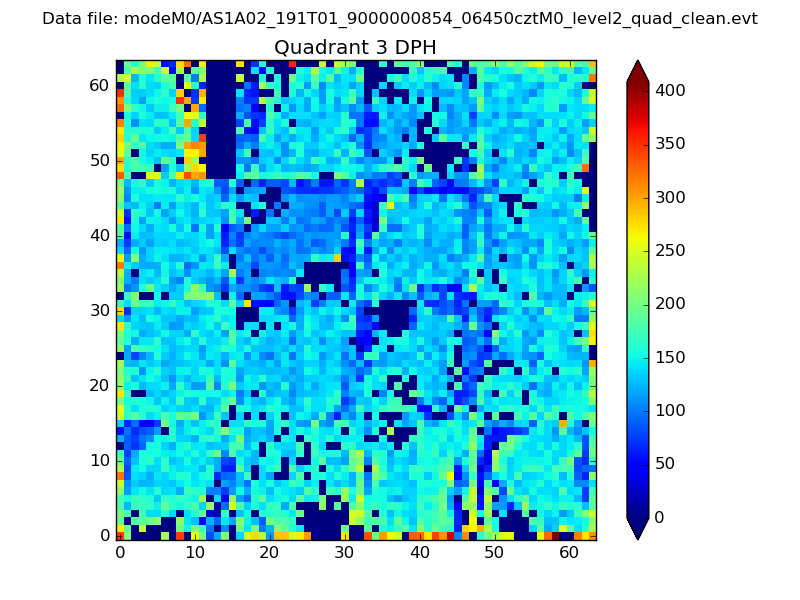 |
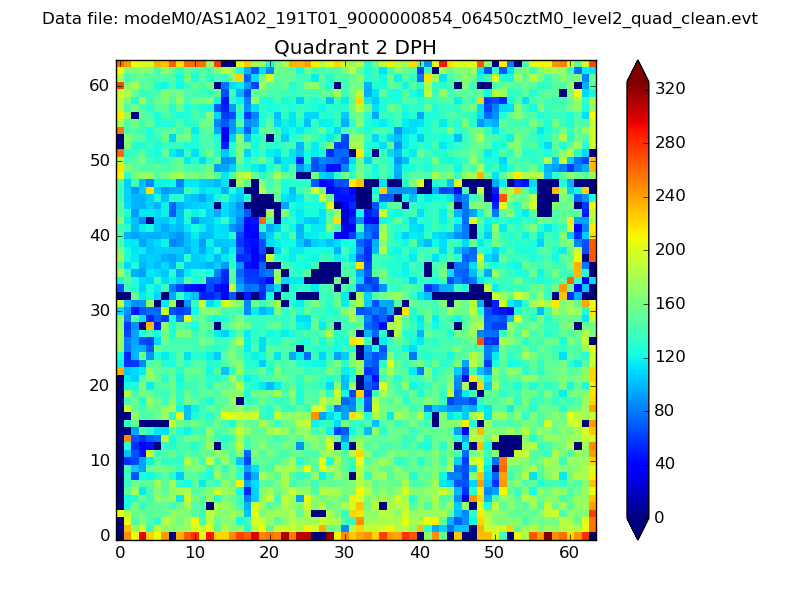 |
Quadrant C |
| Plot type | Count rate plots | Images |
|---|---|---|
| Comparison with Poisson distribution Blue bars denote a histogram of data divided into 1 sec bins. Red curve is a Poisson curve with rate = median count rate of data. |
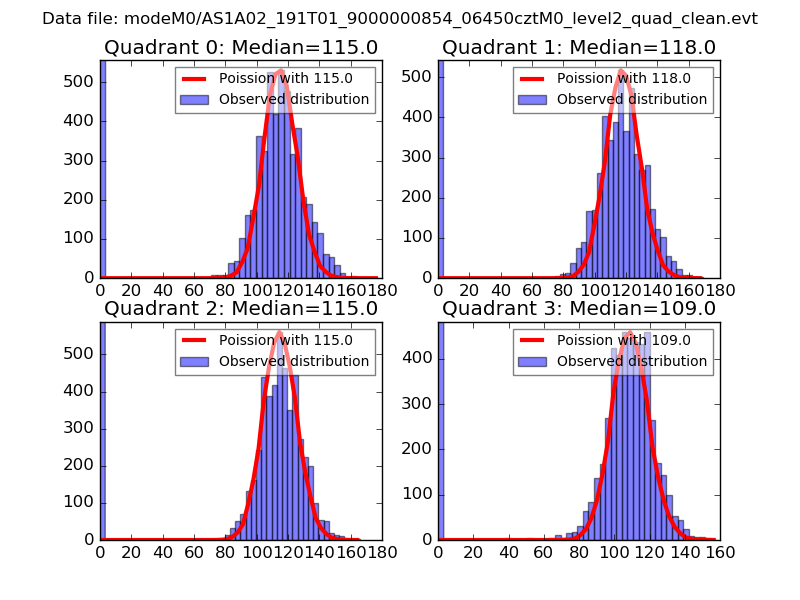 |
 |
| Quadrant-wise count rates Data is divided into 100 sec bins |
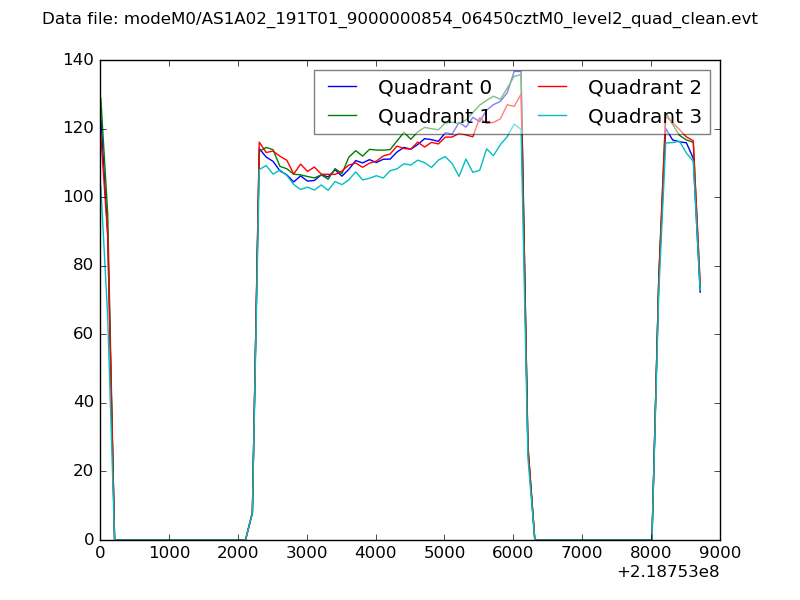 |
|
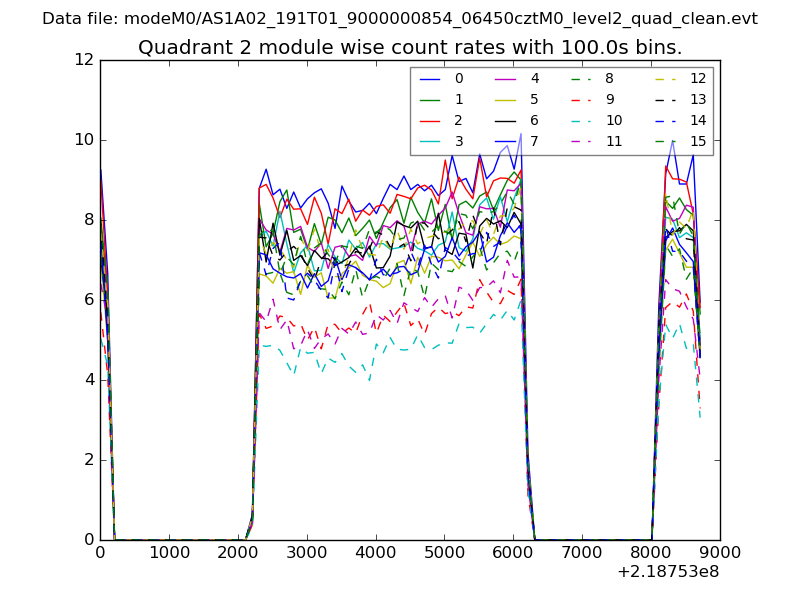
| Module-wise count rates for Quadrant A Data is divided into 100 sec bins |
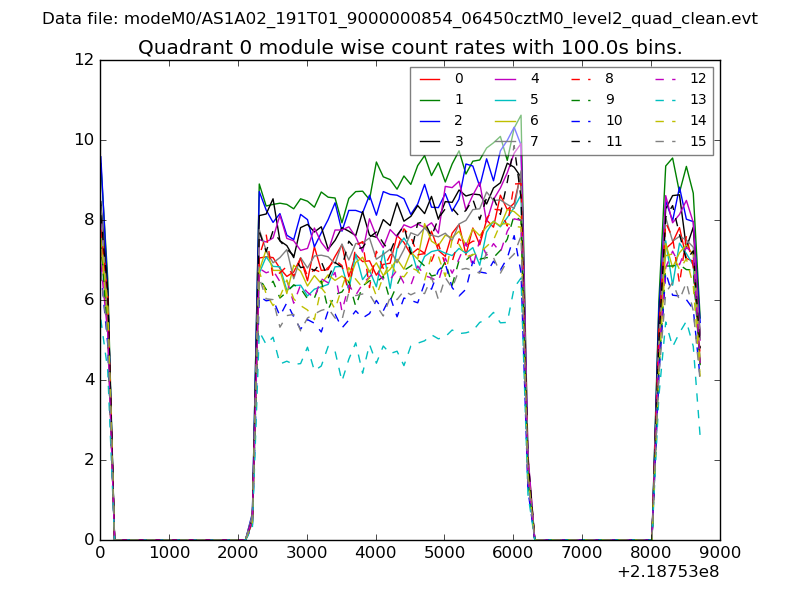 |
 |
| Module-wise count rates for Quadrant B Data is divided into 100 sec bins |
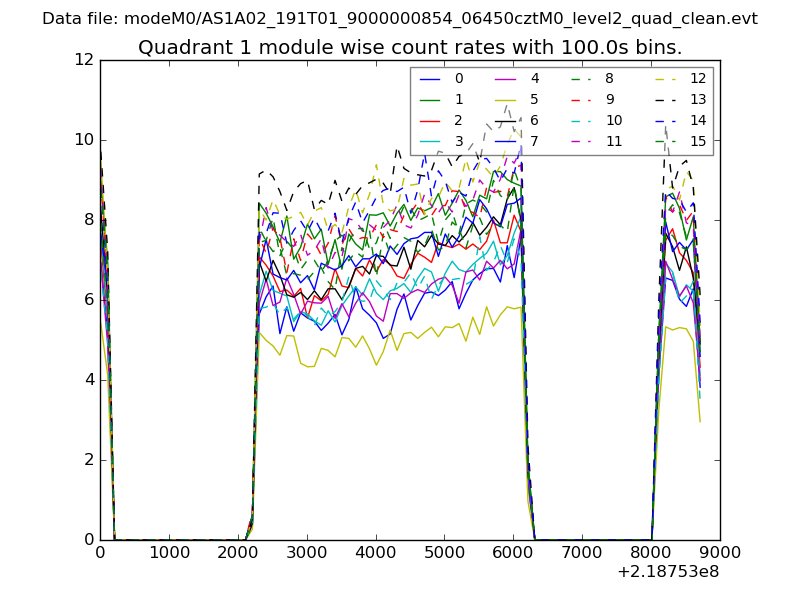 |
 |
| Module-wise count rates for Quadrant C Data is divided into 100 sec bins |
 |
 |
| Module-wise count rates for Quadrant D Data is divided into 100 sec bins |
 |
 |
| Parameter | Plot |
|---|---|
| CZT HV Monitor | 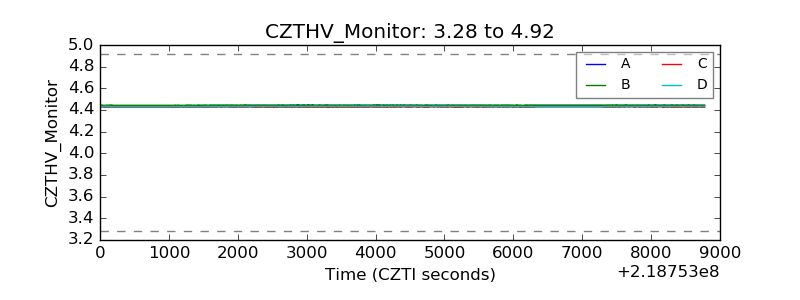 |
| D_VDD | 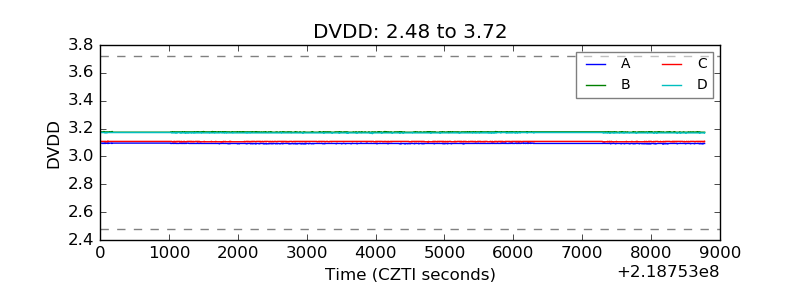 |
| Temperature 1 | 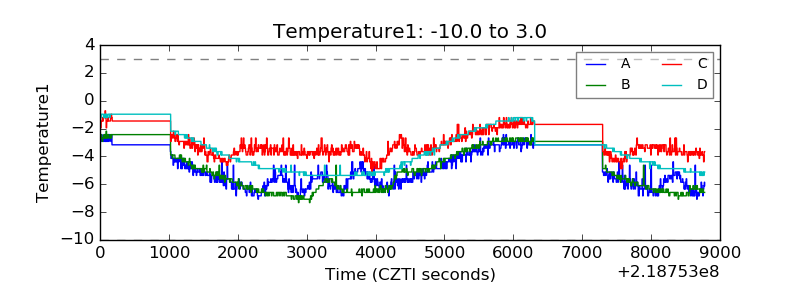 |
| Veto HV Monitor | 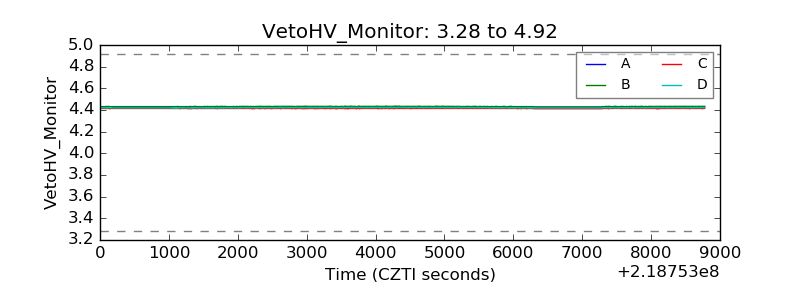 |
| Veto LLD | 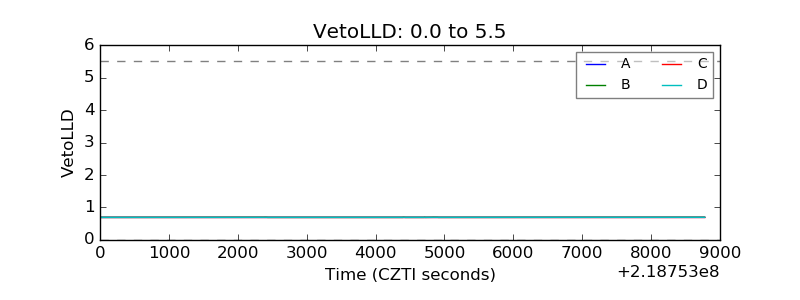 |
| Alpha Counter | 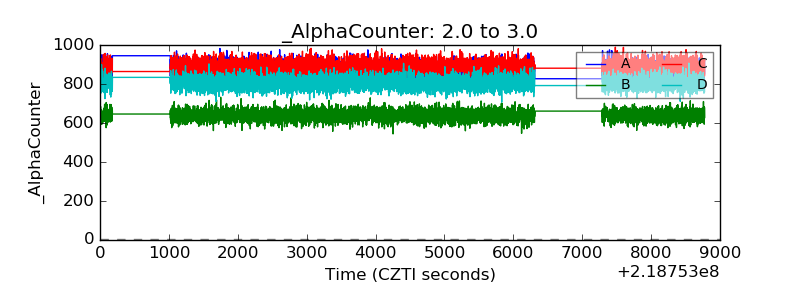 |
| _CPM_Rate | 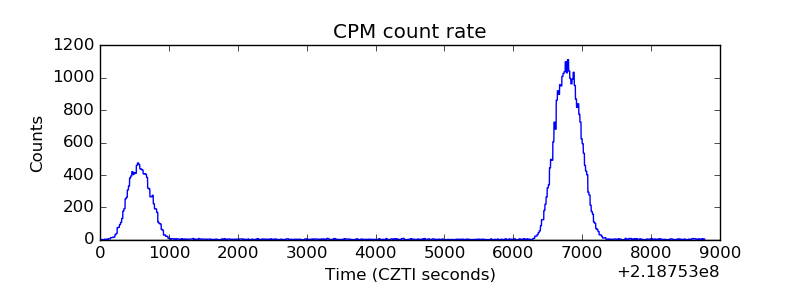 |
| CZT Counter | 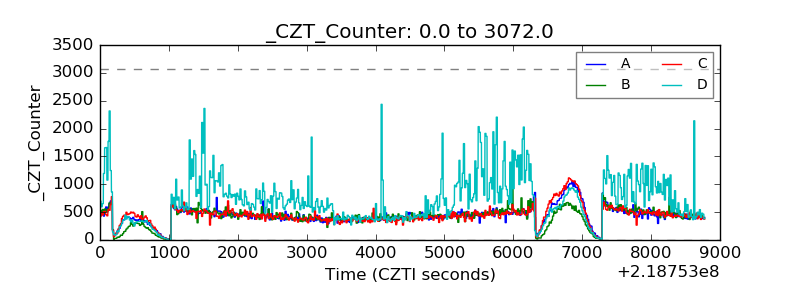 |
| +2.5 Volts monitor |  |
| +5 Volts monitor |  |
| _ROLL_ROT |  |
| _Roll_DEC | 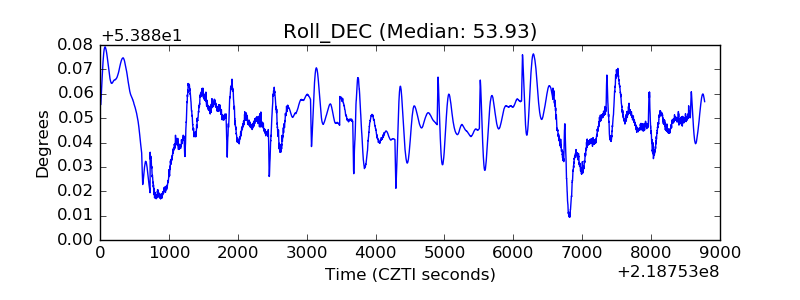 |
| _Roll_RA | 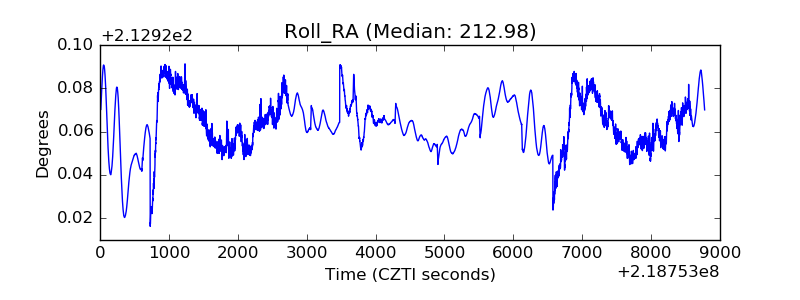 |
| Veto Counter | 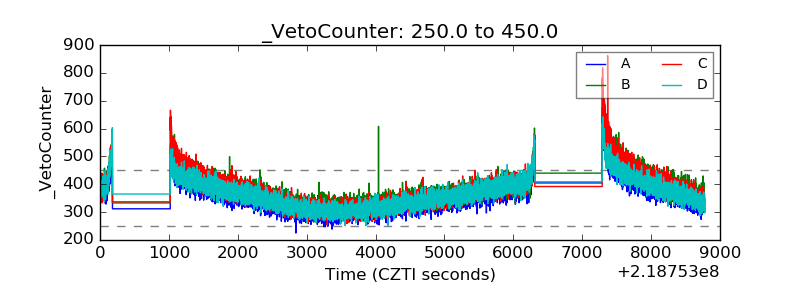 |