| Param | Original file | Final file |
|---|---|---|
| Filename | modeM0/AS1A02_191T01_9000000854_06453cztM0_level2.evt | modeM0/AS1A02_191T01_9000000854_06453cztM0_level2_quad_clean.evt |
| Size (bytes) | 594,792,000 | 99,587,520 |
| Size | 567.2 MB | 95.0 MB |
| Events in quadrant A | 2,941,128 | 661,516 |
| Events in quadrant B | 3,021,461 | 685,402 |
| Events in quadrant C | 2,921,297 | 660,398 |
| Events in quadrant D | 8,695,018 | 561,201 |
| Mode SS | |||
|---|---|---|---|
| Quadrant | BADHDUFLAG | Total packets | Discarded packets |
| A | 0 | 132 | 0 |
| B | 0 | 132 | 0 |
| C | 0 | 132 | 0 |
| D | 0 | 132 | 0 |
| Mode M0 | |||
|---|---|---|---|
| Quadrant | BADHDUFLAG | Total packets | Discarded packets |
| A | 0 | 13138 | 3 |
| B | 0 | 13322 | 2 |
| C | 0 | 13230 | 2 |
| D | 0 | 30350 | 2 |
| Mode M9 | |||
|---|---|---|---|
| Quadrant | BADHDUFLAG | Total packets | Discarded packets |
| A | 0 | 19 | 0 |
| B | 0 | 19 | 0 |
| C | 0 | 19 | 0 |
| D | 0 | 20 | 0 |
| Quadrant | Total seconds | Saturated seconds | Saturation percentage |
|---|---|---|---|
| A | 6401 | 19 | 0.296829% |
| B | 6401 | 23 | 0.359319% |
| C | 6401 | 9 | 0.140603% |
| D | 6401 | 1851 | 28.917357% |
Noise dominated data is calculated using 1-second bins in cleaned event files. If a bin has >2000 counts, and if more than 50% of those come from <1% of pixels, then it is considered to be noise-dominated and hence unusable.
| Quadrant | # 1 sec bins | Bins with >0 counts | Bins with >2000 counts | High rate bins dominated by noise | Noise dominated (total time) | Noise dominated (detector-on time) | Marked lightcurve |
|---|---|---|---|---|---|---|---|
| A | 7621 | 6402 | 0 | 0 | 0.00% | 0.00% | 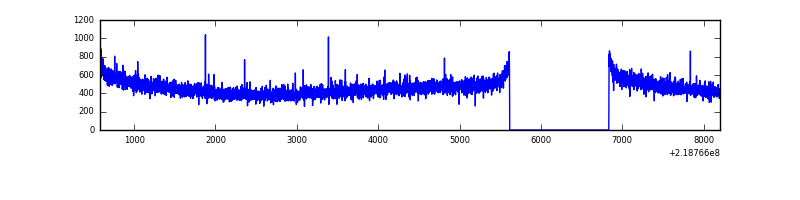 |
| B | 7621 | 6402 | 2 | 2 | 0.03% | 0.03% | 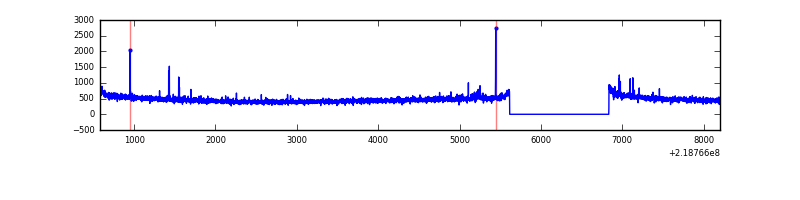 |
| C | 7621 | 6402 | 0 | 0 | 0.00% | 0.00% | 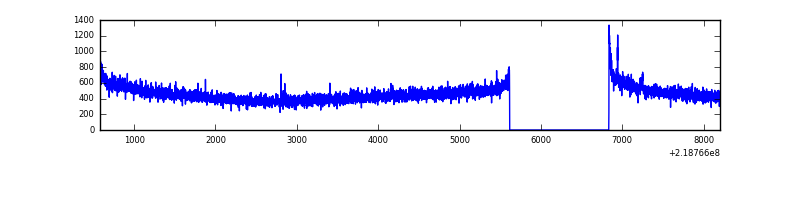 |
| D | 7621 | 6402 | 1605 | 1605 | 21.06% | 25.07% | 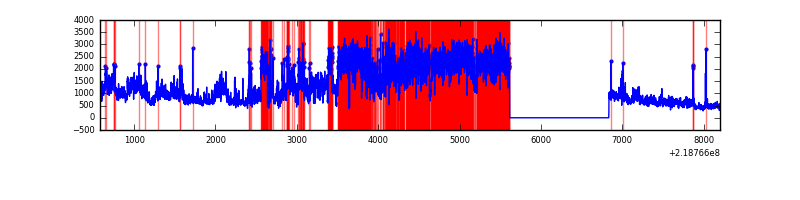 |
Top three noisy pixels from each quadrant. If the there are fewer than three noisy pixels in the level2.evt file, extra rows are filled as -1
| Pixel properties | Quadrant properties | ||||||
|---|---|---|---|---|---|---|---|
| Quadrant | DetID | PixID | Counts | Sigma | Mean | Median | Sigma |
| A | 8 | 15 | 12666 | 78.54 | 755 | 740 | 151.8 |
| A | 15 | 236 | 9287 | 56.29 | 755 | 740 | 151.8 |
| A | 10 | 133 | 9234 | 55.94 | 755 | 740 | 151.8 |
| B | 4 | 81 | 22690 | 151.24 | 767 | 751 | 145.1 |
| B | 12 | 111 | 14853 | 97.21 | 767 | 751 | 145.1 |
| B | 11 | 111 | 11840 | 76.44 | 767 | 751 | 145.1 |
| C | 1 | 16 | 53099 | 308.33 | 734 | 736 | 169.8 |
| C | 13 | 61 | 5739 | 29.46 | 734 | 736 | 169.8 |
| C | 10 | 170 | 3066 | 13.72 | 734 | 736 | 169.8 |
| D | 2 | 63 | 6065778 | 38488.74 | 640 | 622 | 157.6 |
| D | 13 | 169 | 71059 | 446.98 | 640 | 622 | 157.6 |
| D | 8 | 195 | 31036 | 193.0 | 640 | 622 | 157.6 |
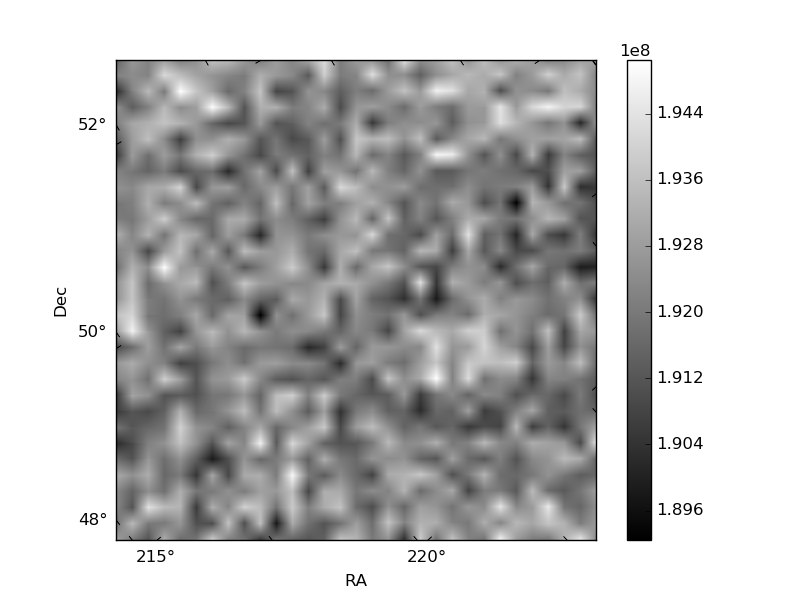
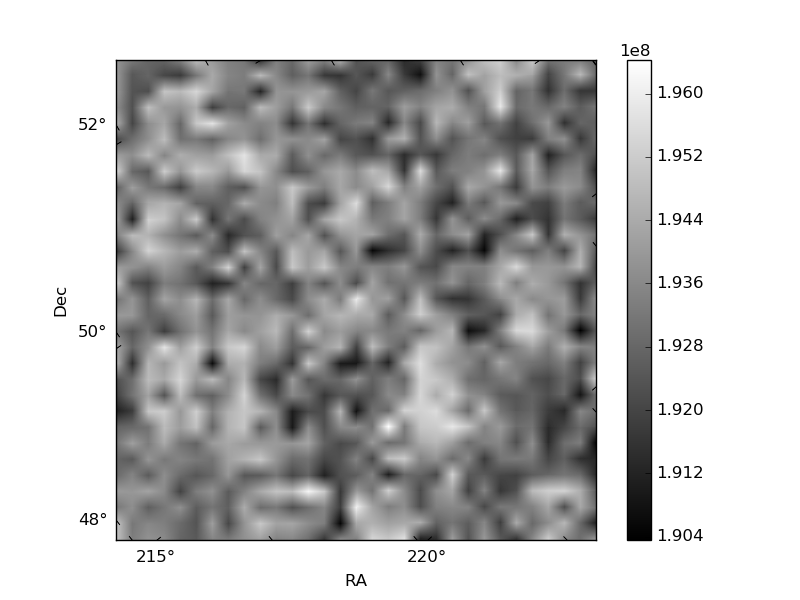
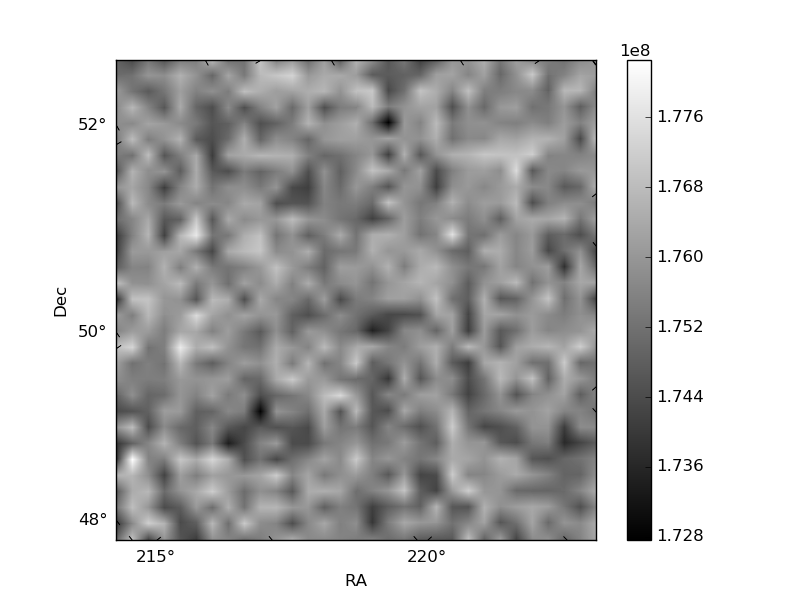
Histogram calculated using DETX and DETY for each event in the final _common_clean file
| Quadrant A | 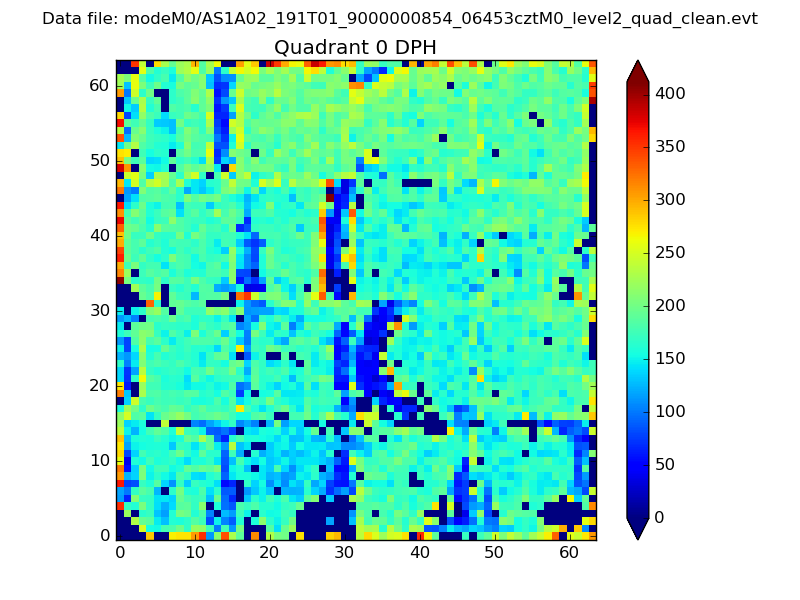 |
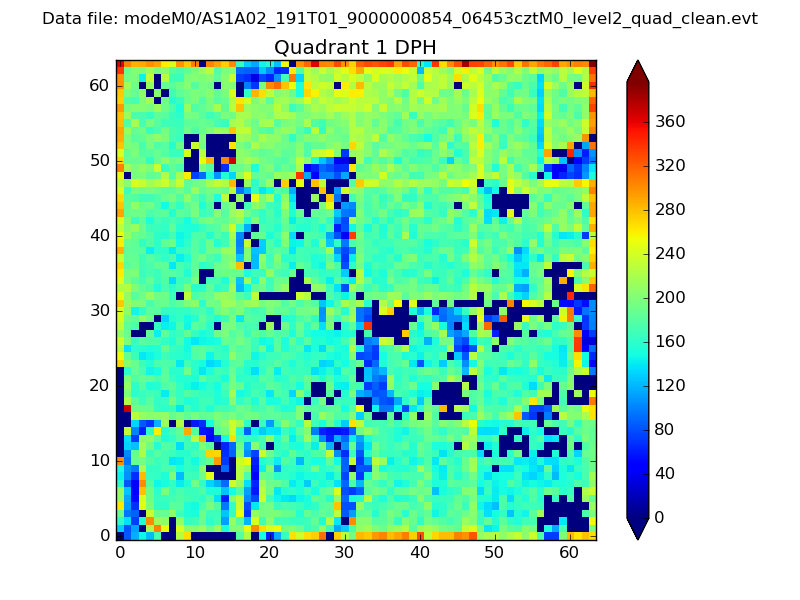 |
Quadrant B |
|---|---|---|---|
| Quadrant D | 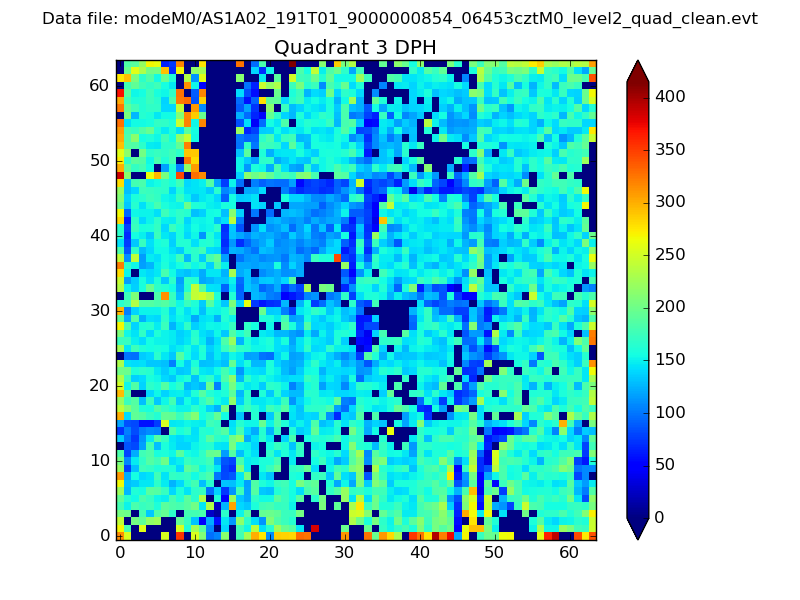 |
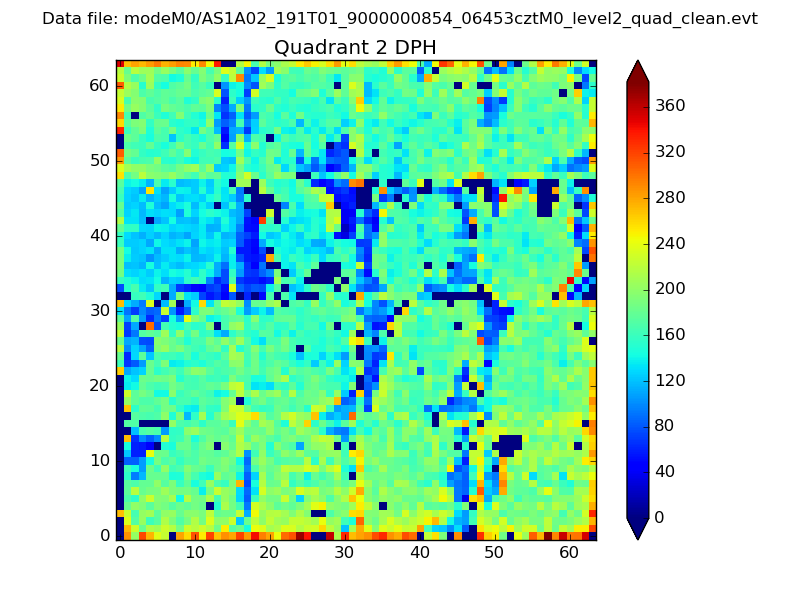 |
Quadrant C |
| Plot type | Count rate plots | Images |
|---|---|---|
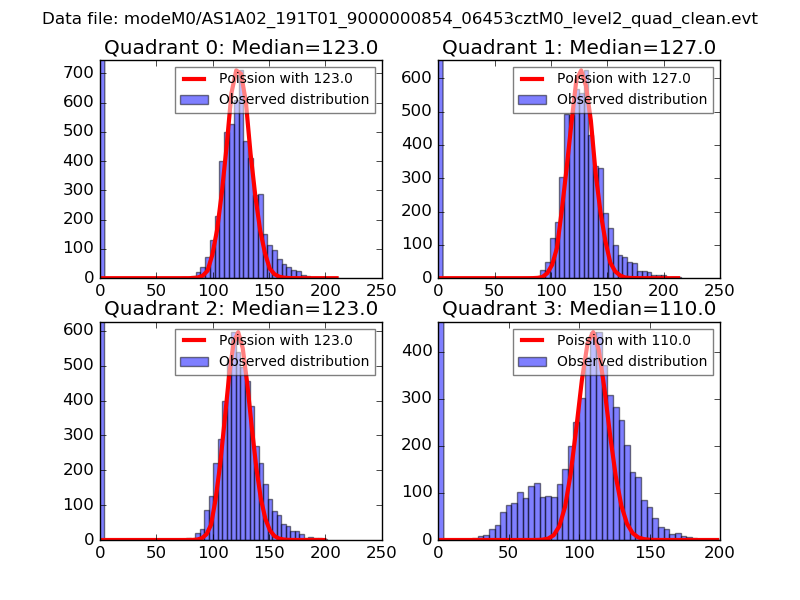
| Comparison with Poisson distribution Blue bars denote a histogram of data divided into 1 sec bins. Red curve is a Poisson curve with rate = median count rate of data. |
 |
 |
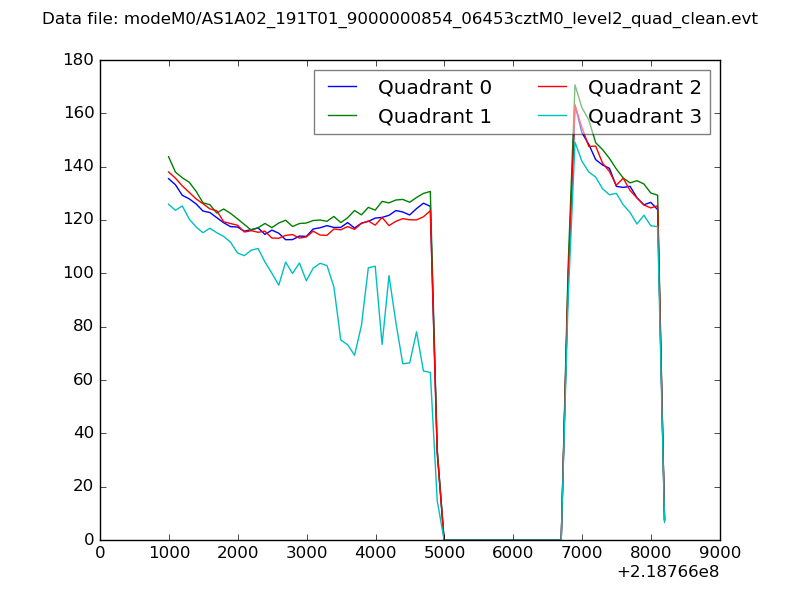
| Quadrant-wise count rates Data is divided into 100 sec bins |
 |
|
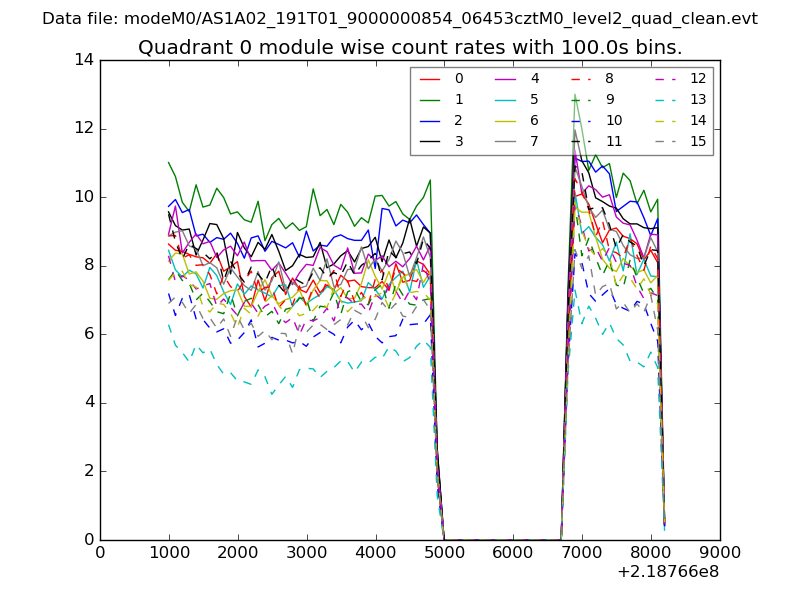
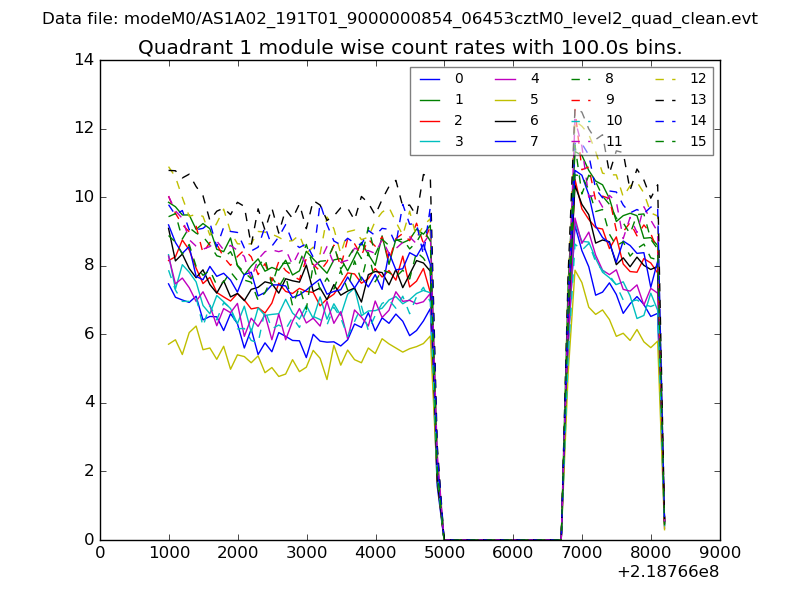
| Module-wise count rates for Quadrant A Data is divided into 100 sec bins |
 |
 |
| Module-wise count rates for Quadrant B Data is divided into 100 sec bins |
 |
 |
| Module-wise count rates for Quadrant C Data is divided into 100 sec bins |
 |
 |
| Module-wise count rates for Quadrant D Data is divided into 100 sec bins |
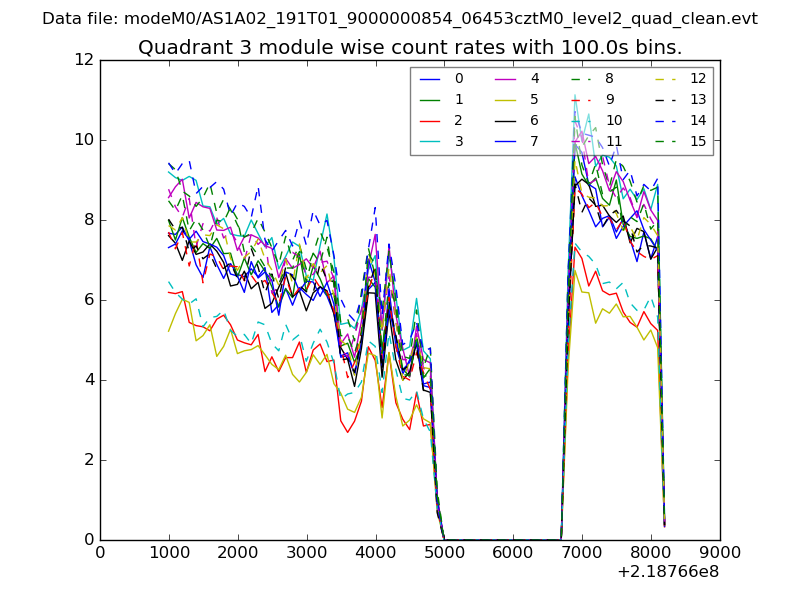 |
 |
| Parameter | Plot |
|---|---|
| CZT HV Monitor |  |
| D_VDD | 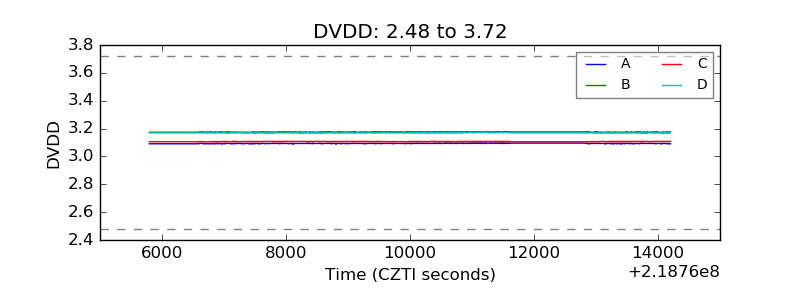 |
| Temperature 1 | 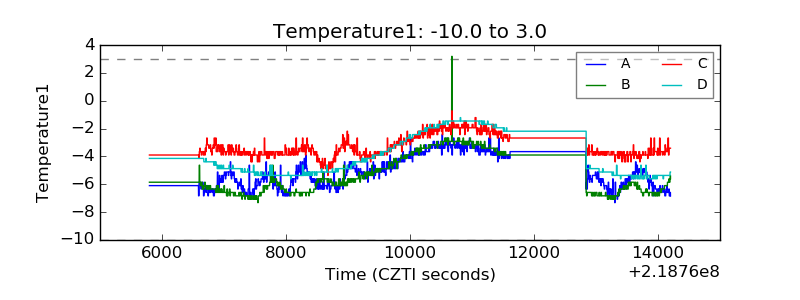 |
| Veto HV Monitor | 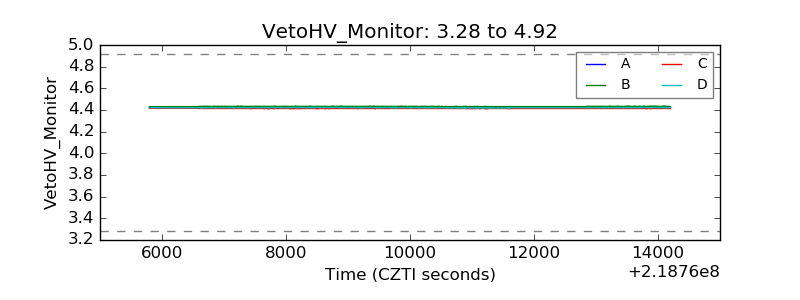 |
| Veto LLD | 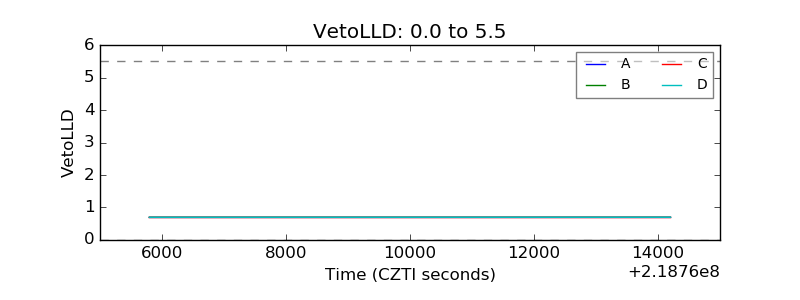 |
| Alpha Counter | 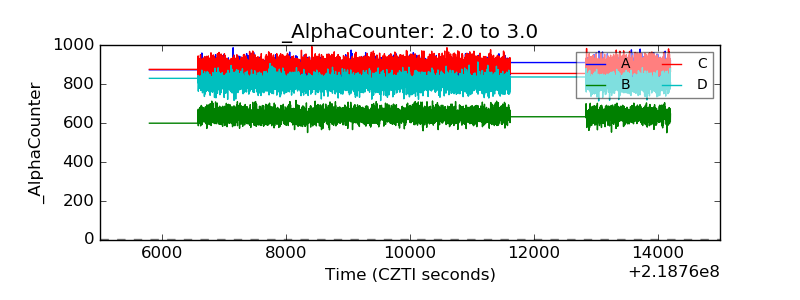 |
| _CPM_Rate | 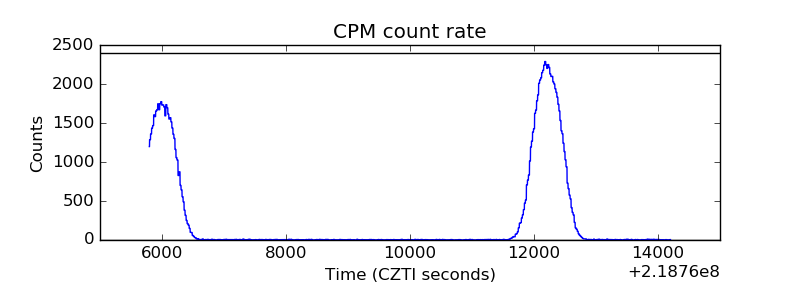 |
| CZT Counter | 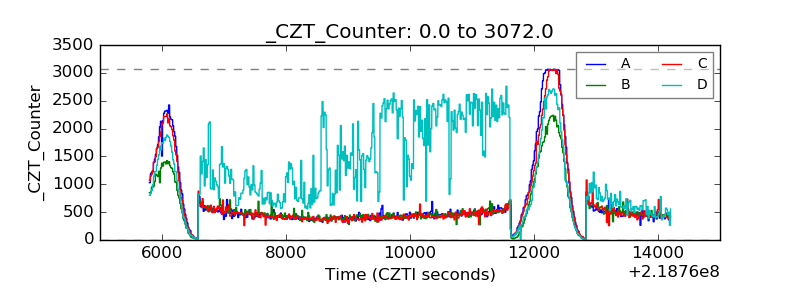 |
| +2.5 Volts monitor |  |
| +5 Volts monitor | 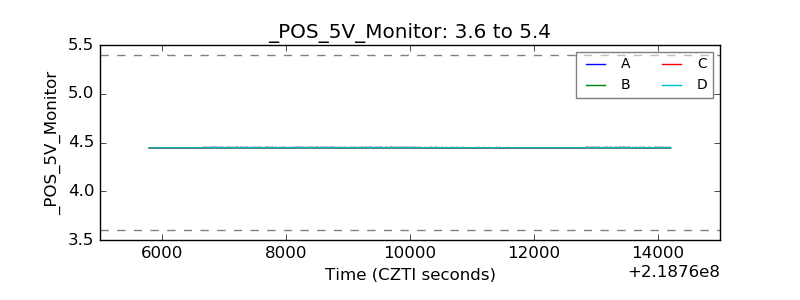 |
| _ROLL_ROT | 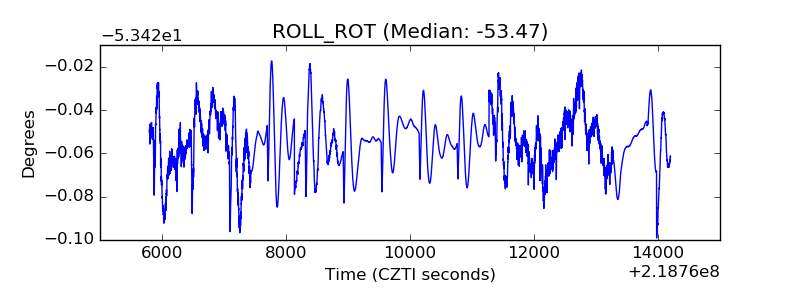 |
| _Roll_DEC | 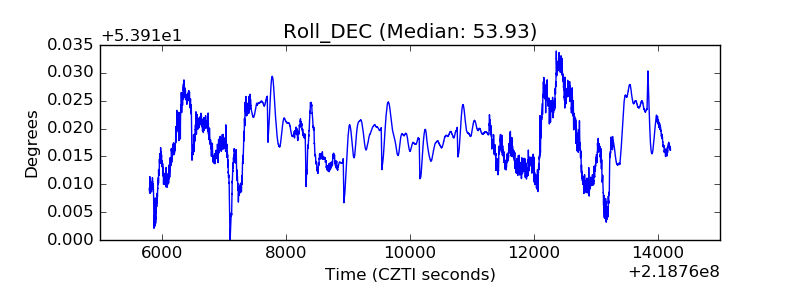 |
| _Roll_RA | 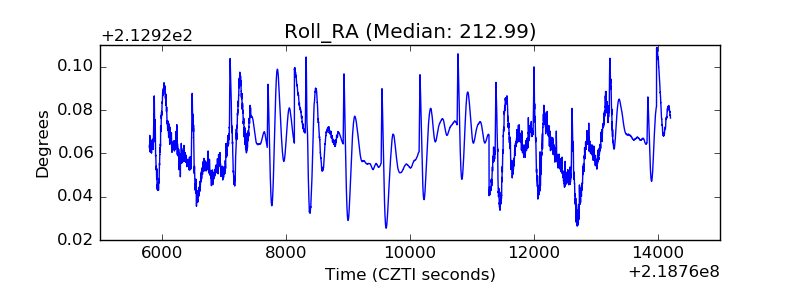 |
| Veto Counter | 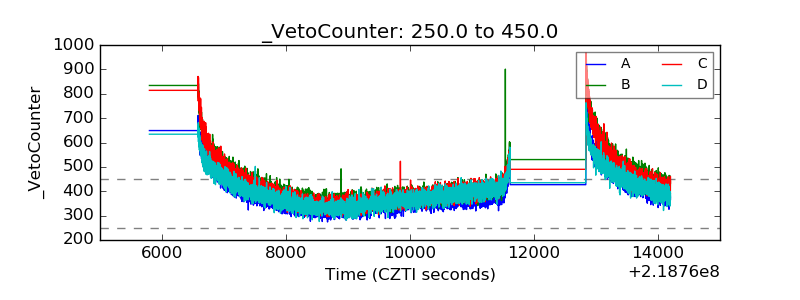 |