| Param | Original file | Final file |
|---|---|---|
| Filename | modeM0/AS1A02_191T01_9000000854_06456cztM0_level2.evt | modeM0/AS1A02_191T01_9000000854_06456cztM0_level2_quad_clean.evt |
| Size (bytes) | 392,391,360 | 84,700,800 |
| Size | 374.2 MB | 80.8 MB |
| Events in quadrant A | 2,940,764 | 545,334 |
| Events in quadrant B | 2,873,079 | 560,974 |
| Events in quadrant C | 2,726,328 | 529,672 |
| Events in quadrant D | 2,926,394 | 501,438 |
| Mode SS | |||
|---|---|---|---|
| Quadrant | BADHDUFLAG | Total packets | Discarded packets |
| A | 0 | 124 | 0 |
| B | 0 | 124 | 0 |
| C | 0 | 124 | 0 |
| D | 0 | 124 | 0 |
| Mode M0 | |||
|---|---|---|---|
| Quadrant | BADHDUFLAG | Total packets | Discarded packets |
| A | 0 | 12892 | 2 |
| B | 0 | 12597 | 1 |
| C | 0 | 12534 | 1 |
| D | 0 | 13048 | 1 |
| Mode M9 | |||
|---|---|---|---|
| Quadrant | BADHDUFLAG | Total packets | Discarded packets |
| A | 0 | 12 | 0 |
| B | 0 | 12 | 0 |
| C | 0 | 12 | 0 |
| D | 0 | 12 | 0 |
| Quadrant | Total seconds | Saturated seconds | Saturation percentage |
|---|---|---|---|
| A | 6126 | 125 | 2.040483% |
| B | 6126 | 67 | 1.093699% |
| C | 6126 | 17 | 0.277506% |
| D | 6126 | 67 | 1.093699% |
Noise dominated data is calculated using 1-second bins in cleaned event files. If a bin has >2000 counts, and if more than 50% of those come from <1% of pixels, then it is considered to be noise-dominated and hence unusable.
| Quadrant | # 1 sec bins | Bins with >0 counts | Bins with >2000 counts | High rate bins dominated by noise | Noise dominated (total time) | Noise dominated (detector-on time) | Marked lightcurve |
|---|---|---|---|---|---|---|---|
| A | 7346 | 6127 | 3 | 3 | 0.04% | 0.05% | 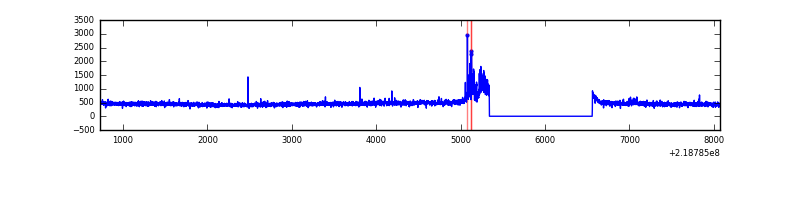 |
| B | 7346 | 6127 | 0 | 0 | 0.00% | 0.00% | 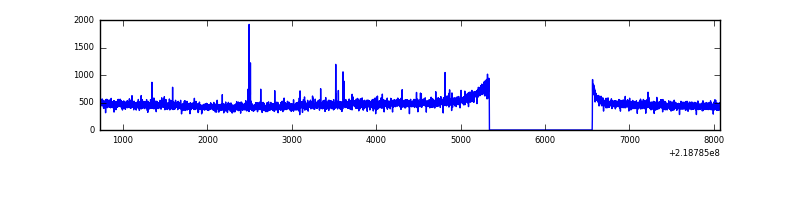 |
| C | 7346 | 6127 | 0 | 0 | 0.00% | 0.00% | 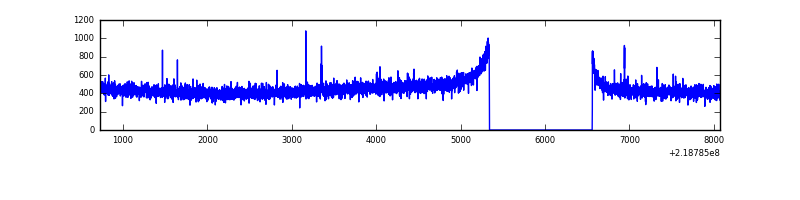 |
| D | 7346 | 6127 | 32 | 32 | 0.44% | 0.52% | 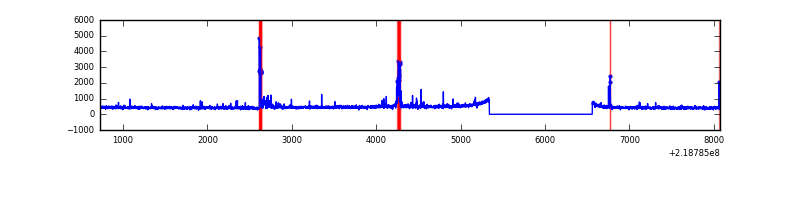 |
Top three noisy pixels from each quadrant. If the there are fewer than three noisy pixels in the level2.evt file, extra rows are filled as -1
| Pixel properties | Quadrant properties | ||||||
|---|---|---|---|---|---|---|---|
| Quadrant | DetID | PixID | Counts | Sigma | Mean | Median | Sigma |
| A | 15 | 239 | 114476 | 774.64 | 727 | 712 | 146.9 |
| A | 8 | 15 | 17325 | 113.12 | 727 | 712 | 146.9 |
| A | 15 | 236 | 8528 | 53.22 | 727 | 712 | 146.9 |
| B | 15 | 204 | 14616 | 100.55 | 732 | 715 | 138.3 |
| B | 12 | 111 | 14055 | 96.49 | 732 | 715 | 138.3 |
| B | 15 | 255 | 13638 | 93.47 | 732 | 715 | 138.3 |
| C | 1 | 16 | 8534 | 48.91 | 693 | 695 | 160.3 |
| C | 14 | 67 | 5724 | 31.38 | 693 | 695 | 160.3 |
| C | 13 | 61 | 5463 | 29.75 | 693 | 695 | 160.3 |
| D | 2 | 152 | 152304 | 897.59 | 691 | 668 | 168.9 |
| D | 2 | 63 | 51178 | 298.99 | 691 | 668 | 168.9 |
| D | 13 | 105 | 47968 | 279.99 | 691 | 668 | 168.9 |
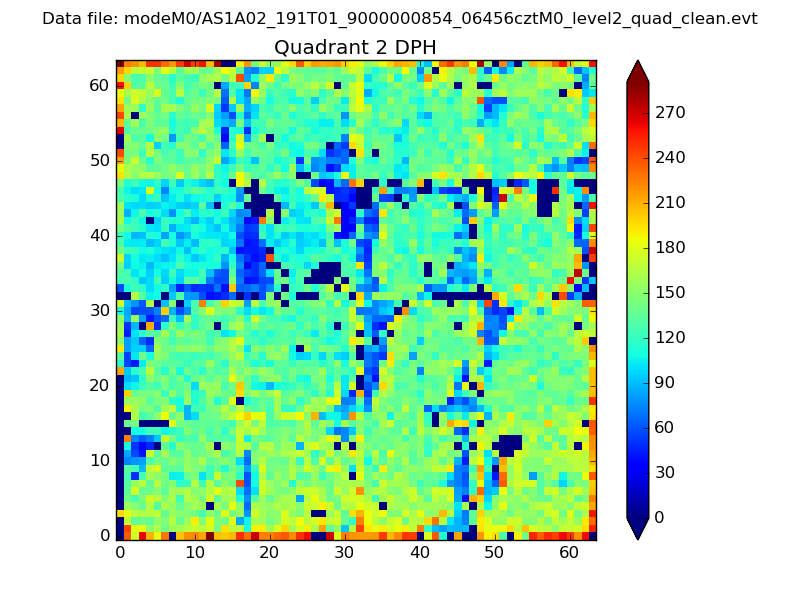
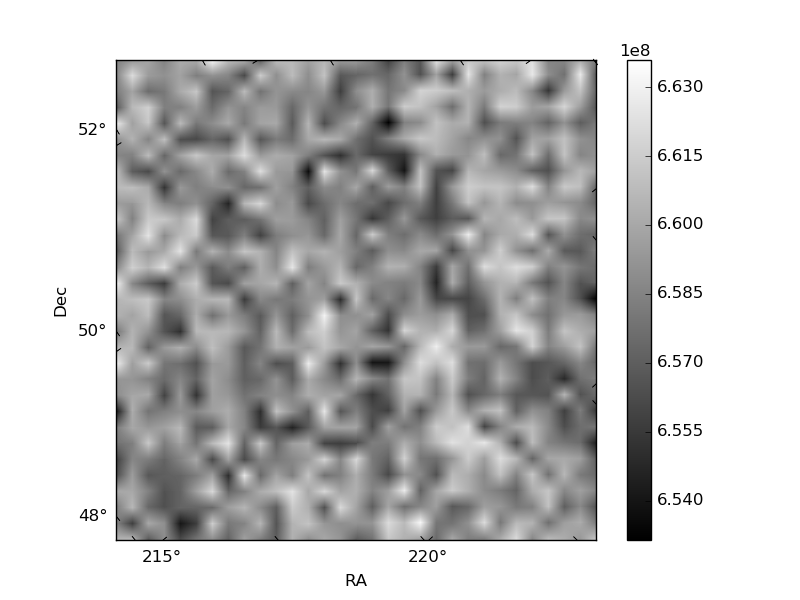
Histogram calculated using DETX and DETY for each event in the final _common_clean file
| Quadrant A | 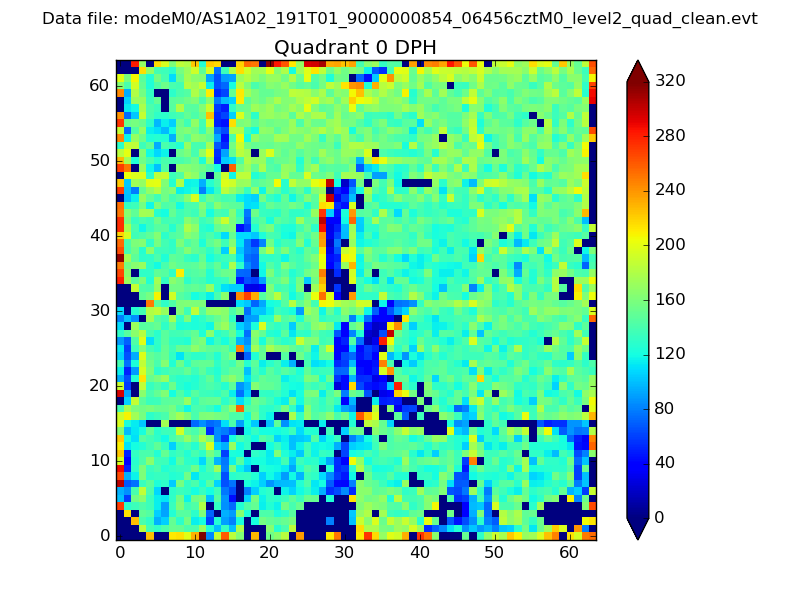 |
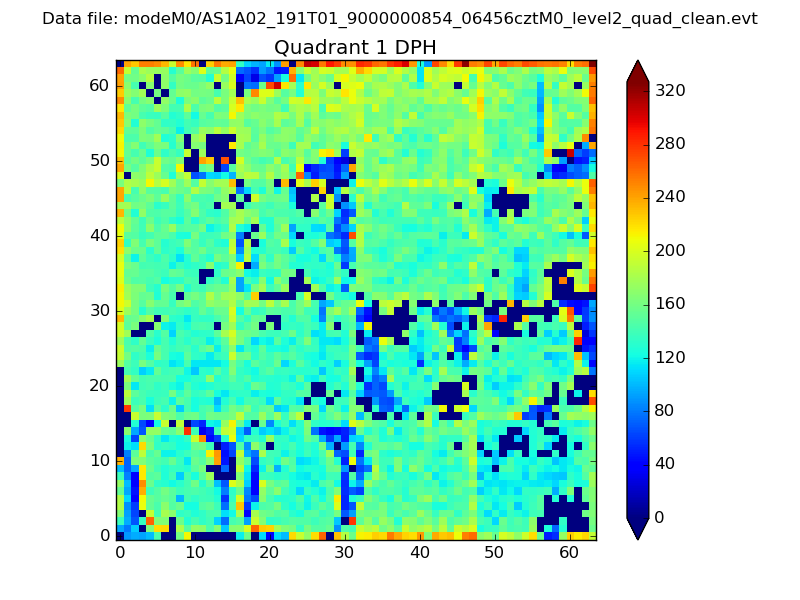 |
Quadrant B |
|---|---|---|---|
| Quadrant D | 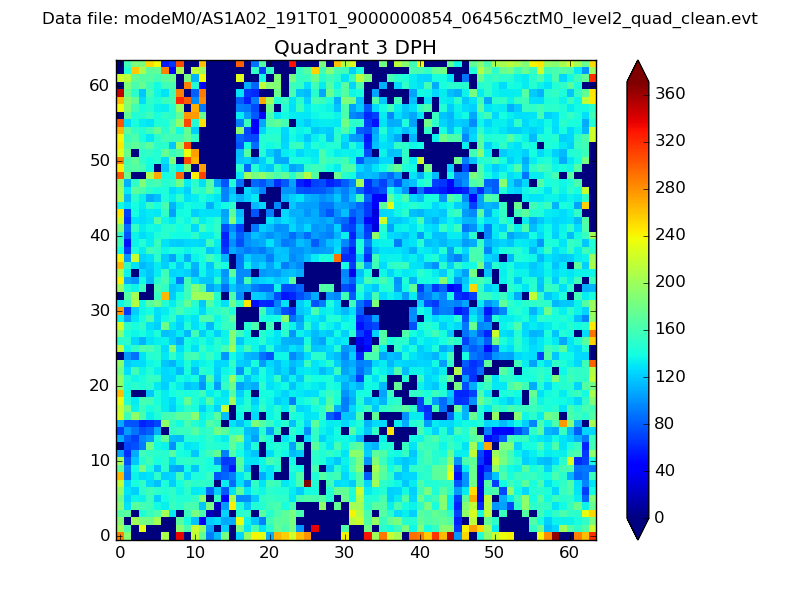 |
 |
Quadrant C |
| Plot type | Count rate plots | Images |
|---|---|---|
| Comparison with Poisson distribution Blue bars denote a histogram of data divided into 1 sec bins. Red curve is a Poisson curve with rate = median count rate of data. |
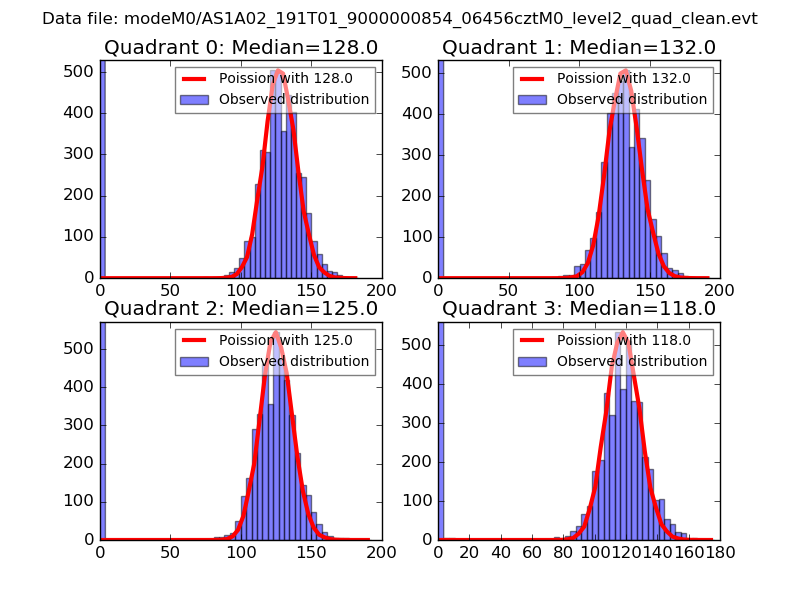 |
 |
| Quadrant-wise count rates Data is divided into 100 sec bins |
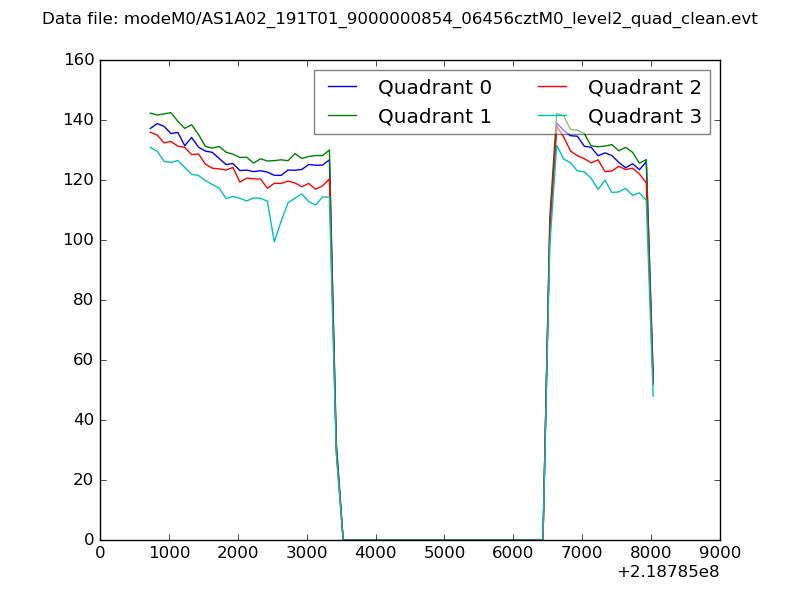 |
|
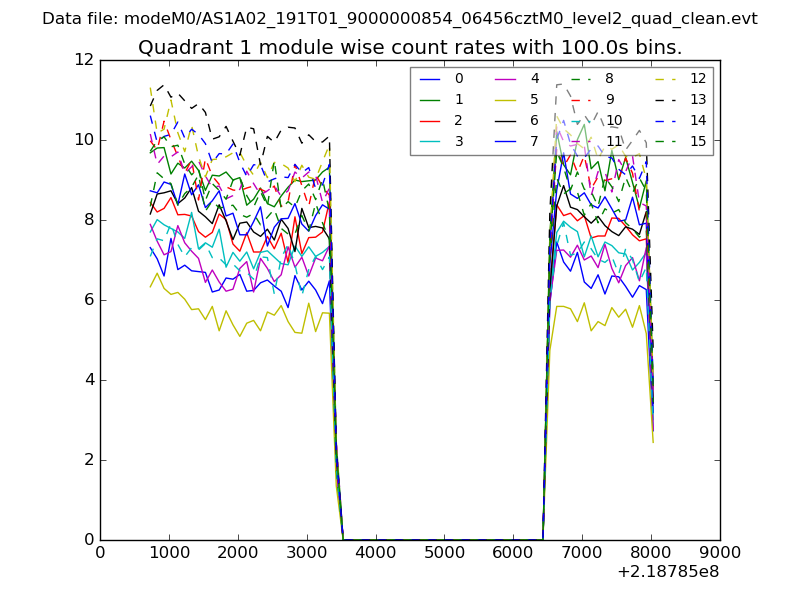
| Module-wise count rates for Quadrant A Data is divided into 100 sec bins |
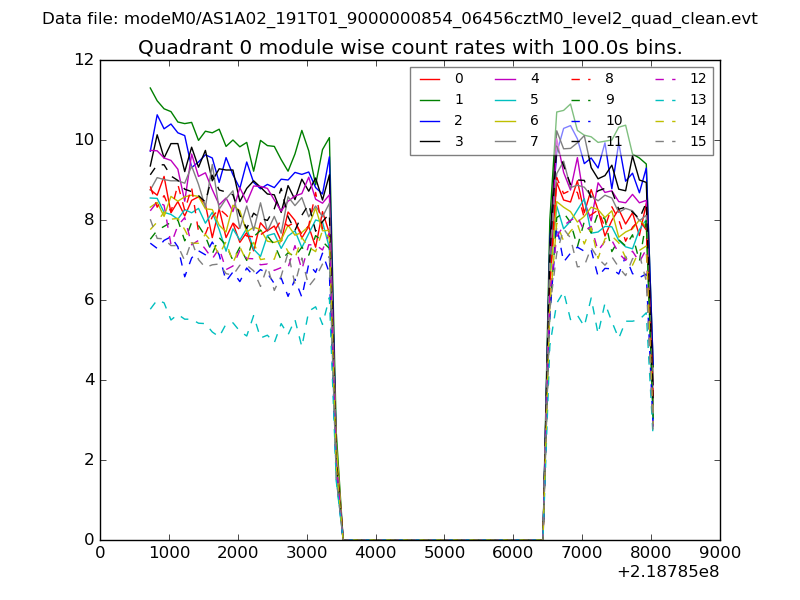 |
 |
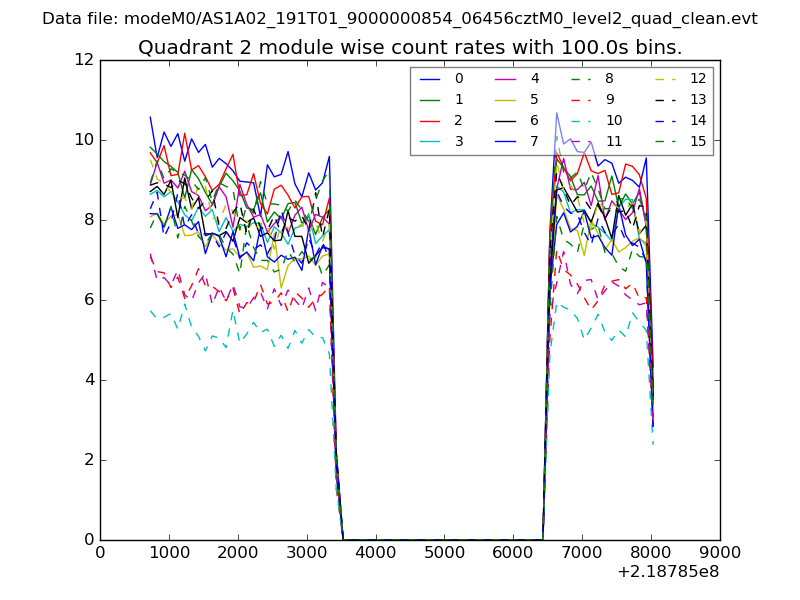
| Module-wise count rates for Quadrant B Data is divided into 100 sec bins |
 |
 |
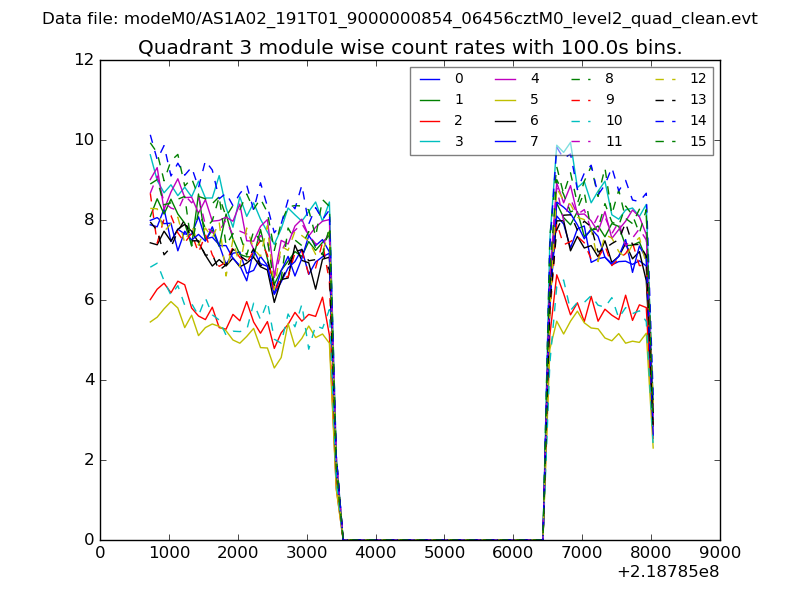
| Module-wise count rates for Quadrant C Data is divided into 100 sec bins |
 |
 |
| Module-wise count rates for Quadrant D Data is divided into 100 sec bins |
 |
 |
| Parameter | Plot |
|---|---|
| CZT HV Monitor | 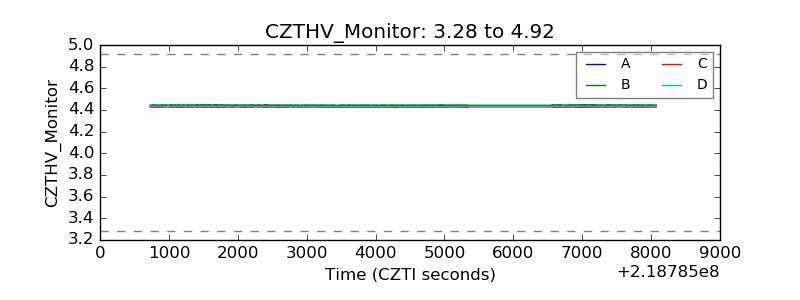 |
| D_VDD | 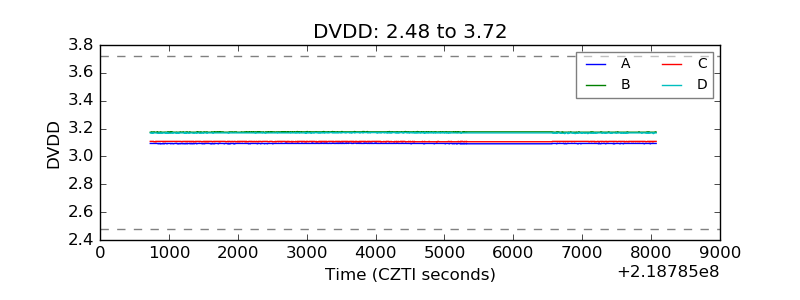 |
| Temperature 1 | 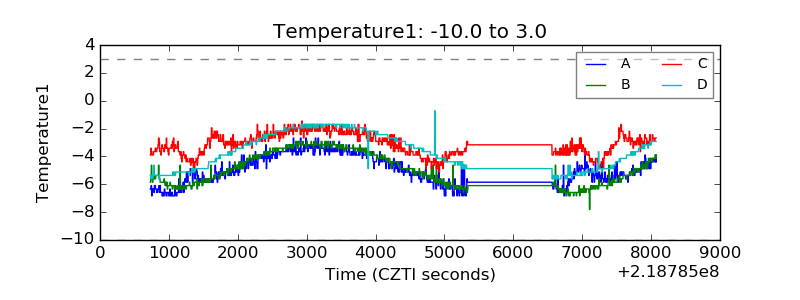 |
| Veto HV Monitor | 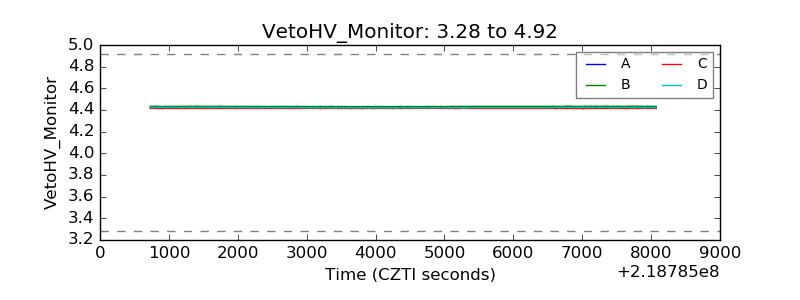 |
| Veto LLD | 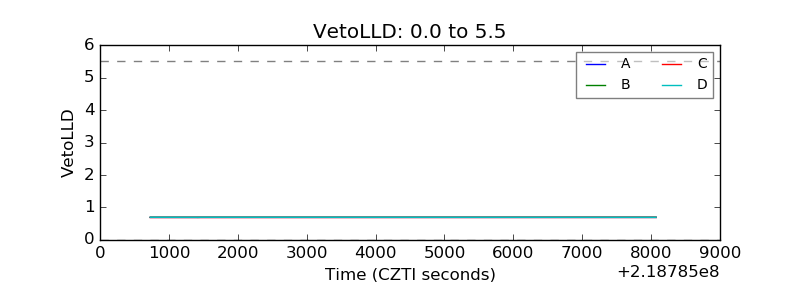 |
| Alpha Counter | 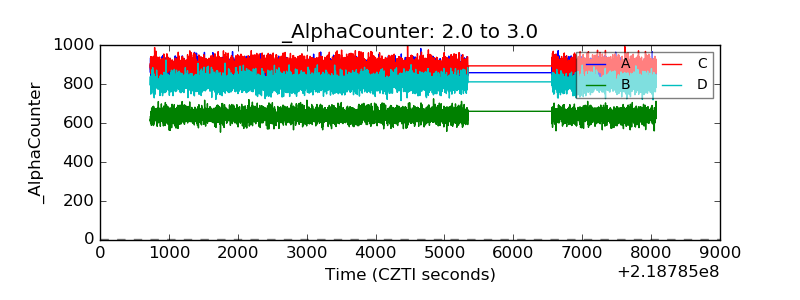 |
| _CPM_Rate | 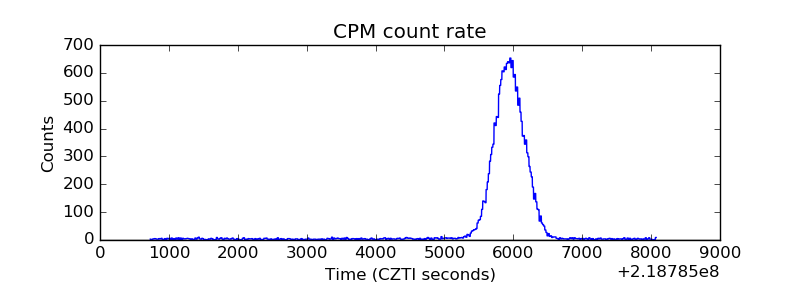 |
| CZT Counter | 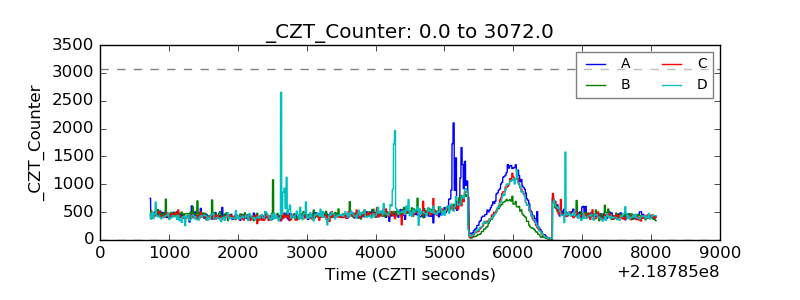 |
| +2.5 Volts monitor |  |
| +5 Volts monitor | 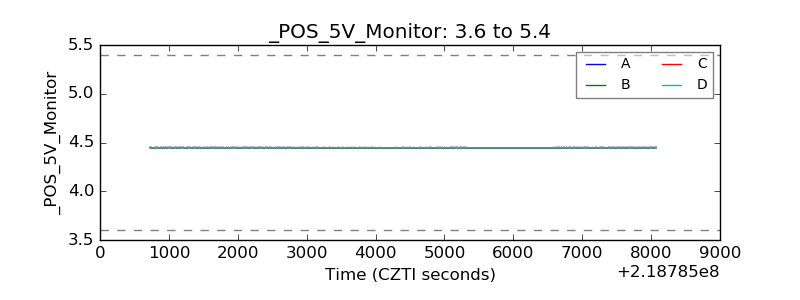 |
| _ROLL_ROT | 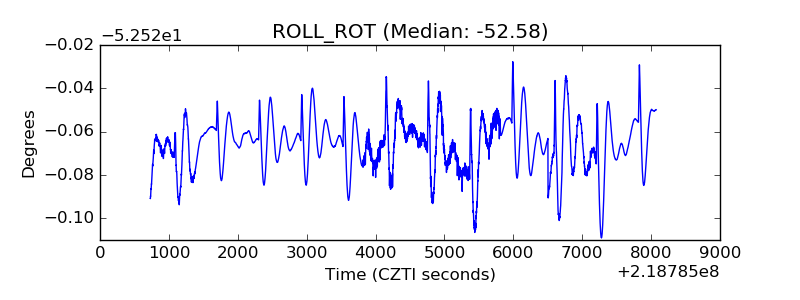 |
| _Roll_DEC | 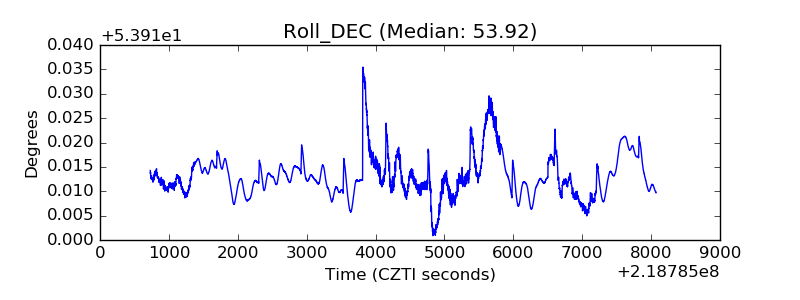 |
| _Roll_RA | 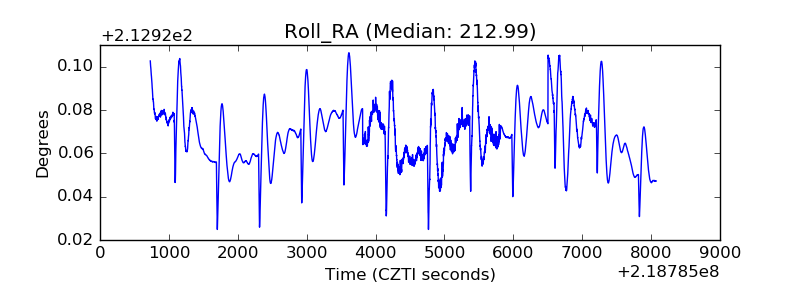 |
| Veto Counter | 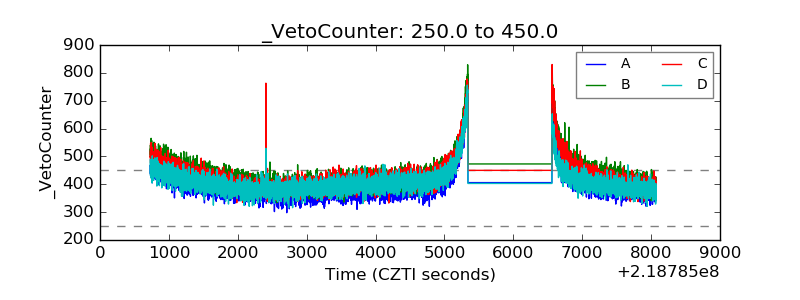 |