| Param | Original file | Final file |
|---|---|---|
| Filename | modeM0/AS1A02_191T01_9000000854_06458cztM0_level2.evt | modeM0/AS1A02_191T01_9000000854_06458cztM0_level2_quad_clean.evt |
| Size (bytes) | 438,696,000 | 97,536,960 |
| Size | 418.4 MB | 93.0 MB |
| Events in quadrant A | 3,208,232 | 621,132 |
| Events in quadrant B | 3,283,204 | 639,189 |
| Events in quadrant C | 3,099,369 | 615,073 |
| Events in quadrant D | 3,214,022 | 585,904 |
| Mode SS | |||
|---|---|---|---|
| Quadrant | BADHDUFLAG | Total packets | Discarded packets |
| A | 0 | 144 | 0 |
| B | 0 | 144 | 0 |
| C | 0 | 144 | 0 |
| D | 0 | 144 | 0 |
| Mode M0 | |||
|---|---|---|---|
| Quadrant | BADHDUFLAG | Total packets | Discarded packets |
| A | 0 | 14429 | 2 |
| B | 0 | 14588 | 1 |
| C | 0 | 14412 | 1 |
| D | 0 | 14560 | 1 |
| Mode M9 | |||
|---|---|---|---|
| Quadrant | BADHDUFLAG | Total packets | Discarded packets |
| A | 0 | 6 | 0 |
| B | 0 | 6 | 0 |
| C | 0 | 6 | 0 |
| D | 0 | 6 | 0 |
| Quadrant | Total seconds | Saturated seconds | Saturation percentage |
|---|---|---|---|
| A | 7070 | 87 | 1.230552% |
| B | 7070 | 81 | 1.145686% |
| C | 7070 | 65 | 0.919378% |
| D | 7070 | 75 | 1.060820% |
Noise dominated data is calculated using 1-second bins in cleaned event files. If a bin has >2000 counts, and if more than 50% of those come from <1% of pixels, then it is considered to be noise-dominated and hence unusable.
| Quadrant | # 1 sec bins | Bins with >0 counts | Bins with >2000 counts | High rate bins dominated by noise | Noise dominated (total time) | Noise dominated (detector-on time) | Marked lightcurve |
|---|---|---|---|---|---|---|---|
| A | 7670 | 7071 | 0 | 0 | 0.00% | 0.00% | 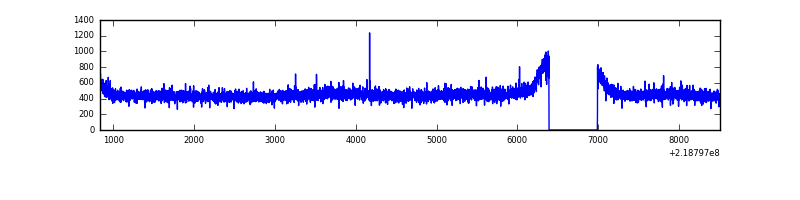 |
| B | 7670 | 7071 | 3 | 3 | 0.04% | 0.04% | 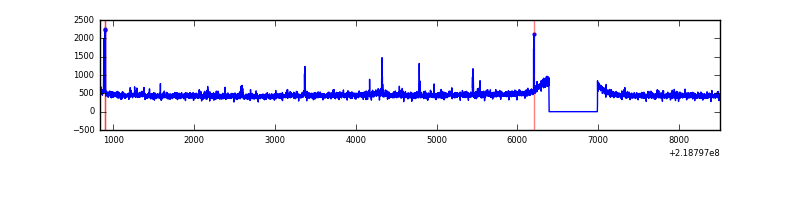 |
| C | 7670 | 7071 | 0 | 0 | 0.00% | 0.00% | 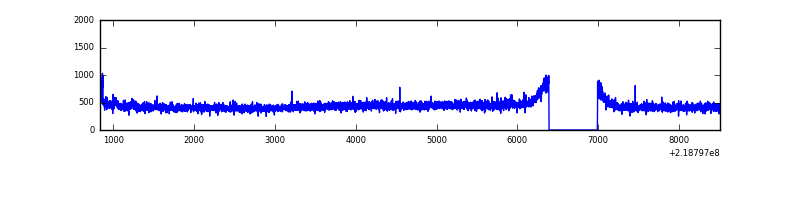 |
| D | 7670 | 7071 | 0 | 0 | 0.00% | 0.00% | 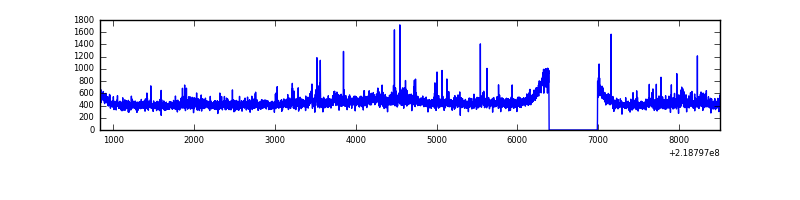 |
Top three noisy pixels from each quadrant. If the there are fewer than three noisy pixels in the level2.evt file, extra rows are filled as -1
| Pixel properties | Quadrant properties | ||||||
|---|---|---|---|---|---|---|---|
| Quadrant | DetID | PixID | Counts | Sigma | Mean | Median | Sigma |
| A | 13 | 14 | 29033 | 168.29 | 819 | 801 | 167.8 |
| A | 8 | 15 | 11459 | 63.53 | 819 | 801 | 167.8 |
| A | 10 | 133 | 9618 | 52.56 | 819 | 801 | 167.8 |
| B | 0 | 229 | 44862 | 277.82 | 822 | 804 | 158.6 |
| B | 4 | 81 | 22454 | 136.52 | 822 | 804 | 158.6 |
| B | 0 | 228 | 17297 | 104.0 | 822 | 804 | 158.6 |
| C | 1 | 16 | 20698 | 109.3 | 785 | 784 | 182.2 |
| C | 10 | 170 | 9429 | 47.45 | 785 | 784 | 182.2 |
| C | 13 | 61 | 6324 | 30.41 | 785 | 784 | 182.2 |
| D | 2 | 152 | 57818 | 293.18 | 788 | 761 | 194.6 |
| D | 8 | 195 | 54636 | 276.83 | 788 | 761 | 194.6 |
| D | 5 | 97 | 25063 | 124.87 | 788 | 761 | 194.6 |
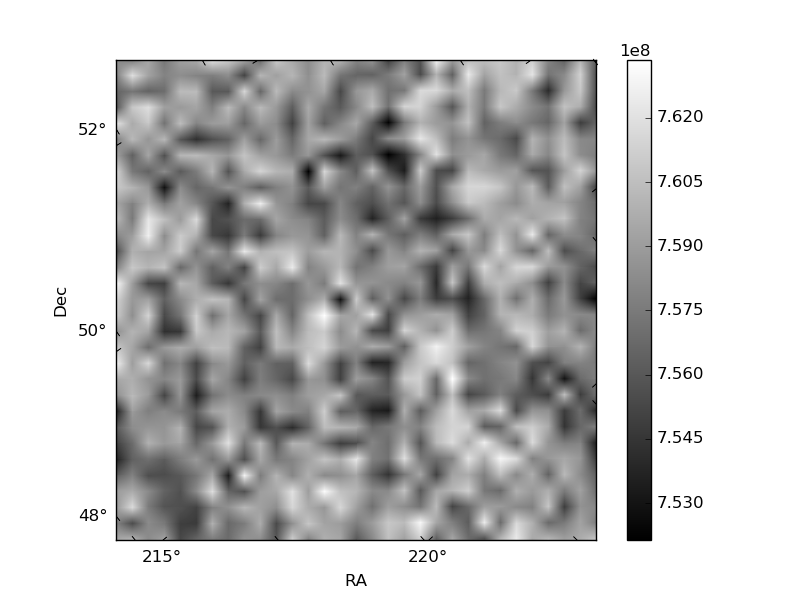
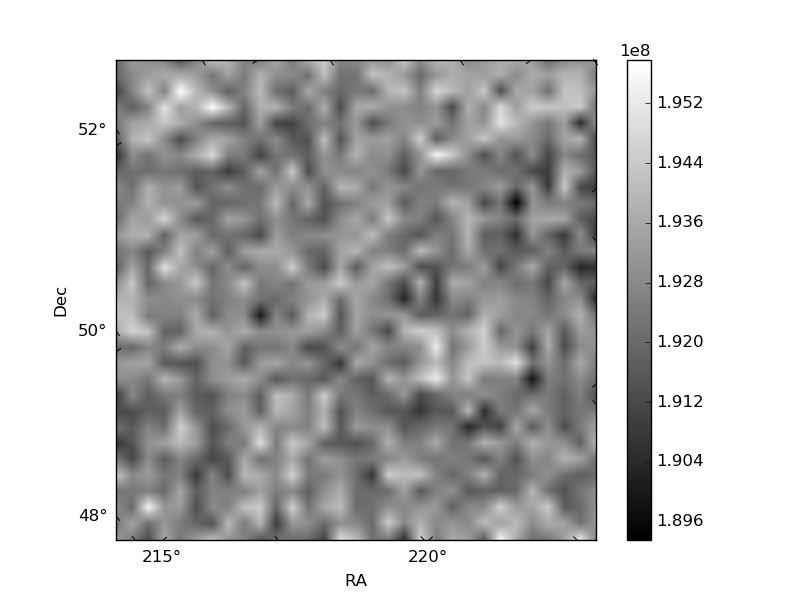
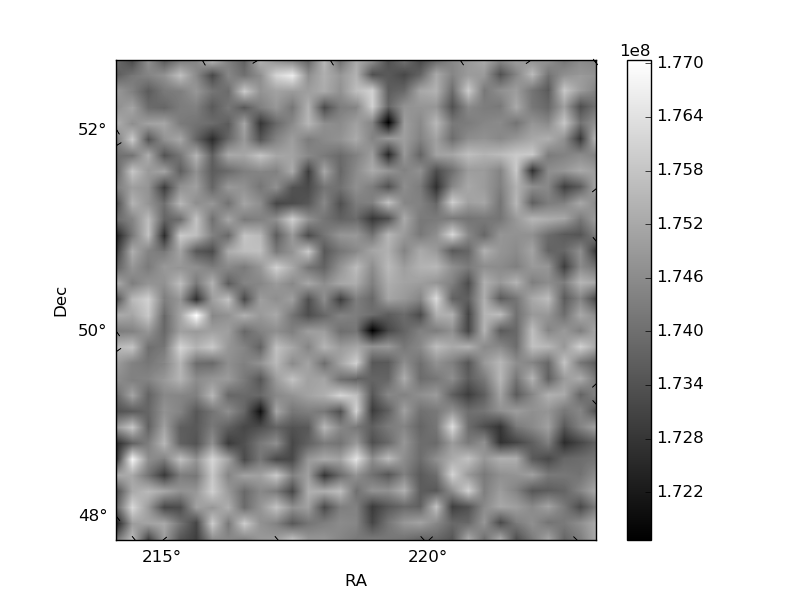
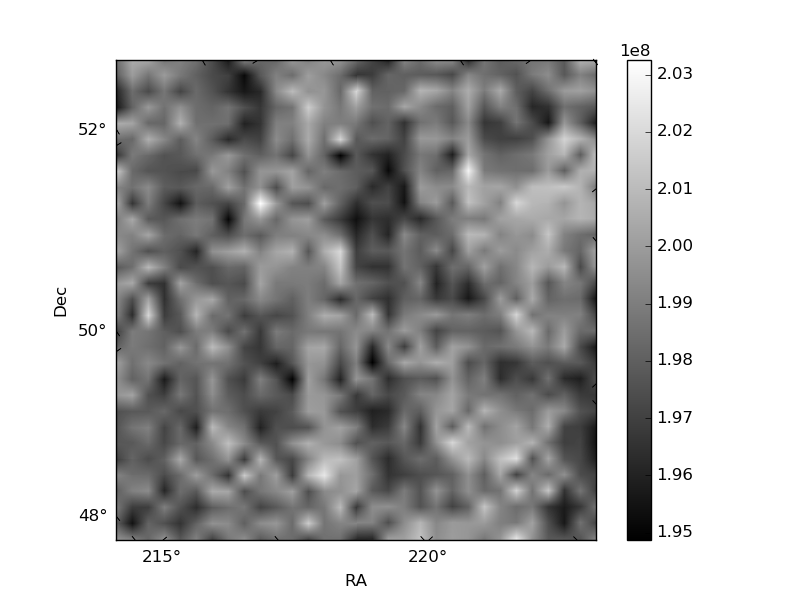
Histogram calculated using DETX and DETY for each event in the final _common_clean file
| Quadrant A | 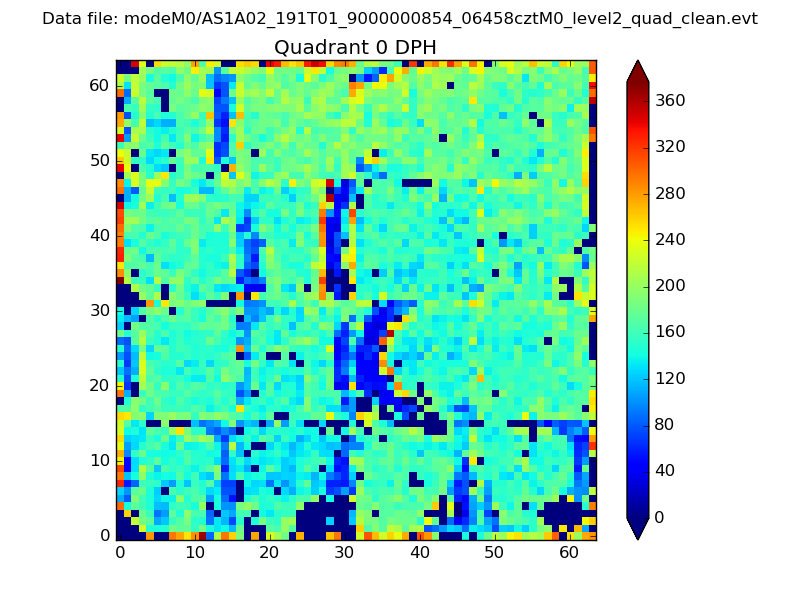 |
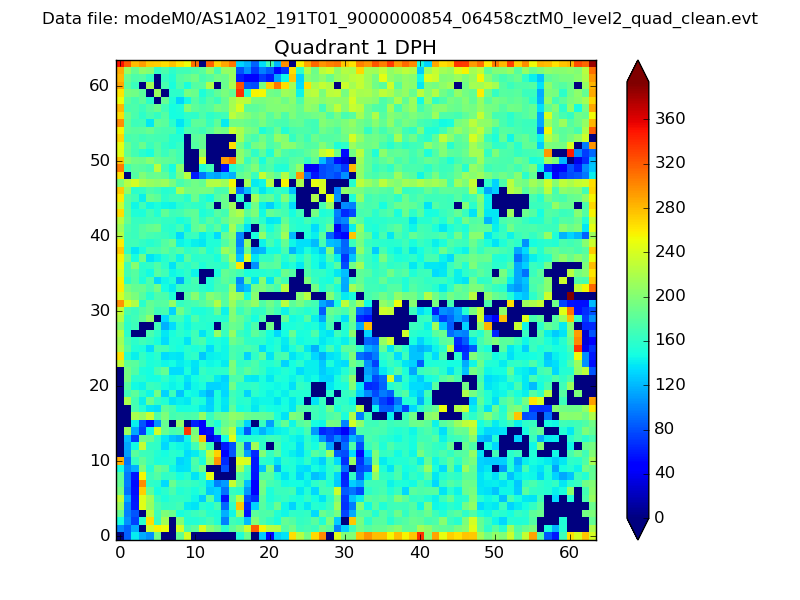 |
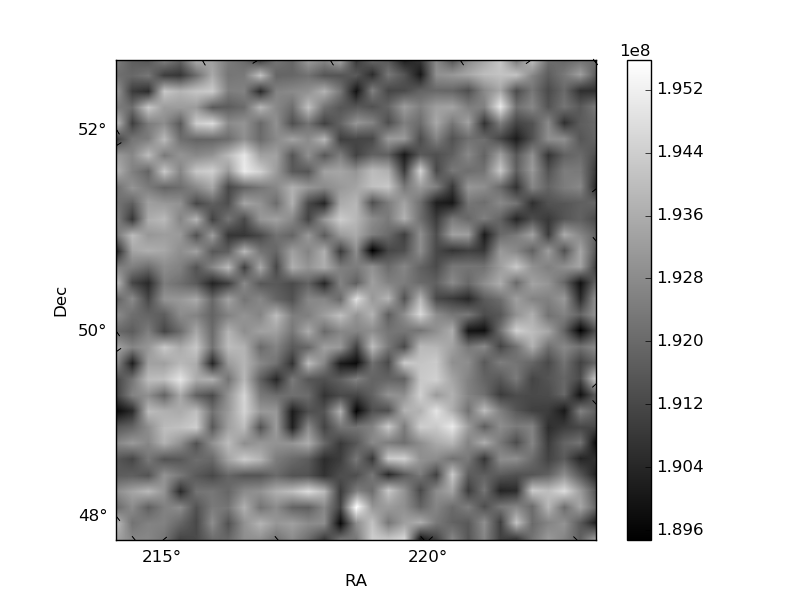
Quadrant B |
|---|---|---|---|
| Quadrant D | 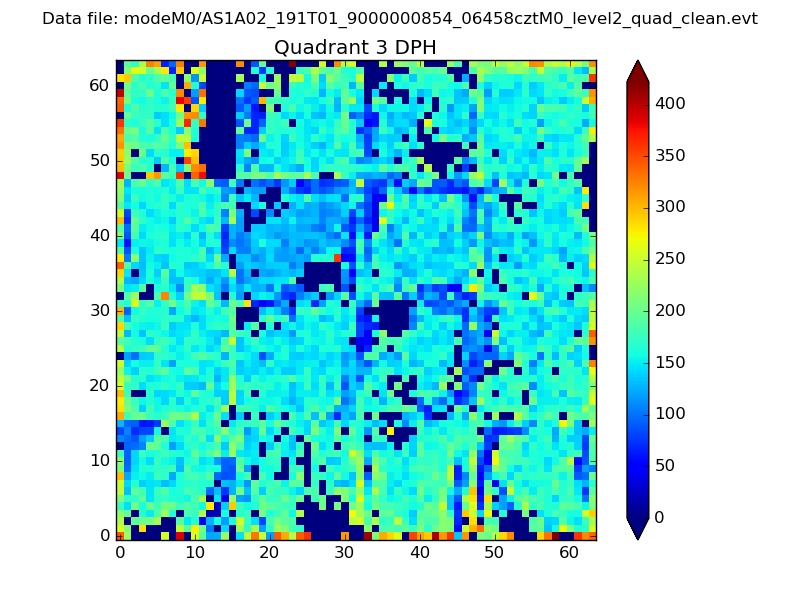 |
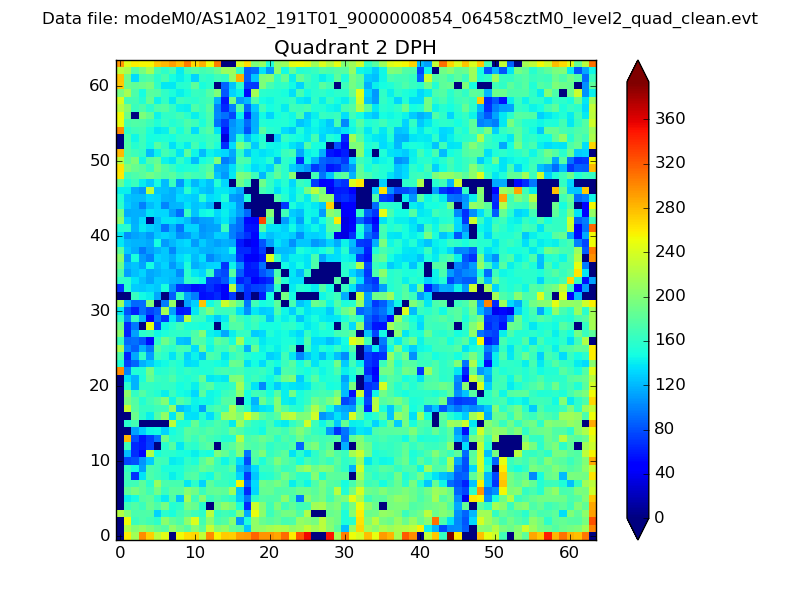 |
Quadrant C |
| Plot type | Count rate plots | Images |
|---|---|---|
| Comparison with Poisson distribution Blue bars denote a histogram of data divided into 1 sec bins. Red curve is a Poisson curve with rate = median count rate of data. |
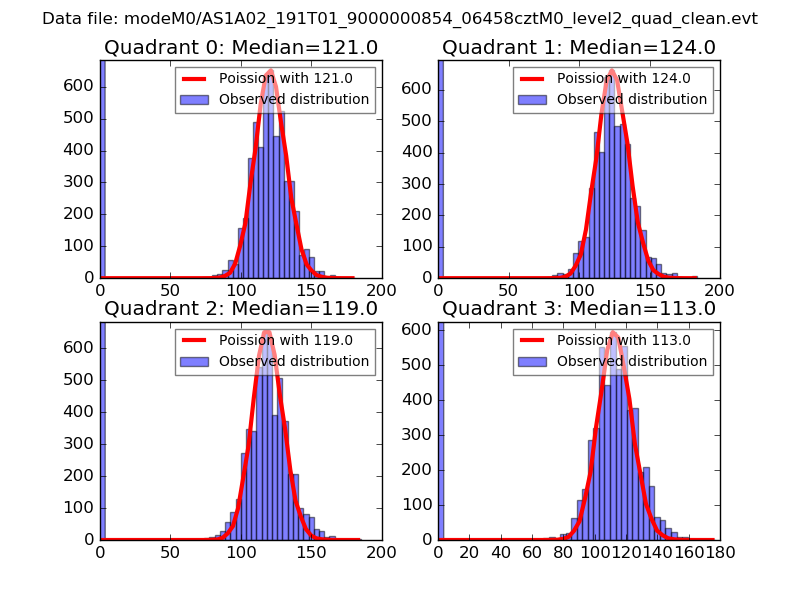 |
 |
| Quadrant-wise count rates Data is divided into 100 sec bins |
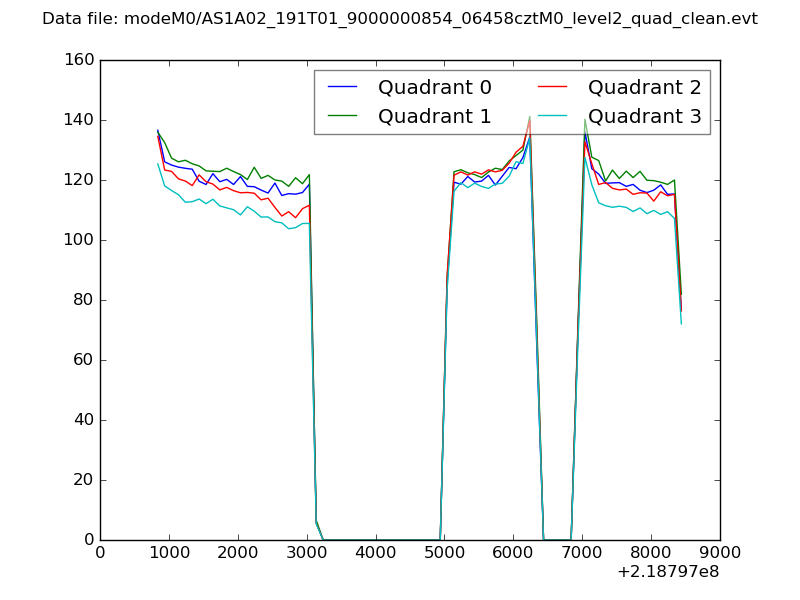 |
|
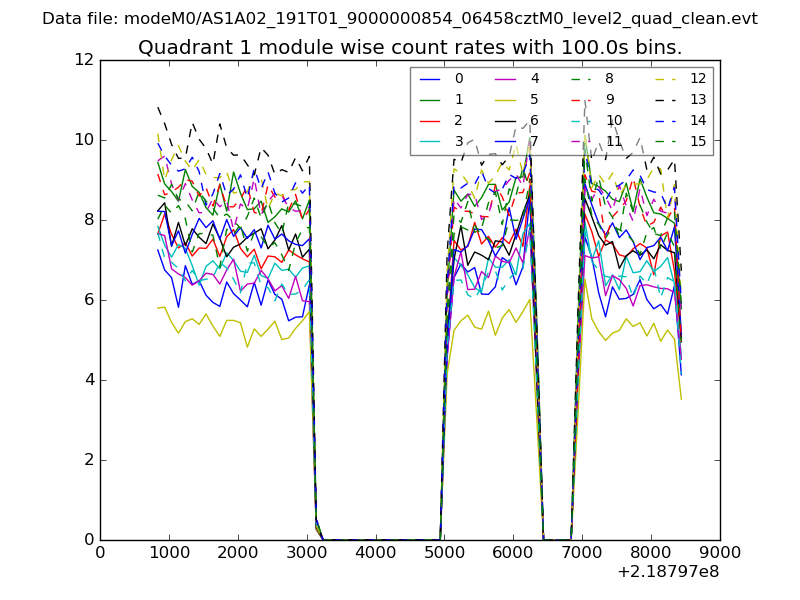
| Module-wise count rates for Quadrant A Data is divided into 100 sec bins |
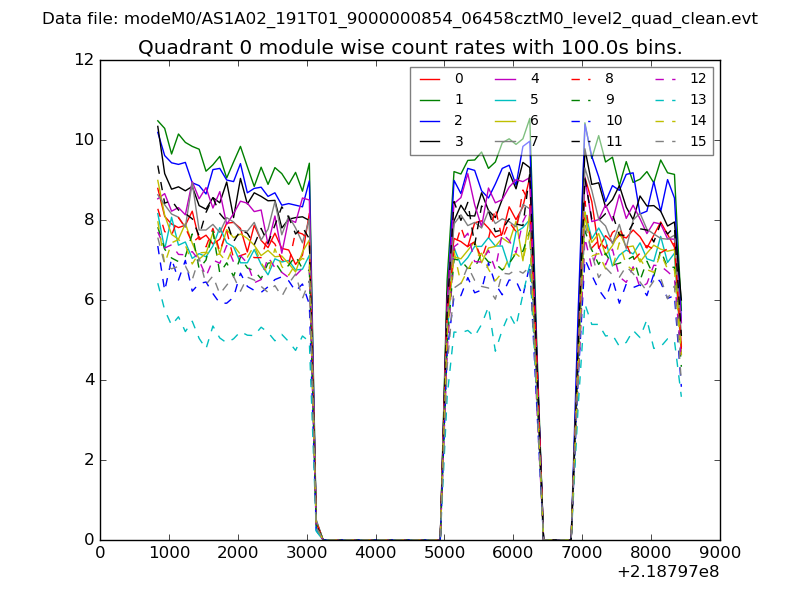 |
 |
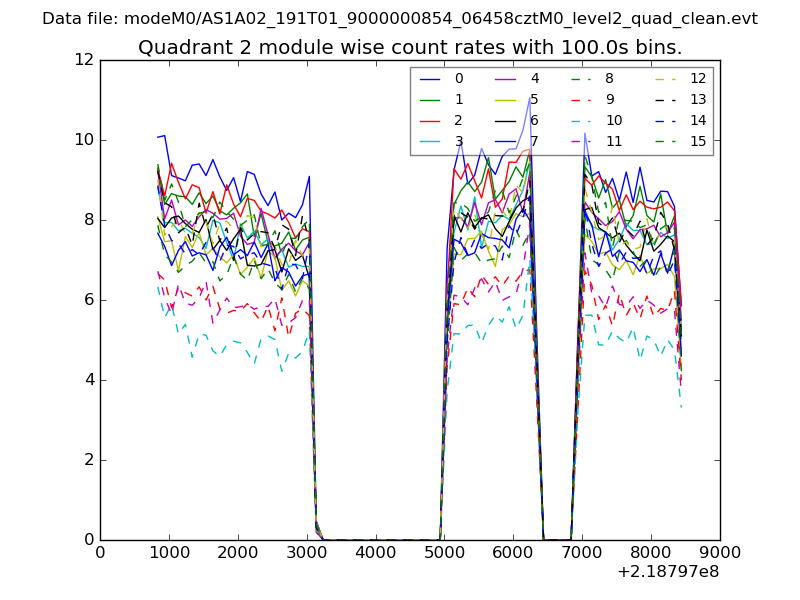
| Module-wise count rates for Quadrant B Data is divided into 100 sec bins |
 |
 |
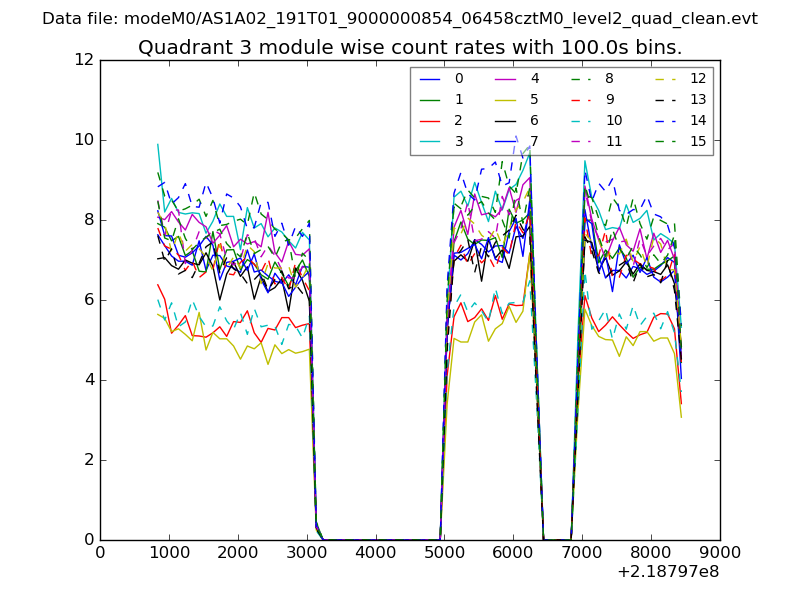
| Module-wise count rates for Quadrant C Data is divided into 100 sec bins |
 |
 |
| Module-wise count rates for Quadrant D Data is divided into 100 sec bins |
 |
 |
| Parameter | Plot |
|---|---|
| CZT HV Monitor | 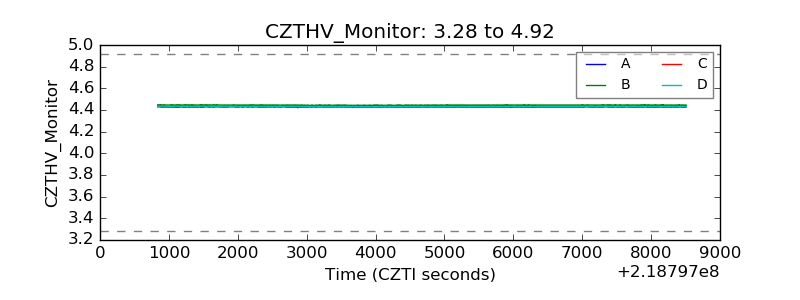 |
| D_VDD | 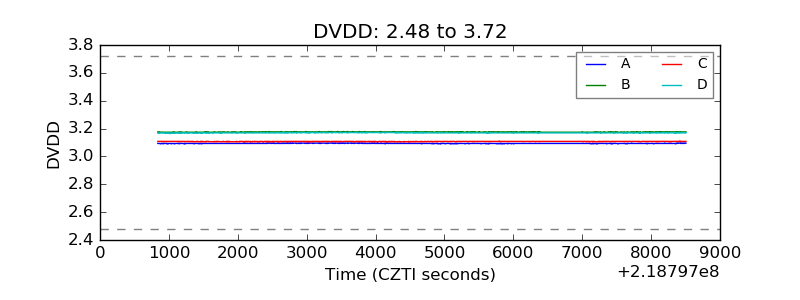 |
| Temperature 1 | 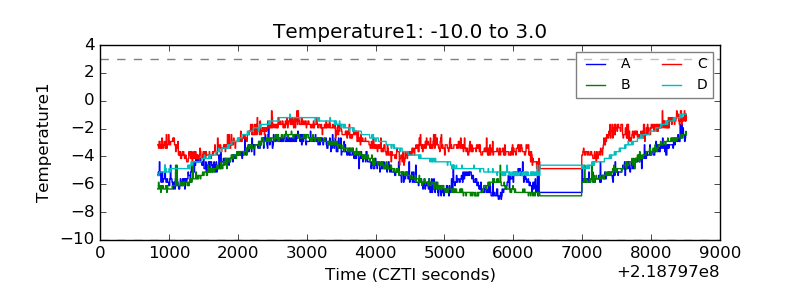 |
| Veto HV Monitor | 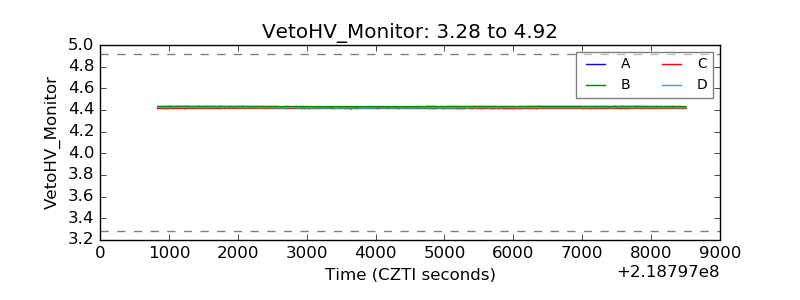 |
| Veto LLD | 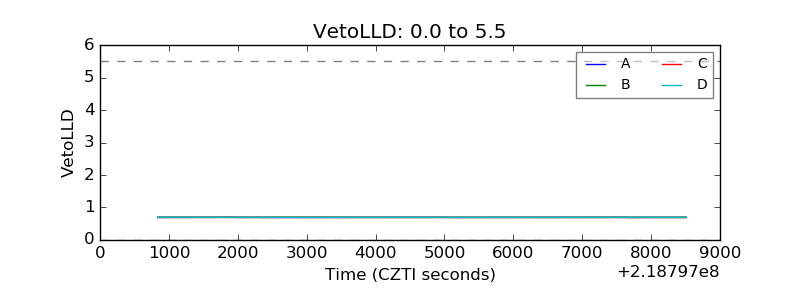 |
| Alpha Counter | 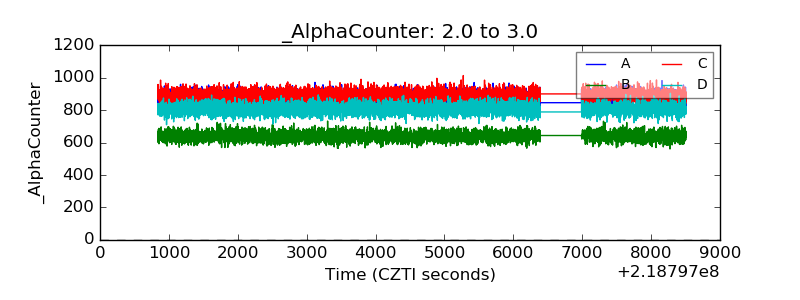 |
| _CPM_Rate | 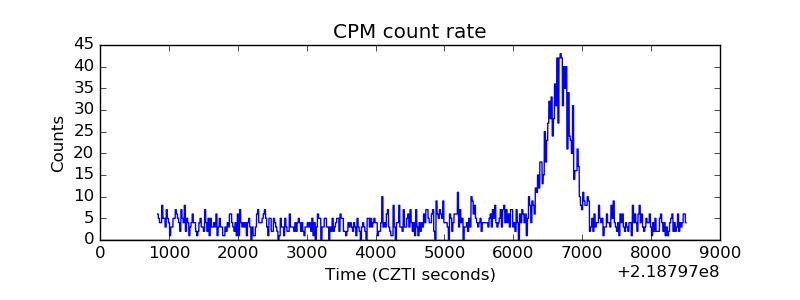 |
| CZT Counter | 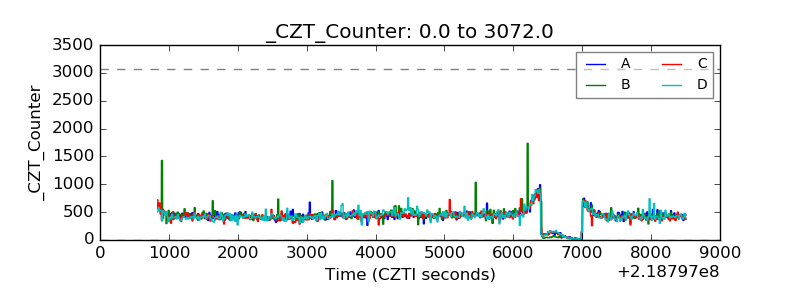 |
| +2.5 Volts monitor |  |
| +5 Volts monitor |  |
| _ROLL_ROT | 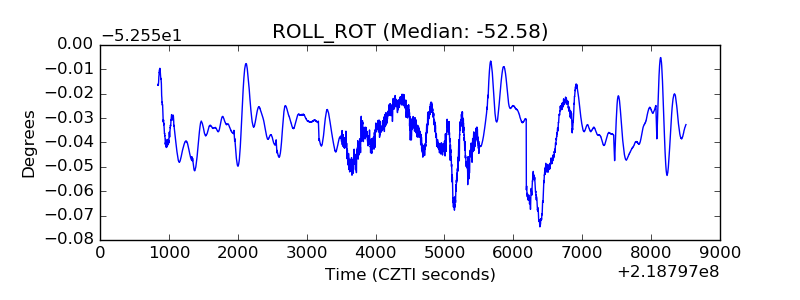 |
| _Roll_DEC | 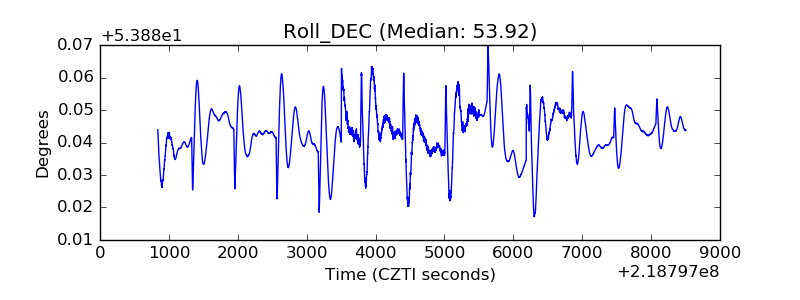 |
| _Roll_RA | 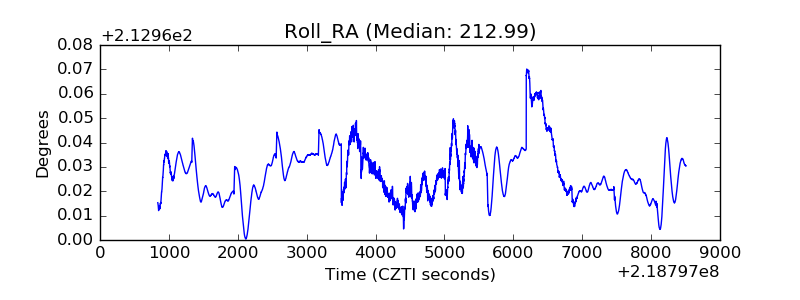 |
| Veto Counter | 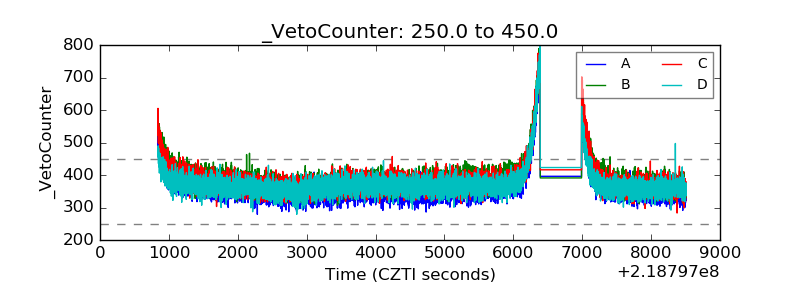 |