| Param | Original file | Final file |
|---|---|---|
| Filename | modeM0/AS1C02_010T01_9000000860cztM0_level2.fits | modeM0/AS1C02_010T01_9000000860cztM0_level2_quad_clean.evt |
| Size (bytes) | 61,865,280 | 39,738,240 |
| Size | 59.0 MB | 37.9 MB |
| Events in quadrant A | 364,886 | 186,886 |
| Events in quadrant B | 353,716 | 186,069 |
| Events in quadrant C | 361,680 | 178,837 |
| Events in quadrant D | 309,830 | 166,522 |
| Mode SS | |||
|---|---|---|---|
| Quadrant | BADHDUFLAG | Total packets | Discarded packets |
| A | 0 | 140 | 0 |
| B | 0 | 140 | 0 |
| C | 0 | 140 | 0 |
| D | 0 | 140 | 0 |
| Mode M0 | |||
|---|---|---|---|
| Quadrant | BADHDUFLAG | Total packets | Discarded packets |
| A | 0 | 14649 | 0 |
| B | 0 | 14354 | 0 |
| C | 0 | 14033 | 0 |
| D | 0 | 16091 | 0 |
| Mode M9 | |||
|---|---|---|---|
| Quadrant | BADHDUFLAG | Total packets | Discarded packets |
| A | 0 | 8 | 0 |
| B | 0 | 8 | 0 |
| C | 0 | 8 | 0 |
| D | 0 | 8 | 0 |
| Quadrant | Total seconds | Saturated seconds | Saturation percentage |
|---|---|---|---|
| A | 6947 | 23 | 0.331078% |
| B | 6947 | 36 | 0.518209% |
| C | 6947 | 22 | 0.316683% |
| D | 6947 | 107 | 1.540233% |
Noise dominated data is calculated using 1-second bins in cleaned event files. If a bin has >2000 counts, and if more than 50% of those come from <1% of pixels, then it is considered to be noise-dominated and hence unusable.
| Quadrant | # 1 sec bins | Bins with >0 counts | Bins with >2000 counts | High rate bins dominated by noise | Noise dominated (total time) | Noise dominated (detector-on time) | Marked lightcurve |
|---|---|---|---|---|---|---|---|
| A | 7687 | 6947 | 0 | 0 | 0.00% | 0.00% |  |
| B | 7687 | 6947 | 0 | 0 | 0.00% | 0.00% |  |
| C | 7687 | 6947 | 0 | 0 | 0.00% | 0.00% |  |
| D | 7687 | 6946 | 0 | 0 | 0.00% | 0.00% |  |
Top three noisy pixels from each quadrant. If the there are fewer than three noisy pixels in the level2.evt file, extra rows are filled as -1
| Pixel properties | Quadrant properties | ||||||
|---|---|---|---|---|---|---|---|
| Quadrant | DetID | PixID | Counts | Sigma | Mean | Median | Sigma |
| A | 0 | 29 | 379 | 11.09 | 94 | 88 | 26.2 |
| A | 14 | 188 | 356 | 10.21 | 94 | 88 | 26.2 |
| A | 14 | 204 | 316 | 8.69 | 94 | 88 | 26.2 |
| B | 2 | 9 | 296 | 9.72 | 93 | 88 | 21.4 |
| B | 12 | 226 | 261 | 8.08 | 93 | 88 | 21.4 |
| B | 5 | 128 | 255 | 7.8 | 93 | 88 | 21.4 |
| C | 1 | 80 | 283 | 7.27 | 95 | 88 | 26.8 |
| C | 12 | 241 | 263 | 6.52 | 95 | 88 | 26.8 |
| C | 1 | 81 | 261 | 6.45 | 95 | 88 | 26.8 |
| D | 3 | 14 | 248 | 6.74 | 88 | 79 | 25.1 |
| D | 11 | 82 | 241 | 6.46 | 88 | 79 | 25.1 |
| D | 7 | 5 | 240 | 6.42 | 88 | 79 | 25.1 |
Histogram calculated using DETX and DETY for each event in the final _common_clean file
| Quadrant A | 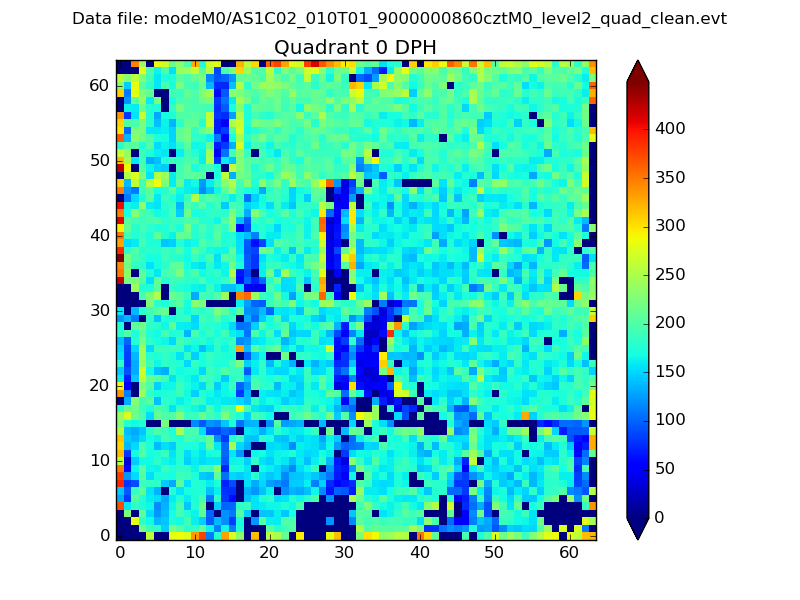 |
 |
Quadrant B |
|---|---|---|---|
| Quadrant D | 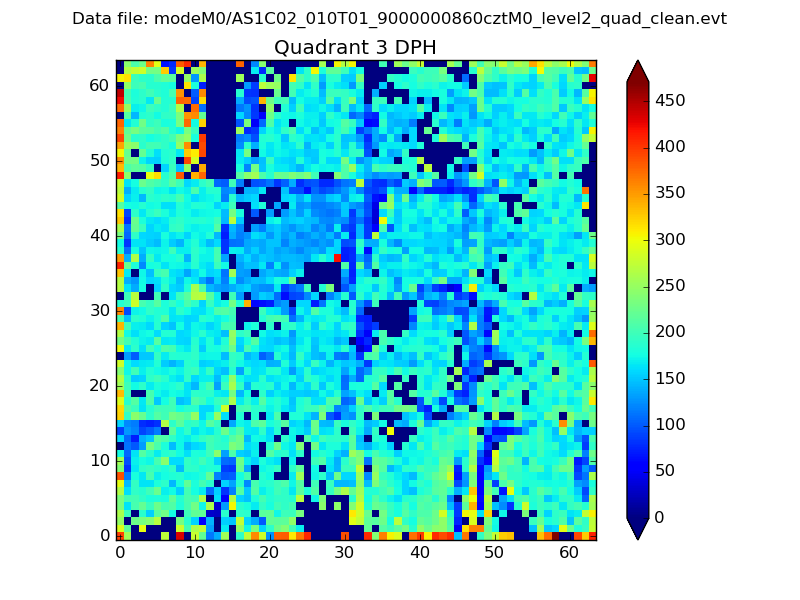 |
 |
Quadrant C |
| Plot type | Count rate plots | Images |
|---|---|---|
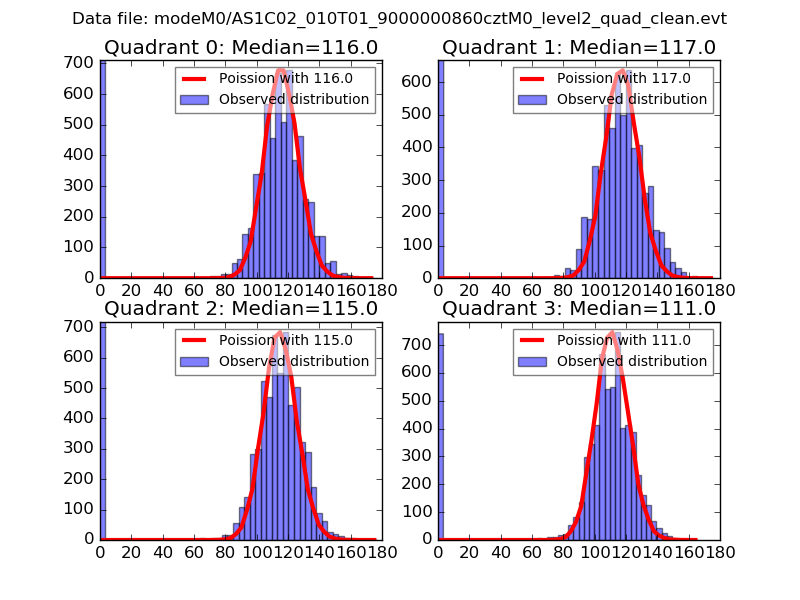
| Comparison with Poisson distribution Blue bars denote a histogram of data divided into 1 sec bins. Red curve is a Poisson curve with rate = median count rate of data. |
 |
 |
| Quadrant-wise count rates Data is divided into 100 sec bins |
 |
|
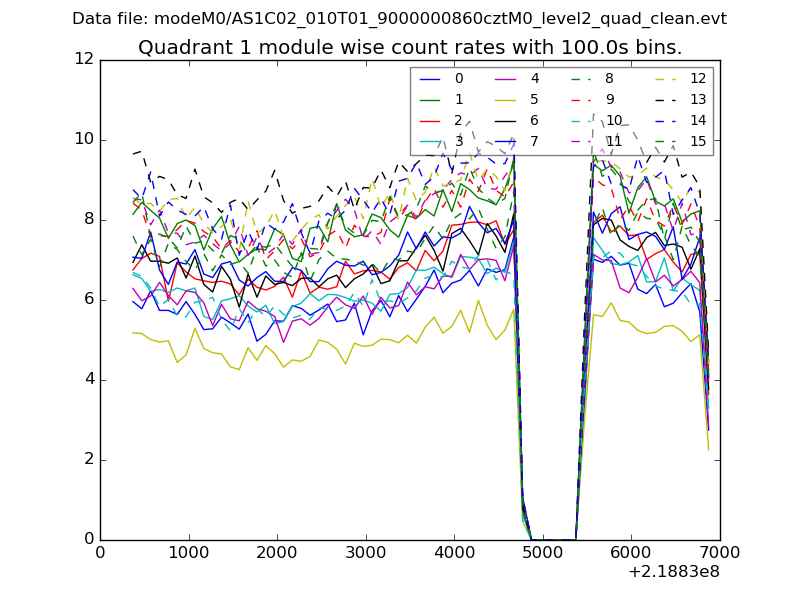
| Module-wise count rates for Quadrant A Data is divided into 100 sec bins |
 |
 |
| Module-wise count rates for Quadrant B Data is divided into 100 sec bins |
 |
 |
| Module-wise count rates for Quadrant C Data is divided into 100 sec bins |
 |
 |
| Module-wise count rates for Quadrant D Data is divided into 100 sec bins |
 |
 |
| Parameter | Plot |
|---|---|
| CZT HV Monitor |  |
| D_VDD |  |
| Temperature 1 |  |
| Veto HV Monitor |  |
| Veto LLD |  |
| Alpha Counter |  |
| _CPM_Rate |  |
| CZT Counter |  |
| +2.5 Volts monitor |  |
| +5 Volts monitor |  |
| _ROLL_ROT | 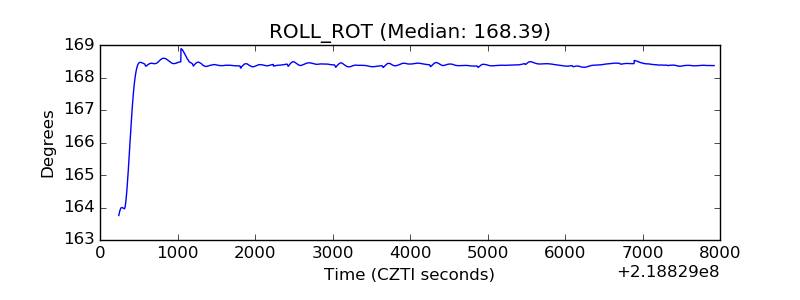 |
| _Roll_DEC |  |
| _Roll_RA |  |
| Veto Counter |  |