| Param | Original file | Final file |
|---|---|---|
| Filename | modeM0/AS1C02_010T01_9000000860_06464cztM0_level2.evt | modeM0/AS1C02_010T01_9000000860_06464cztM0_level2_quad_clean.evt |
| Size (bytes) | 201,326,400 | 50,328,000 |
| Size | 192.0 MB | 48.0 MB |
| Events in quadrant A | 1,309,387 | 332,381 |
| Events in quadrant B | 1,380,780 | 332,768 |
| Events in quadrant C | 1,290,180 | 326,577 |
| Events in quadrant D | 1,904,389 | 311,926 |
| Mode SS | |||
|---|---|---|---|
| Quadrant | BADHDUFLAG | Total packets | Discarded packets |
| A | 0 | 62 | 0 |
| B | 0 | 62 | 0 |
| C | 0 | 62 | 0 |
| D | 0 | 62 | 0 |
| Mode M0 | |||
|---|---|---|---|
| Quadrant | BADHDUFLAG | Total packets | Discarded packets |
| A | 0 | 6234 | 2 |
| B | 0 | 6382 | 1 |
| C | 0 | 6195 | 1 |
| D | 0 | 7814 | 1 |
| Quadrant | Total seconds | Saturated seconds | Saturation percentage |
|---|---|---|---|
| A | 3091 | 3 | 0.097056% |
| B | 3091 | 4 | 0.129408% |
| C | 3091 | 0 | 0.000000% |
| D | 3091 | 79 | 2.555807% |
Noise dominated data is calculated using 1-second bins in cleaned event files. If a bin has >2000 counts, and if more than 50% of those come from <1% of pixels, then it is considered to be noise-dominated and hence unusable.
| Quadrant | # 1 sec bins | Bins with >0 counts | Bins with >2000 counts | High rate bins dominated by noise | Noise dominated (total time) | Noise dominated (detector-on time) | Marked lightcurve |
|---|---|---|---|---|---|---|---|
| A | 3091 | 3091 | 0 | 0 | 0.00% | 0.00% | 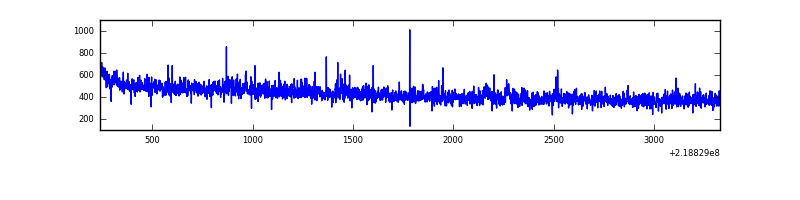 |
| B | 3091 | 3091 | 0 | 0 | 0.00% | 0.00% | 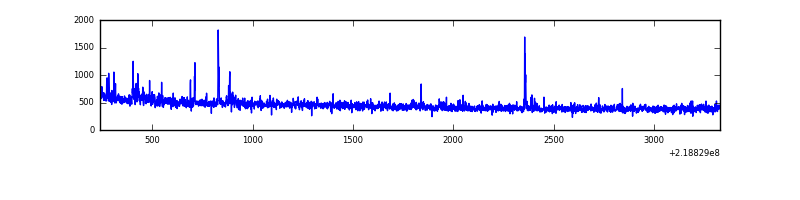 |
| C | 3091 | 3091 | 0 | 0 | 0.00% | 0.00% | 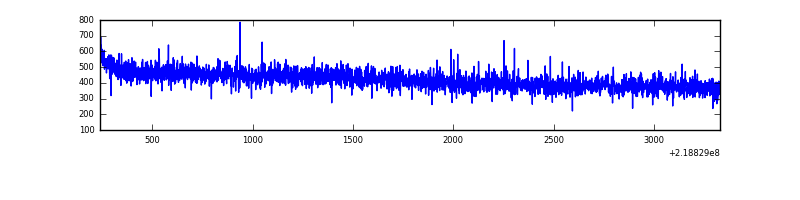 |
| D | 3091 | 3091 | 60 | 60 | 1.94% | 1.94% | 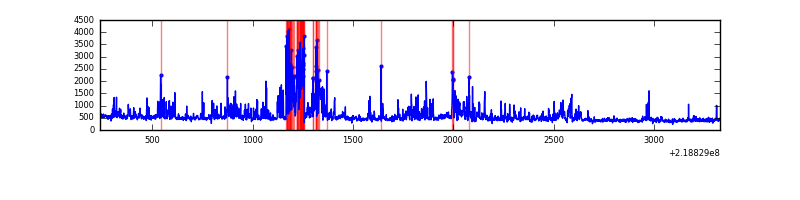 |
Top three noisy pixels from each quadrant. If the there are fewer than three noisy pixels in the level2.evt file, extra rows are filled as -1
| Pixel properties | Quadrant properties | ||||||
|---|---|---|---|---|---|---|---|
| Quadrant | DetID | PixID | Counts | Sigma | Mean | Median | Sigma |
| A | 8 | 15 | 12469 | 174.37 | 333 | 325 | 69.6 |
| A | 15 | 236 | 5787 | 78.43 | 333 | 325 | 69.6 |
| A | 10 | 133 | 5224 | 70.34 | 333 | 325 | 69.6 |
| B | 15 | 204 | 18529 | 278.55 | 338 | 329 | 65.3 |
| B | 4 | 81 | 17647 | 265.05 | 338 | 329 | 65.3 |
| B | 0 | 214 | 17134 | 257.2 | 338 | 329 | 65.3 |
| C | 13 | 61 | 2564 | 28.73 | 329 | 330 | 77.8 |
| C | 12 | 4 | 1691 | 17.5 | 329 | 330 | 77.8 |
| C | 10 | 170 | 1645 | 16.91 | 329 | 330 | 77.8 |
| D | 2 | 152 | 517823 | 6430.07 | 324 | 314 | 80.5 |
| D | 11 | 241 | 67591 | 835.92 | 324 | 314 | 80.5 |
| D | 8 | 195 | 21582 | 264.26 | 324 | 314 | 80.5 |
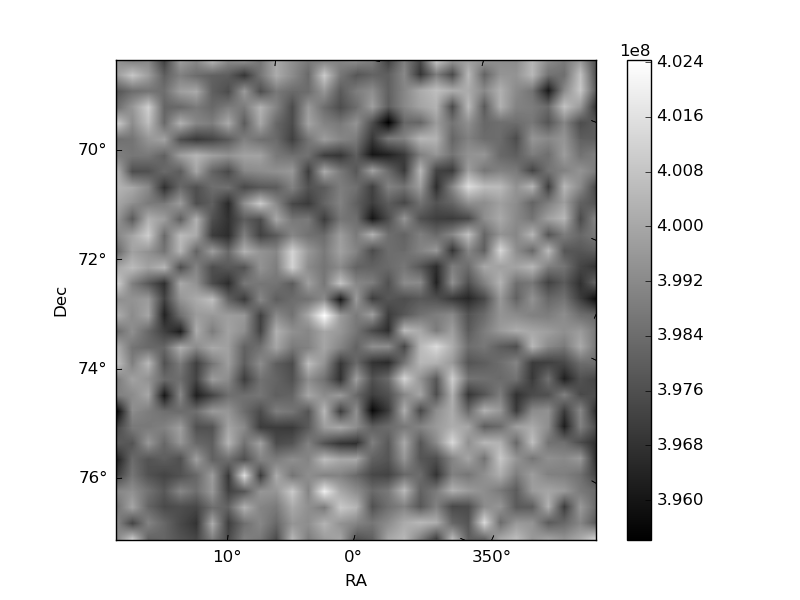
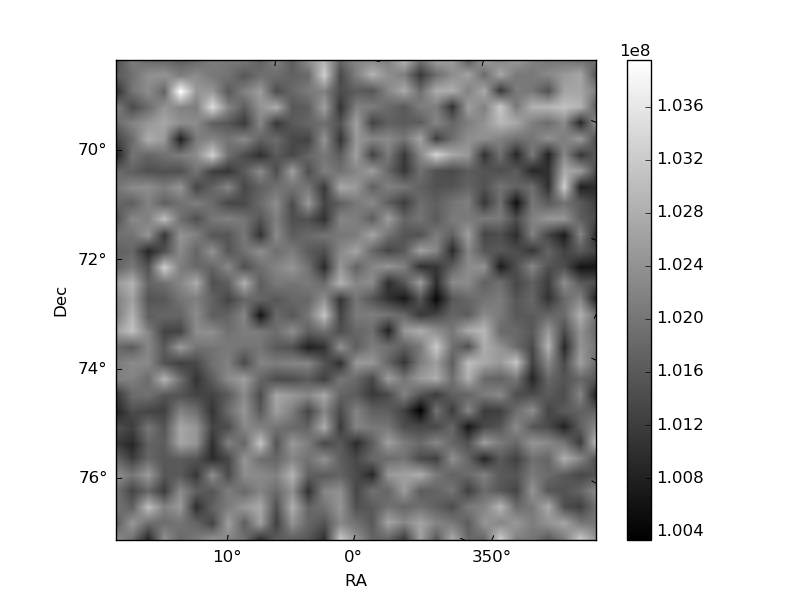
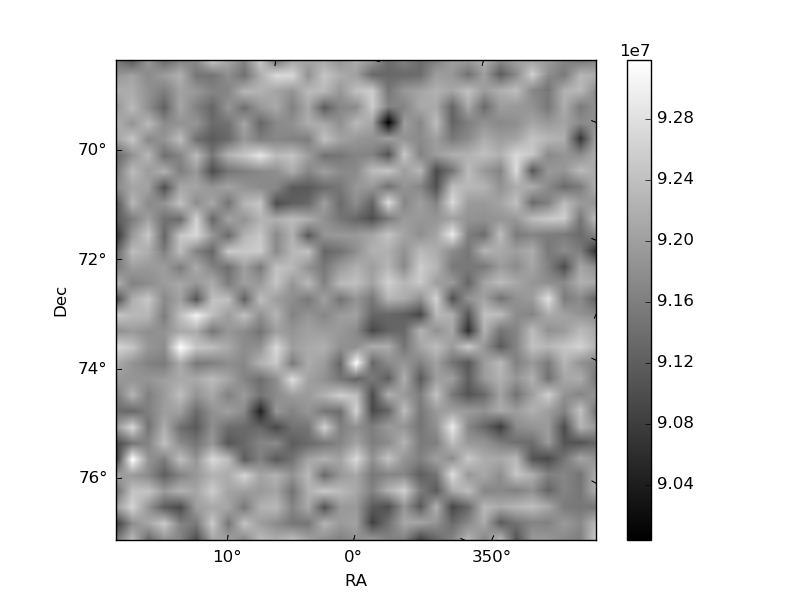
Histogram calculated using DETX and DETY for each event in the final _common_clean file
| Quadrant A | 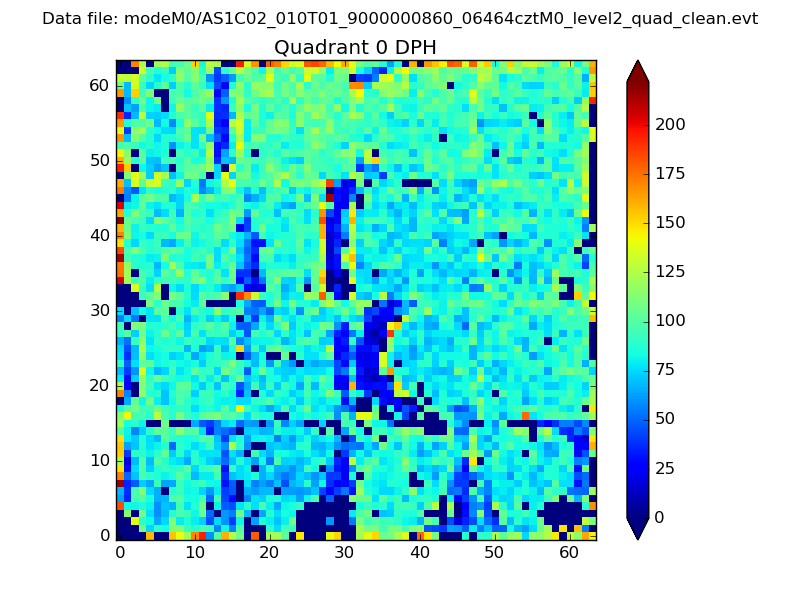 |
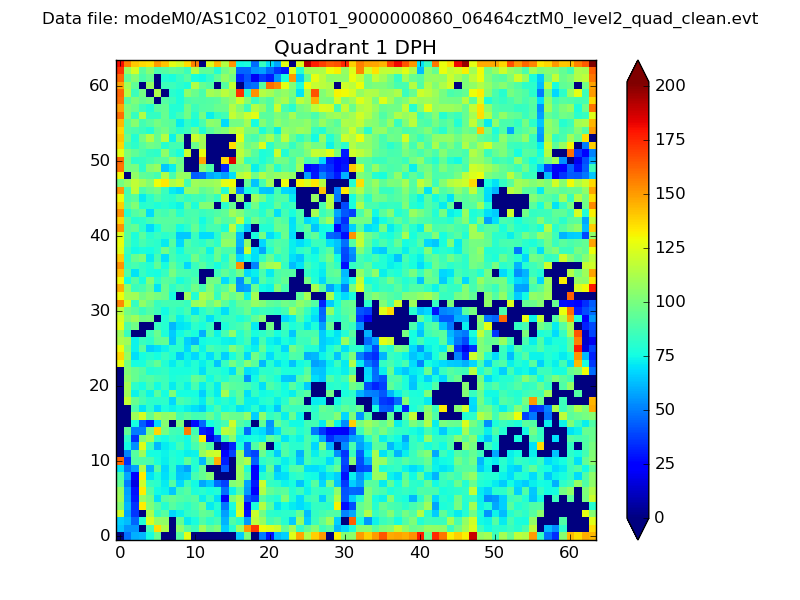 |
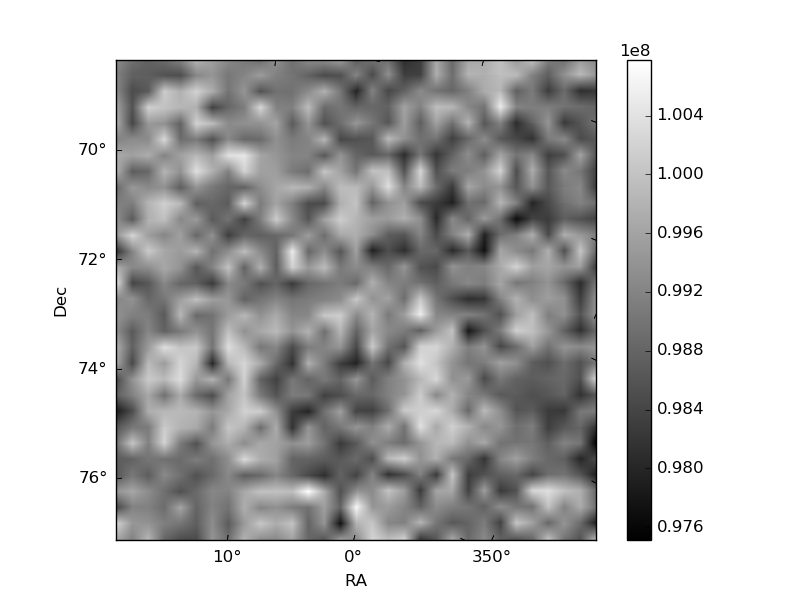
Quadrant B |
|---|---|---|---|
| Quadrant D | 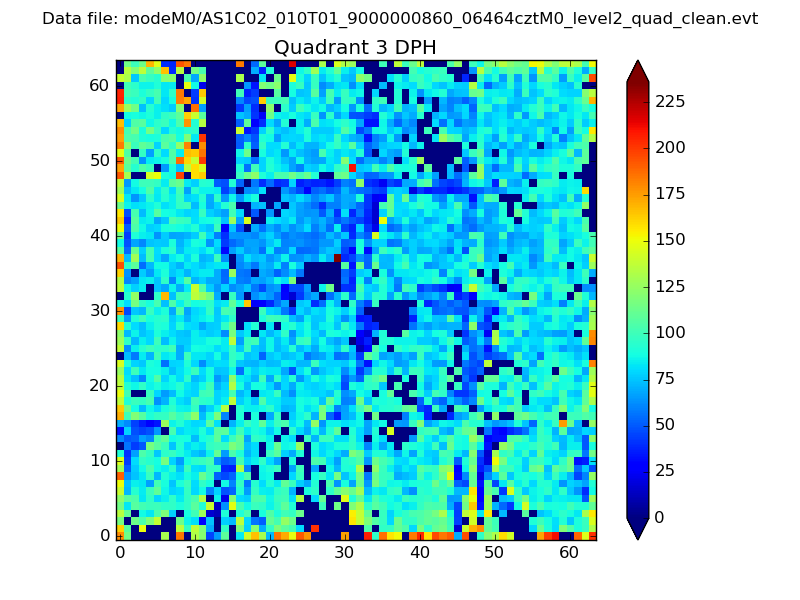 |
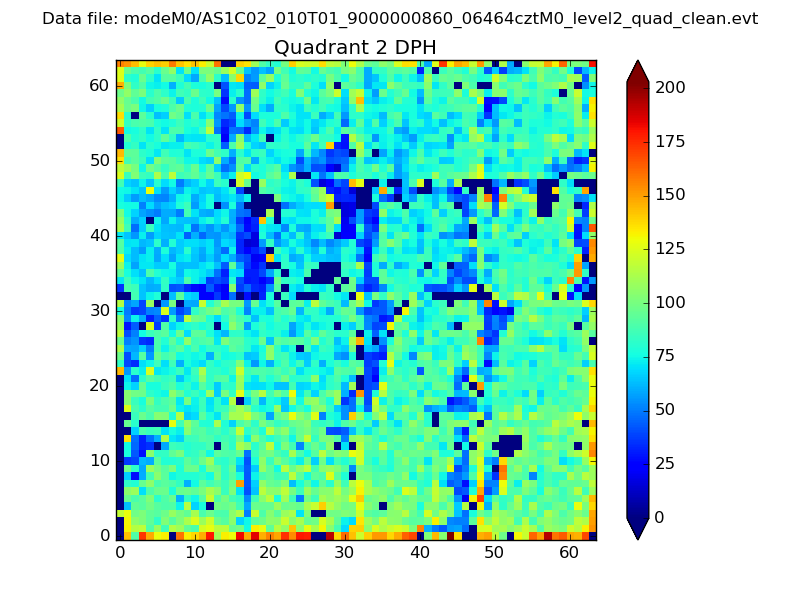 |
Quadrant C |
| Plot type | Count rate plots | Images |
|---|---|---|
| Comparison with Poisson distribution Blue bars denote a histogram of data divided into 1 sec bins. Red curve is a Poisson curve with rate = median count rate of data. |
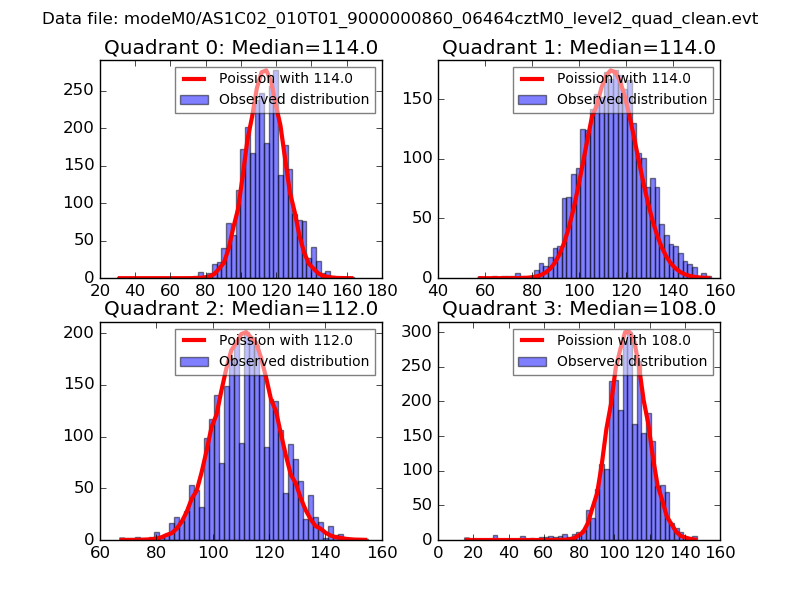 |
 |
| Quadrant-wise count rates Data is divided into 100 sec bins |
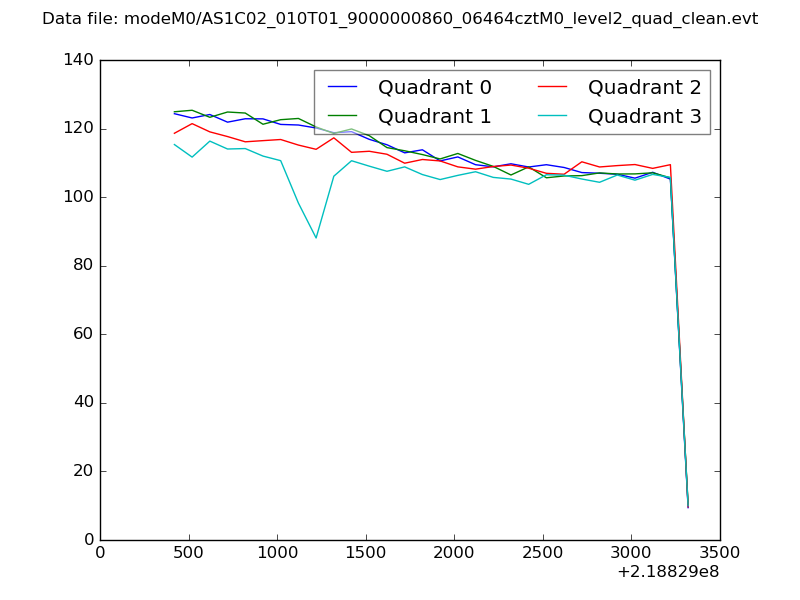 |
|
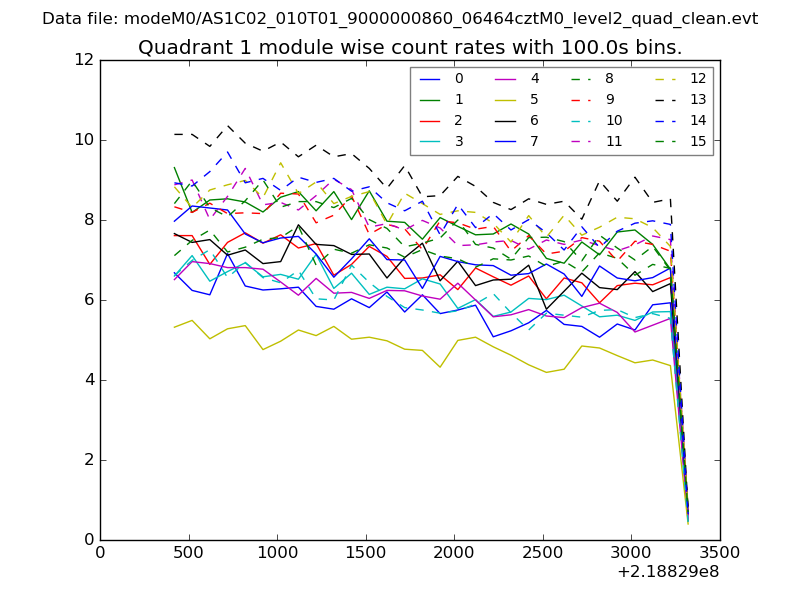
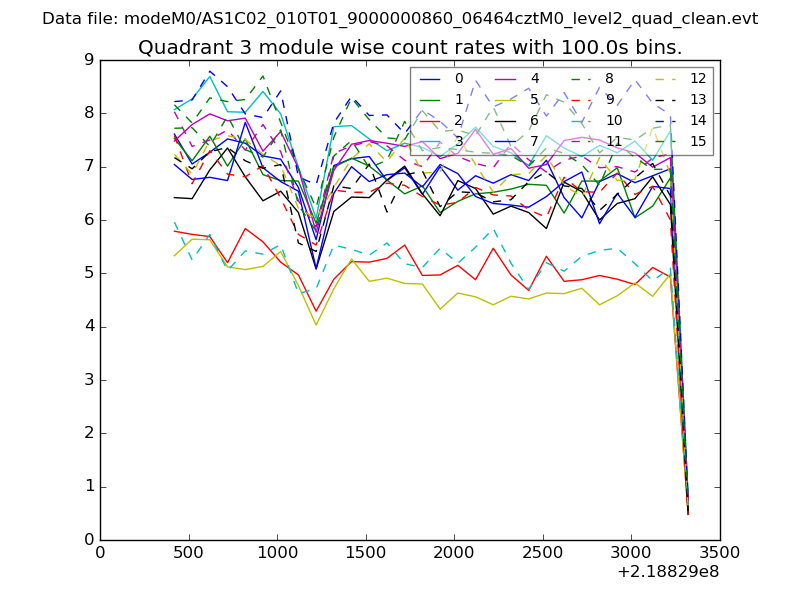
| Module-wise count rates for Quadrant A Data is divided into 100 sec bins |
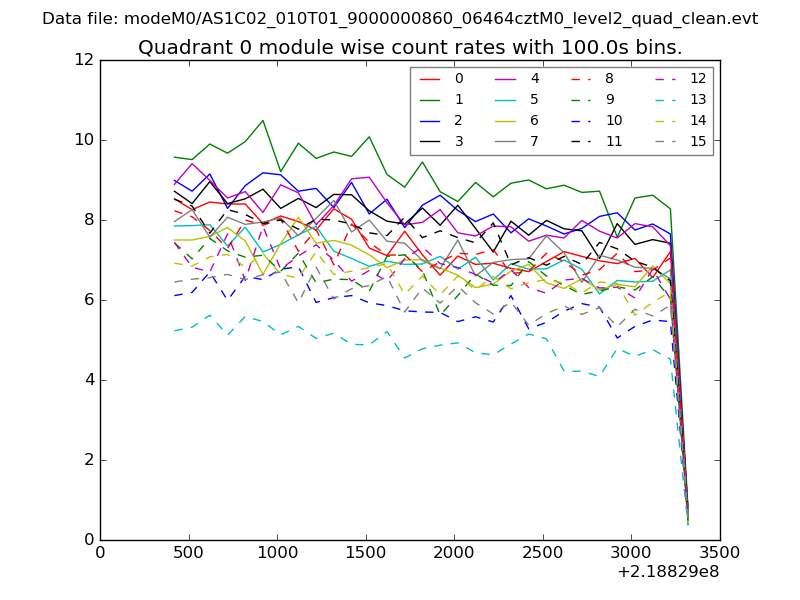 |
 |
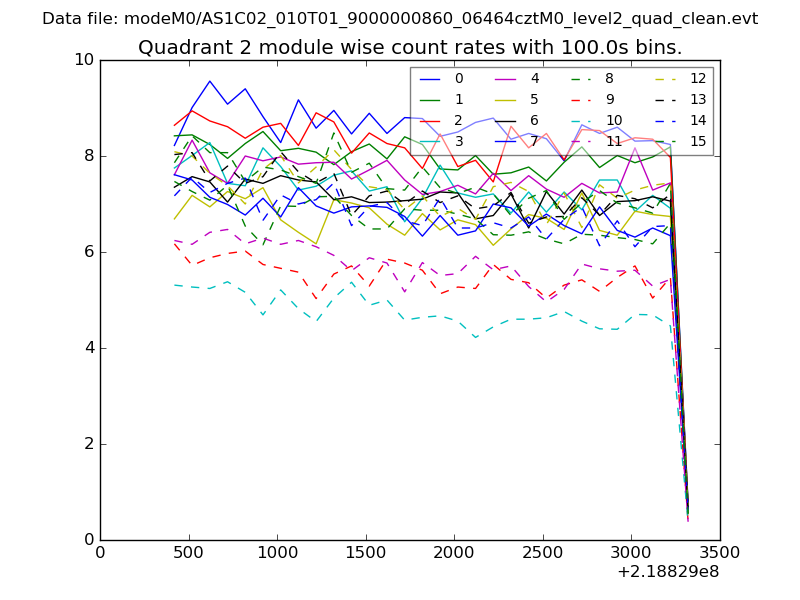
| Module-wise count rates for Quadrant B Data is divided into 100 sec bins |
 |
 |
| Module-wise count rates for Quadrant C Data is divided into 100 sec bins |
 |
 |
| Module-wise count rates for Quadrant D Data is divided into 100 sec bins |
 |
 |
| Parameter | Plot |
|---|---|
| CZT HV Monitor | 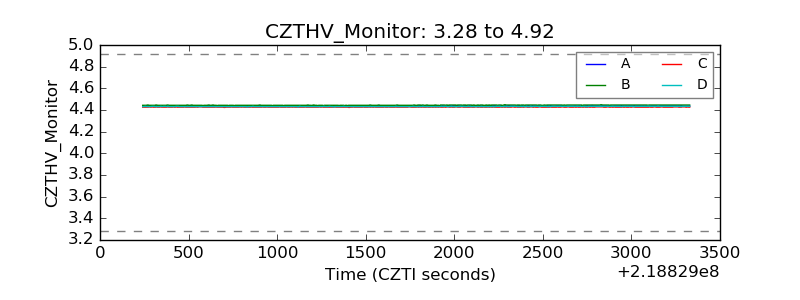 |
| D_VDD | 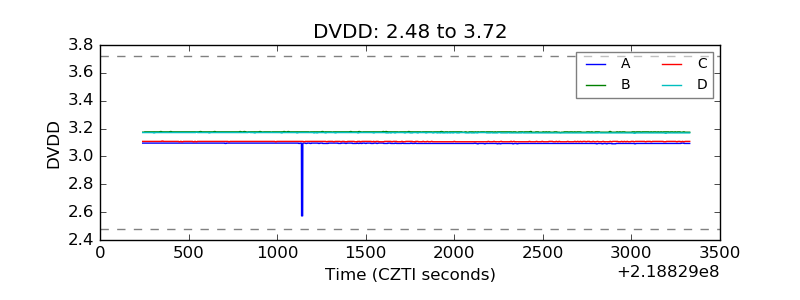 |
| Temperature 1 | 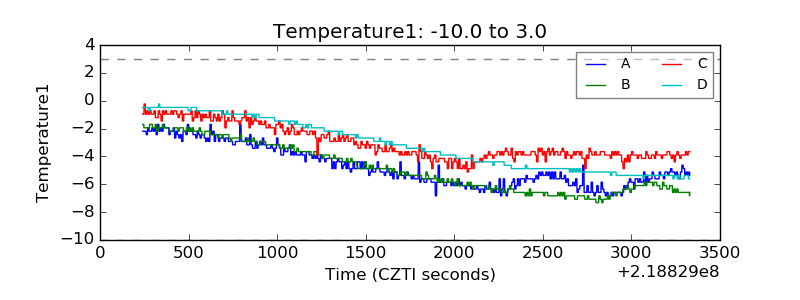 |
| Veto HV Monitor | 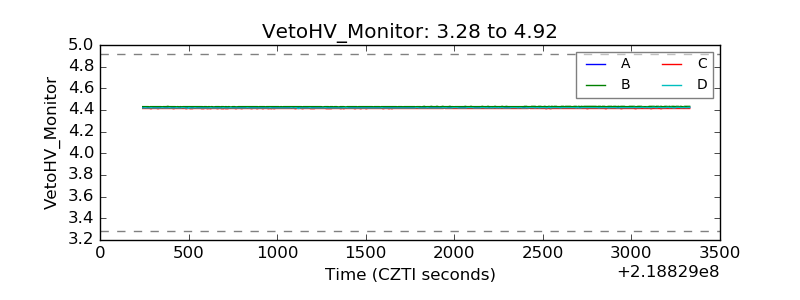 |
| Veto LLD | 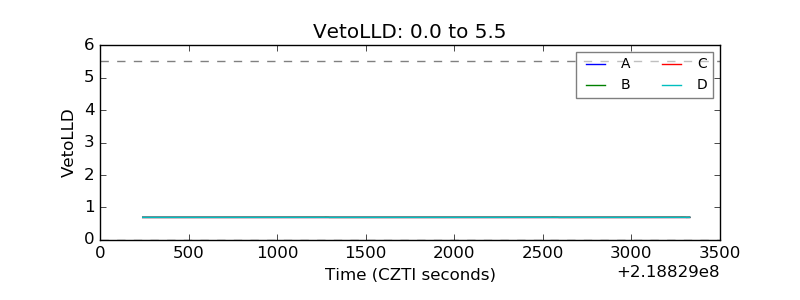 |
| Alpha Counter | 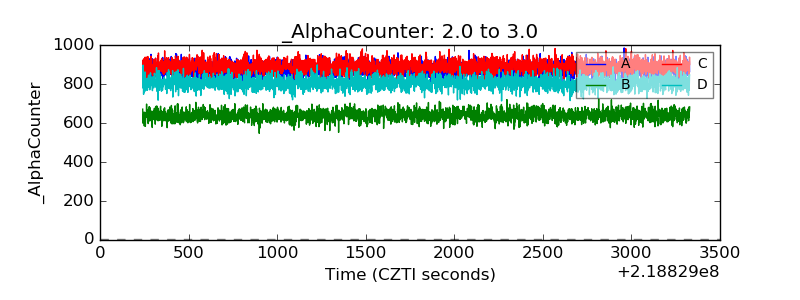 |
| _CPM_Rate | 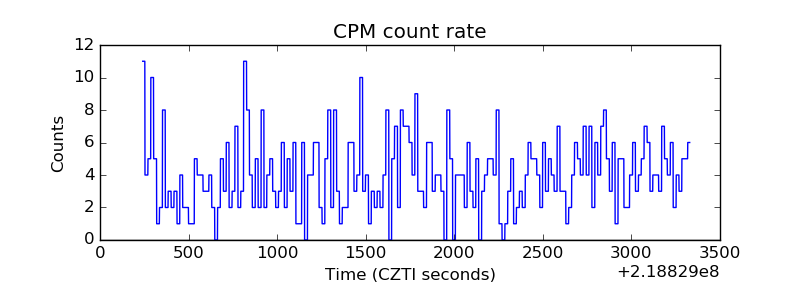 |
| CZT Counter | 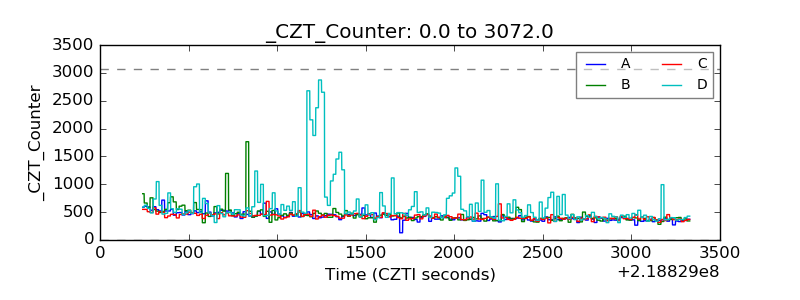 |
| +2.5 Volts monitor |  |
| +5 Volts monitor |  |
| _ROLL_ROT | 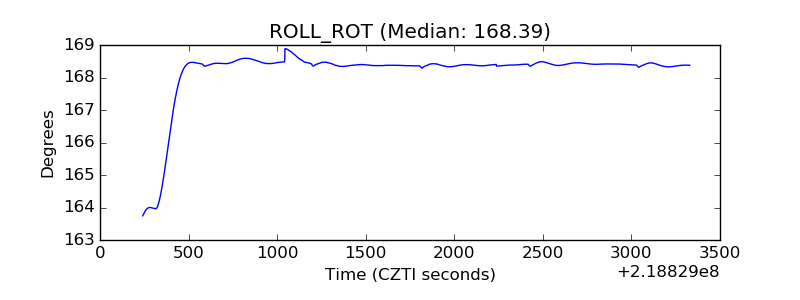 |
| _Roll_DEC | 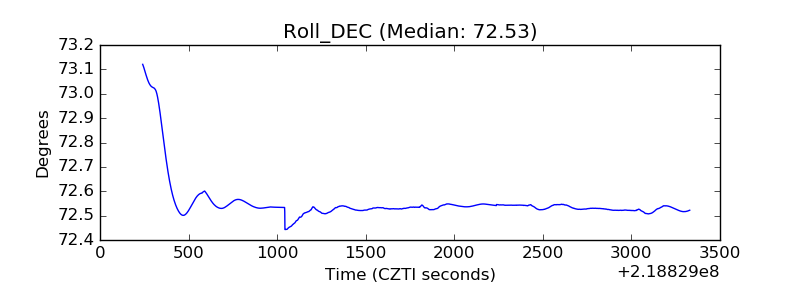 |
| _Roll_RA | 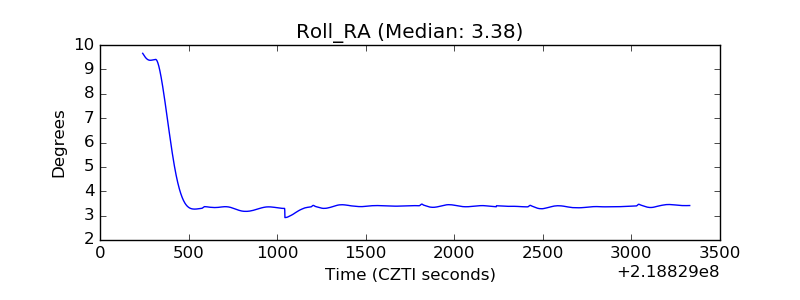 |
| Veto Counter | 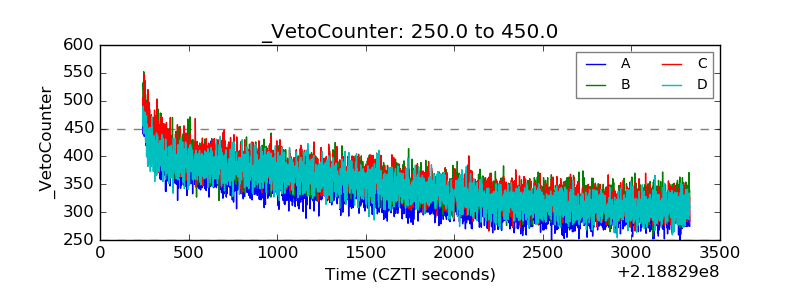 |