| Param | Original file | Final file |
|---|---|---|
| Filename | modeM0/AS1C02_010T01_9000000860_06465cztM0_level2.evt | modeM0/AS1C02_010T01_9000000860_06465cztM0_level2_quad_clean.evt |
| Size (bytes) | 314,824,320 | 87,105,600 |
| Size | 300.2 MB | 83.1 MB |
| Events in quadrant A | 2,356,653 | 577,506 |
| Events in quadrant B | 2,259,729 | 583,406 |
| Events in quadrant C | 2,144,069 | 574,287 |
| Events in quadrant D | 2,435,866 | 555,128 |
| Mode SS | |||
|---|---|---|---|
| Quadrant | BADHDUFLAG | Total packets | Discarded packets |
| A | 0 | 100 | 0 |
| B | 0 | 100 | 0 |
| C | 0 | 100 | 0 |
| D | 0 | 100 | 0 |
| Mode M0 | |||
|---|---|---|---|
| Quadrant | BADHDUFLAG | Total packets | Discarded packets |
| A | 0 | 10625 | 1 |
| B | 0 | 10198 | 1 |
| C | 0 | 10048 | 1 |
| D | 0 | 10635 | 1 |
| Mode M9 | |||
|---|---|---|---|
| Quadrant | BADHDUFLAG | Total packets | Discarded packets |
| A | 0 | 8 | 0 |
| B | 0 | 8 | 0 |
| C | 0 | 8 | 0 |
| D | 0 | 8 | 0 |
| Quadrant | Total seconds | Saturated seconds | Saturation percentage |
|---|---|---|---|
| A | 4960 | 20 | 0.403226% |
| B | 4960 | 32 | 0.645161% |
| C | 4960 | 22 | 0.443548% |
| D | 4960 | 28 | 0.564516% |
Noise dominated data is calculated using 1-second bins in cleaned event files. If a bin has >2000 counts, and if more than 50% of those come from <1% of pixels, then it is considered to be noise-dominated and hence unusable.
| Quadrant | # 1 sec bins | Bins with >0 counts | Bins with >2000 counts | High rate bins dominated by noise | Noise dominated (total time) | Noise dominated (detector-on time) | Marked lightcurve |
|---|---|---|---|---|---|---|---|
| A | 5700 | 4961 | 0 | 0 | 0.00% | 0.00% | 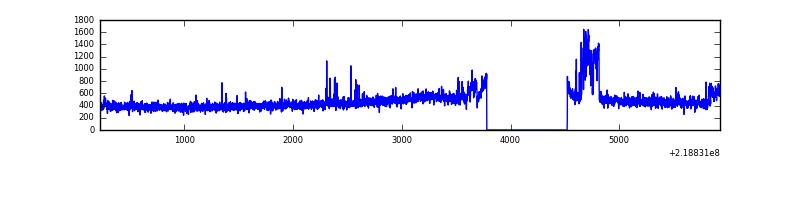 |
| B | 5700 | 4961 | 0 | 0 | 0.00% | 0.00% | 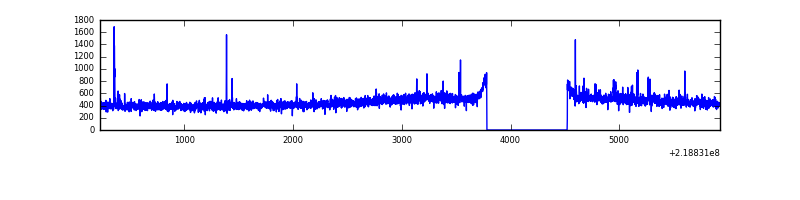 |
| C | 5700 | 4961 | 1 | 1 | 0.02% | 0.02% | 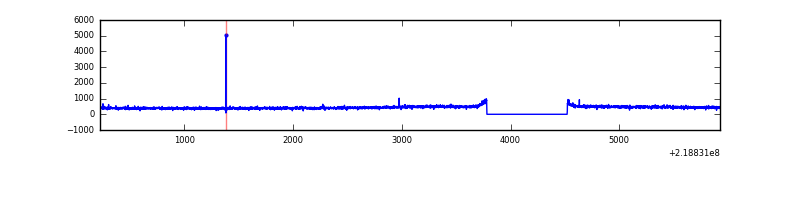 |
| D | 5700 | 4961 | 2 | 2 | 0.04% | 0.04% | 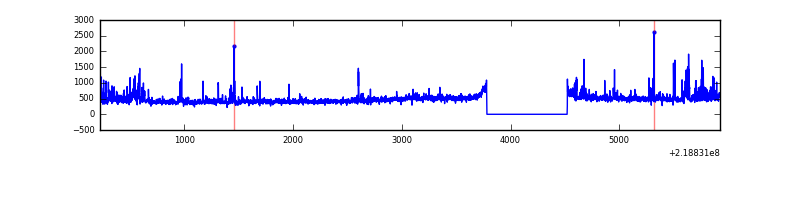 |
Top three noisy pixels from each quadrant. If the there are fewer than three noisy pixels in the level2.evt file, extra rows are filled as -1
| Pixel properties | Quadrant properties | ||||||
|---|---|---|---|---|---|---|---|
| Quadrant | DetID | PixID | Counts | Sigma | Mean | Median | Sigma |
| A | 15 | 236 | 170540 | 1478.2 | 560 | 548 | 115.0 |
| A | 8 | 15 | 20722 | 175.43 | 560 | 548 | 115.0 |
| A | 10 | 133 | 6075 | 48.06 | 560 | 548 | 115.0 |
| B | 0 | 245 | 17229 | 152.49 | 565 | 552 | 109.4 |
| B | 15 | 204 | 13396 | 117.45 | 565 | 552 | 109.4 |
| B | 12 | 111 | 10776 | 93.49 | 565 | 552 | 109.4 |
| C | 12 | 4 | 8010 | 58.82 | 544 | 545 | 126.9 |
| C | 1 | 16 | 5554 | 39.47 | 544 | 545 | 126.9 |
| C | 13 | 61 | 4309 | 29.66 | 544 | 545 | 126.9 |
| D | 2 | 152 | 141775 | 1066.06 | 543 | 527 | 132.5 |
| D | 11 | 241 | 74545 | 558.64 | 543 | 527 | 132.5 |
| D | 8 | 195 | 46692 | 348.43 | 543 | 527 | 132.5 |
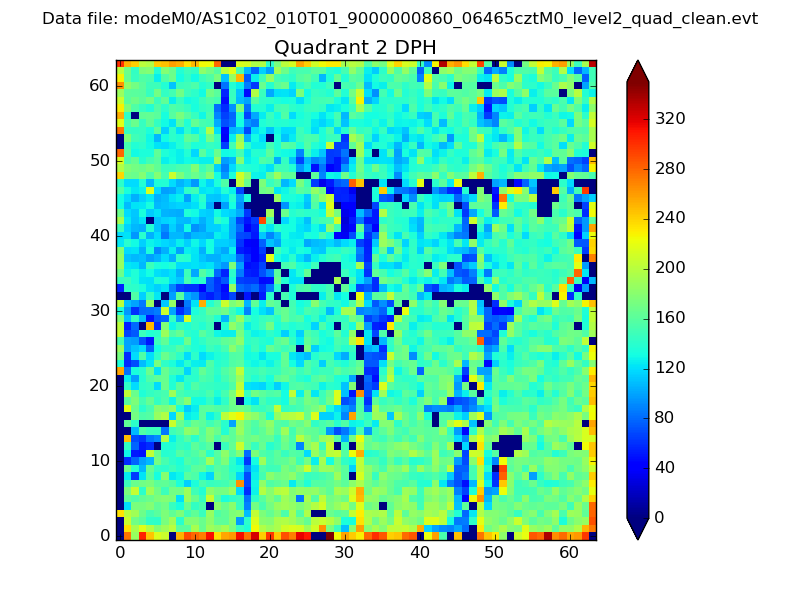
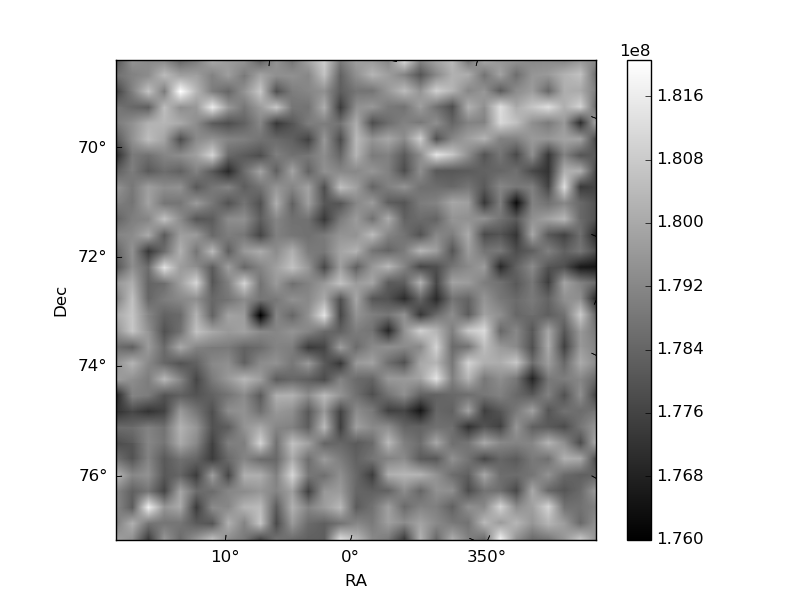
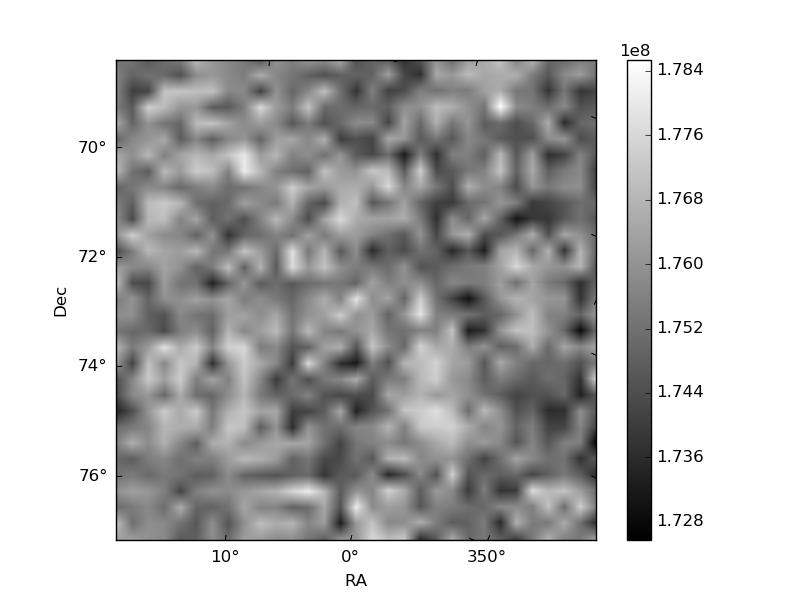
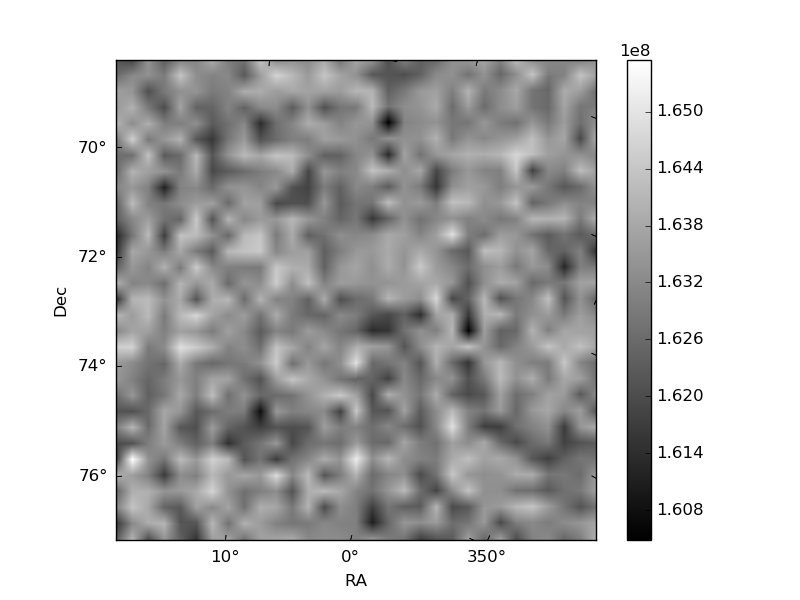
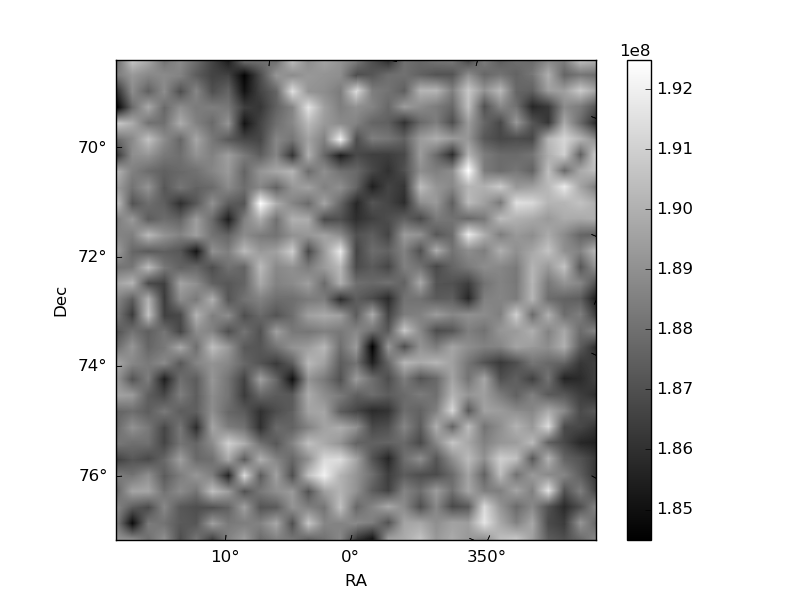
Histogram calculated using DETX and DETY for each event in the final _common_clean file
| Quadrant A |  |
 |
Quadrant B |
|---|---|---|---|
| Quadrant D | 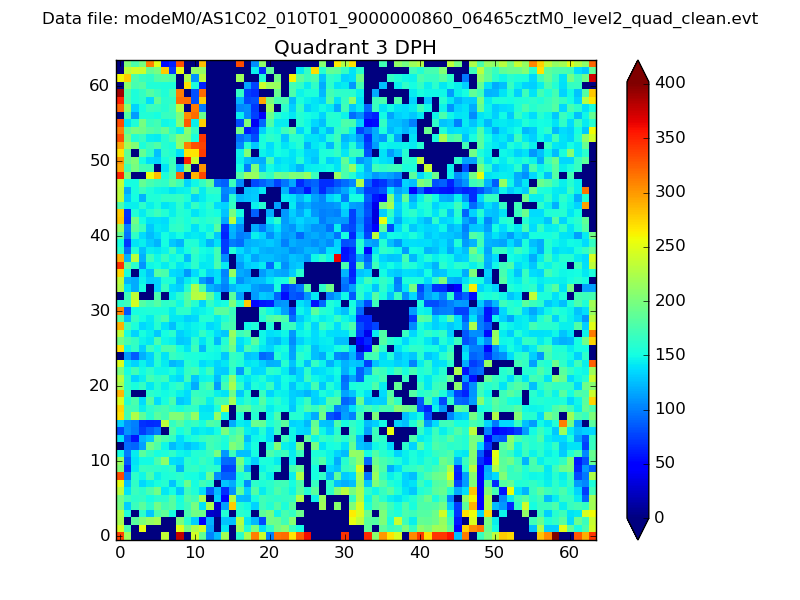 |
 |
Quadrant C |
| Plot type | Count rate plots | Images |
|---|---|---|
| Comparison with Poisson distribution Blue bars denote a histogram of data divided into 1 sec bins. Red curve is a Poisson curve with rate = median count rate of data. |
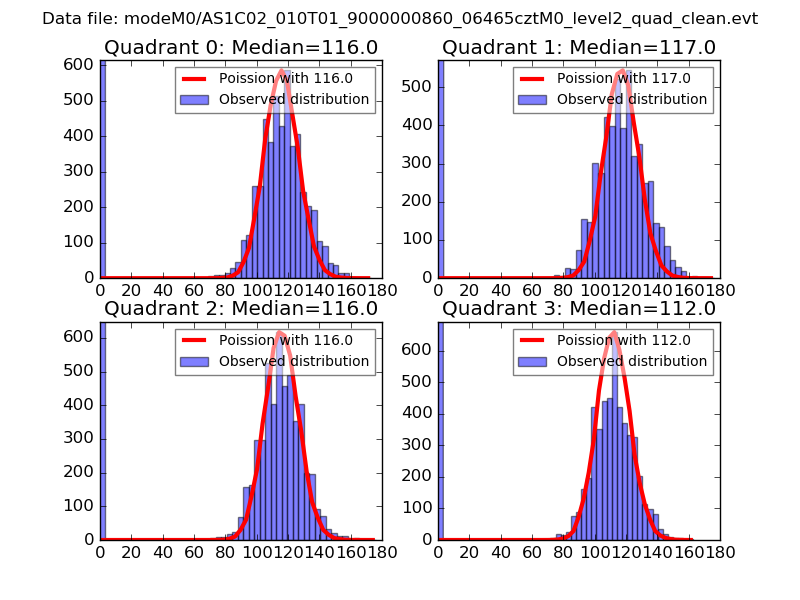 |
 |
| Quadrant-wise count rates Data is divided into 100 sec bins |
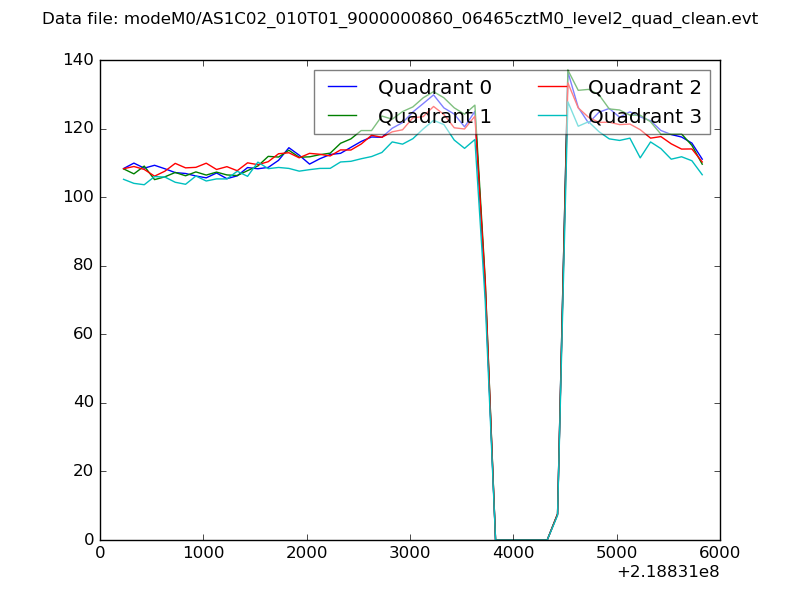 |
|
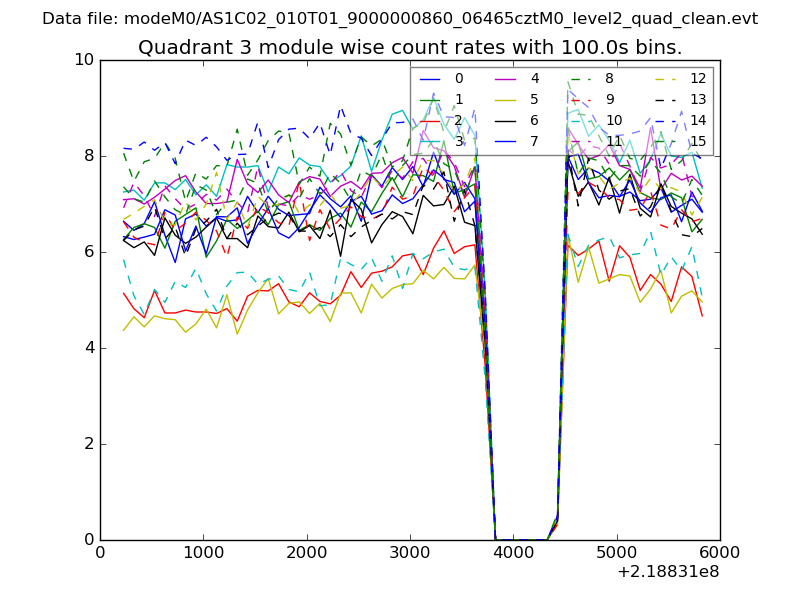
| Module-wise count rates for Quadrant A Data is divided into 100 sec bins |
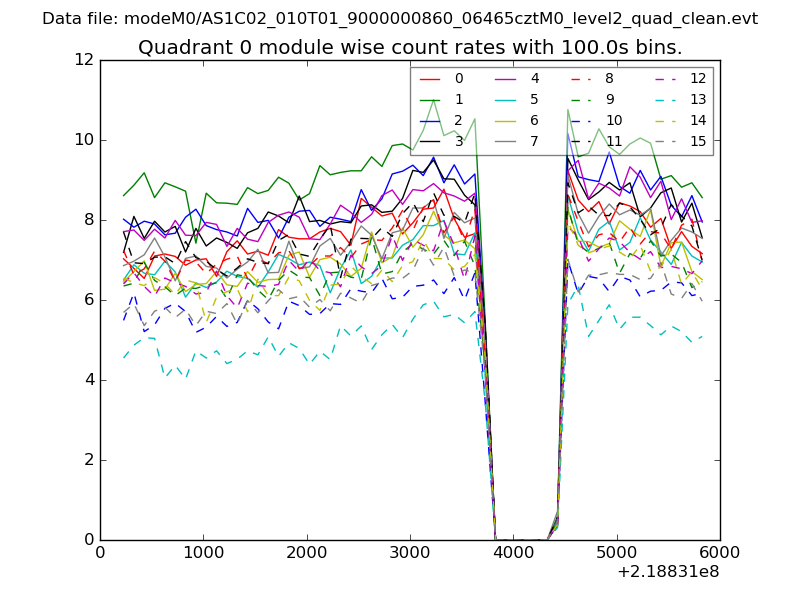 |
 |
| Module-wise count rates for Quadrant B Data is divided into 100 sec bins |
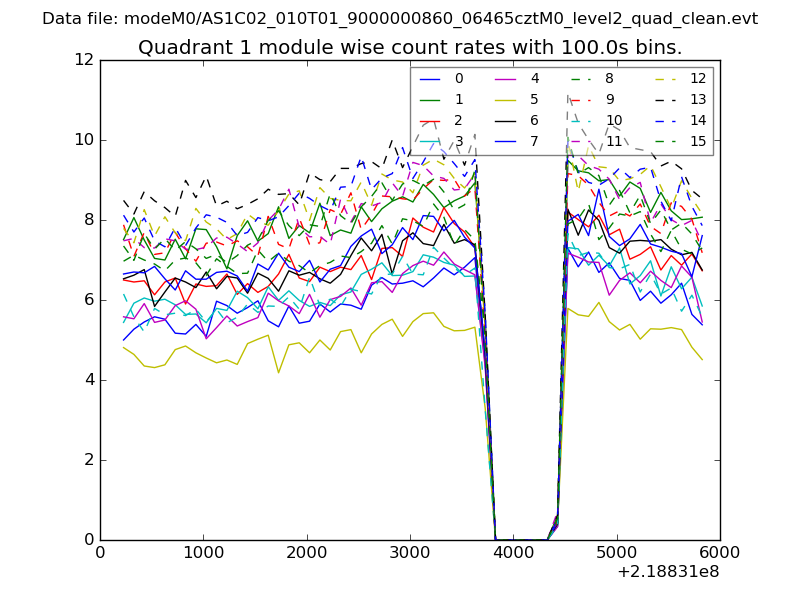 |
 |
| Module-wise count rates for Quadrant C Data is divided into 100 sec bins |
 |
 |
| Module-wise count rates for Quadrant D Data is divided into 100 sec bins |
 |
 |
| Parameter | Plot |
|---|---|
| CZT HV Monitor | 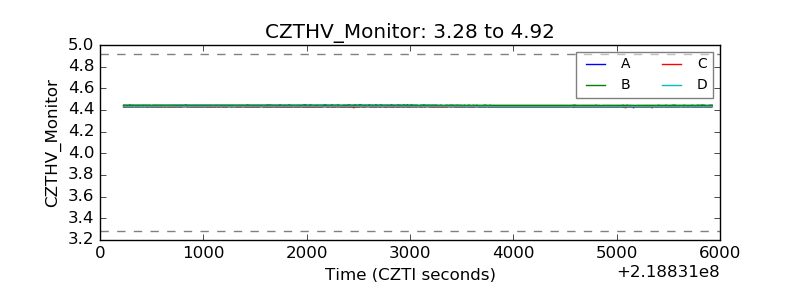 |
| D_VDD | 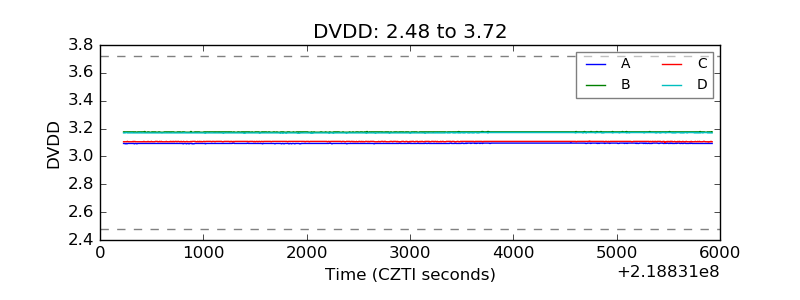 |
| Temperature 1 | 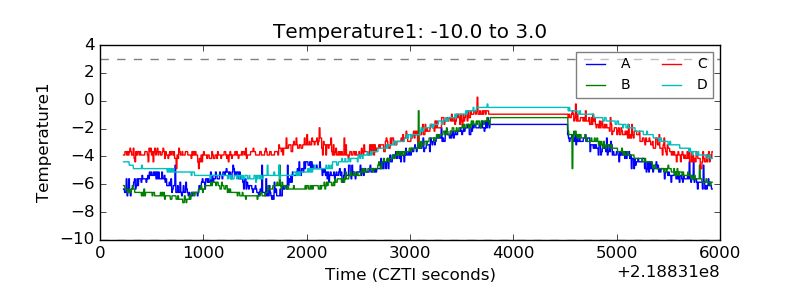 |
| Veto HV Monitor | 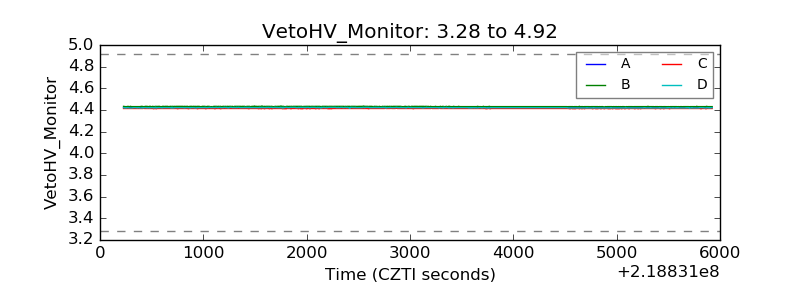 |
| Veto LLD | 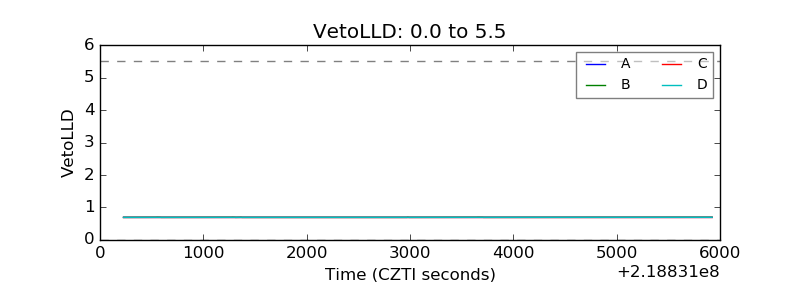 |
| Alpha Counter | 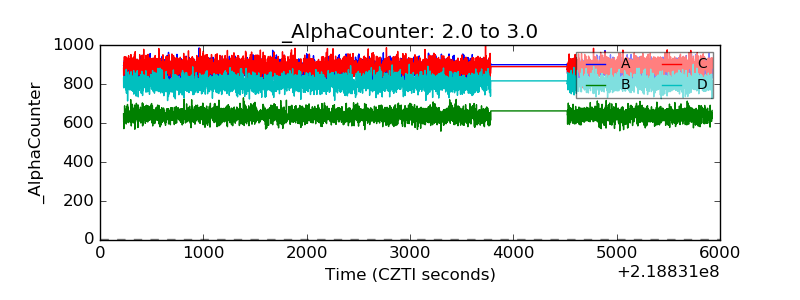 |
| _CPM_Rate | 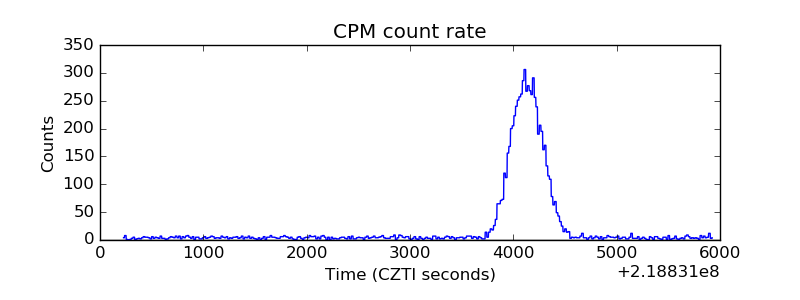 |
| CZT Counter | 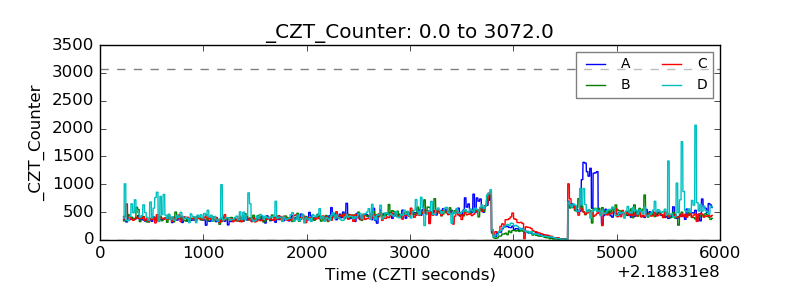 |
| +2.5 Volts monitor |  |
| +5 Volts monitor | 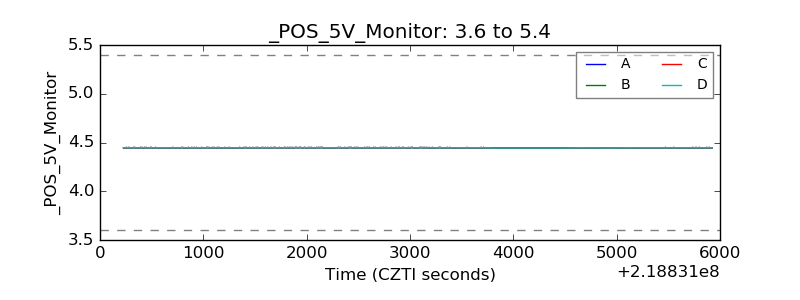 |
| _ROLL_ROT | 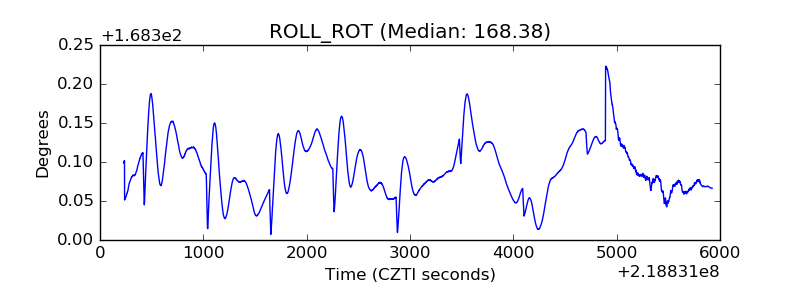 |
| _Roll_DEC | 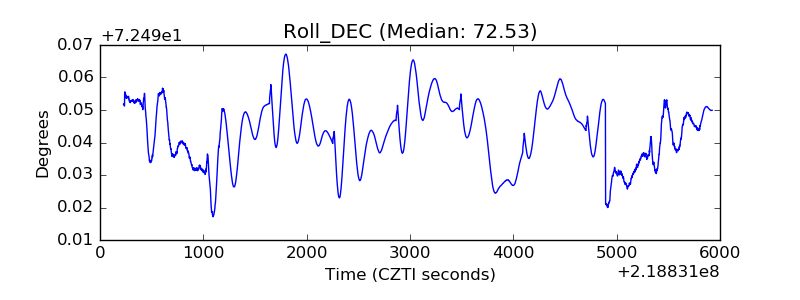 |
| _Roll_RA | 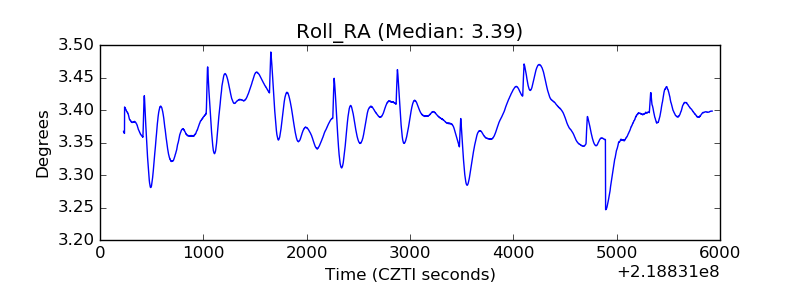 |
| Veto Counter | 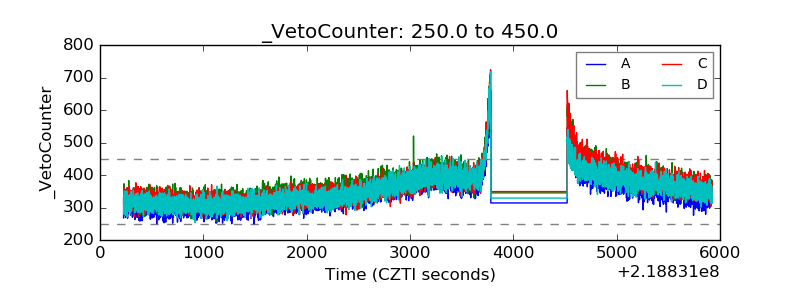 |