| Param | Original file | Final file |
|---|---|---|
| Filename | modeM0/AS1G06_139T02_9000000862cztM0_level2.fits | modeM0/AS1G06_139T02_9000000862cztM0_level2_quad_clean.evt |
| Size (bytes) | 573,433,920 | 534,648,960 |
| Size | 546.9 MB | 509.9 MB |
| Events in quadrant A | 3,460,908 | 3,142,048 |
| Events in quadrant B | 3,375,534 | 3,129,938 |
| Events in quadrant C | 3,407,948 | 2,978,442 |
| Events in quadrant D | 2,944,242 | 2,763,781 |
| Mode M9 | |||
|---|---|---|---|
| Quadrant | BADHDUFLAG | Total packets | Discarded packets |
| A | 0 | 95 | 0 |
| B | 0 | 95 | 0 |
| C | 0 | 95 | 0 |
| D | 0 | 95 | 0 |
| Mode M0 | |||
|---|---|---|---|
| Quadrant | BADHDUFLAG | Total packets | Discarded packets |
| A | 0 | 139315 | 0 |
| B | 0 | 127848 | 0 |
| C | 0 | 127289 | 0 |
| D | 0 | 134069 | 0 |
| Mode SS | |||
|---|---|---|---|
| Quadrant | BADHDUFLAG | Total packets | Discarded packets |
| A | 0 | 1238 | 0 |
| B | 0 | 1238 | 0 |
| C | 0 | 1238 | 0 |
| D | 0 | 1238 | 0 |
| Quadrant | Total seconds | Saturated seconds | Saturation percentage |
|---|---|---|---|
| A | 60906 | 1119 | 1.837257% |
| B | 60906 | 996 | 1.635307% |
| C | 60905 | 548 | 0.899762% |
| D | 60906 | 953 | 1.564706% |
Noise dominated data is calculated using 1-second bins in cleaned event files. If a bin has >2000 counts, and if more than 50% of those come from <1% of pixels, then it is considered to be noise-dominated and hence unusable.
| Quadrant | # 1 sec bins | Bins with >0 counts | Bins with >2000 counts | High rate bins dominated by noise | Noise dominated (total time) | Noise dominated (detector-on time) | Marked lightcurve |
|---|---|---|---|---|---|---|---|
| A | 70436 | 60907 | 0 | 0 | 0.00% | 0.00% |  |
| B | 70436 | 60906 | 0 | 0 | 0.00% | 0.00% |  |
| C | 70436 | 60906 | 0 | 0 | 0.00% | 0.00% |  |
| D | 70436 | 60905 | 0 | 0 | 0.00% | 0.00% |  |
Top three noisy pixels from each quadrant. If the there are fewer than three noisy pixels in the level2.evt file, extra rows are filled as -1
| Pixel properties | Quadrant properties | ||||||
|---|---|---|---|---|---|---|---|
| Quadrant | DetID | PixID | Counts | Sigma | Mean | Median | Sigma |
| A | 0 | 29 | 3259 | 10.54 | 899 | 838 | 229.8 |
| A | 7 | 110 | 2887 | 8.92 | 899 | 838 | 229.8 |
| A | 0 | 30 | 2588 | 7.62 | 899 | 838 | 229.8 |
| B | 2 | 9 | 2934 | 11.4 | 892 | 847 | 183.0 |
| B | 12 | 226 | 2300 | 7.94 | 892 | 847 | 183.0 |
| B | 3 | 17 | 2282 | 7.84 | 892 | 847 | 183.0 |
| C | 1 | 80 | 2509 | 7.08 | 898 | 832 | 237.0 |
| C | 1 | 81 | 2485 | 6.97 | 898 | 832 | 237.0 |
| C | 12 | 241 | 2442 | 6.79 | 898 | 832 | 237.0 |
| D | 3 | 14 | 2276 | 6.57 | 840 | 760 | 230.7 |
| D | 7 | 5 | 2209 | 6.28 | 840 | 760 | 230.7 |
| D | 11 | 82 | 2202 | 6.25 | 840 | 760 | 230.7 |
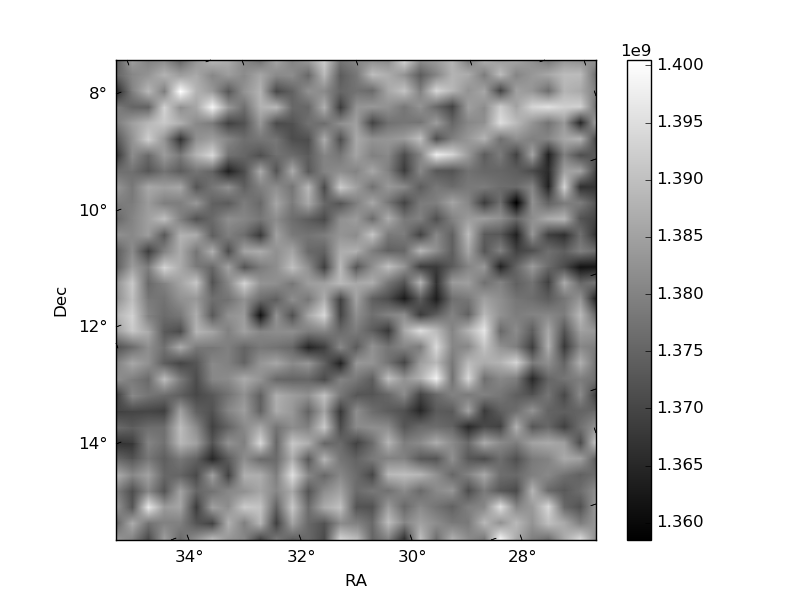
Histogram calculated using DETX and DETY for each event in the final _common_clean file
| Quadrant A |  |
 |
Quadrant B |
|---|---|---|---|
| Quadrant D |  |
 |
Quadrant C |
| Plot type | Count rate plots | Images |
|---|---|---|
| Comparison with Poisson distribution Blue bars denote a histogram of data divided into 1 sec bins. Red curve is a Poisson curve with rate = median count rate of data. |
 |
 |
| Quadrant-wise count rates Data is divided into 100 sec bins |
 |
|
| Module-wise count rates for Quadrant A Data is divided into 100 sec bins |
 |
 |
| Module-wise count rates for Quadrant B Data is divided into 100 sec bins |
 |
 |
| Module-wise count rates for Quadrant C Data is divided into 100 sec bins |
 |
 |
| Module-wise count rates for Quadrant D Data is divided into 100 sec bins |
 |
 |
| Parameter | Plot |
|---|---|
| CZT HV Monitor |  |
| D_VDD | 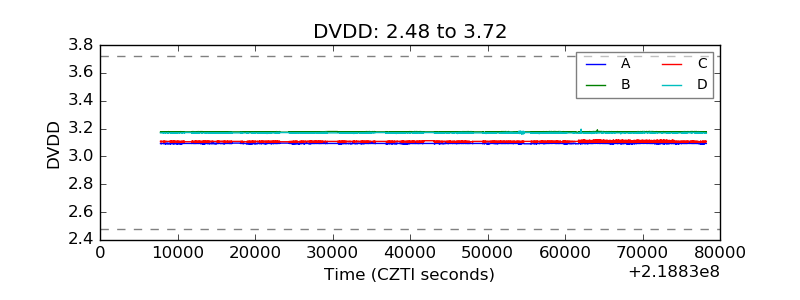 |
| Temperature 1 |  |
| Veto HV Monitor |  |
| Veto LLD |  |
| Alpha Counter |  |
| _CPM_Rate |  |
| CZT Counter |  |
| +2.5 Volts monitor |  |
| +5 Volts monitor |  |
| _ROLL_ROT |  |
| _Roll_DEC |  |
| _Roll_RA |  |
| Veto Counter |  |