| Param | Original file | Final file |
|---|---|---|
| Filename | modeM0/AS1G06_139T02_9000000862_06465cztM0_level2.evt | modeM0/AS1G06_139T02_9000000862_06465cztM0_level2_quad_clean.evt |
| Size (bytes) | 703,995,840 | 108,331,200 |
| Size | 671.4 MB | 103.3 MB |
| Events in quadrant A | 6,197,280 | 657,170 |
| Events in quadrant B | 4,618,043 | 669,752 |
| Events in quadrant C | 4,394,477 | 654,253 |
| Events in quadrant D | 5,453,844 | 626,868 |
| Mode M9 | |||
|---|---|---|---|
| Quadrant | BADHDUFLAG | Total packets | Discarded packets |
| A | 0 | 20 | 0 |
| B | 0 | 20 | 0 |
| C | 0 | 20 | 0 |
| D | 0 | 20 | 0 |
| Mode M0 | |||
|---|---|---|---|
| Quadrant | BADHDUFLAG | Total packets | Discarded packets |
| A | 0 | 25420 | 3 |
| B | 0 | 20190 | 2 |
| C | 0 | 19769 | 2 |
| D | 0 | 23109 | 2 |
| Mode SS | |||
|---|---|---|---|
| Quadrant | BADHDUFLAG | Total packets | Discarded packets |
| A | 0 | 196 | 0 |
| B | 0 | 196 | 0 |
| C | 0 | 196 | 0 |
| D | 0 | 196 | 0 |
| Quadrant | Total seconds | Saturated seconds | Saturation percentage |
|---|---|---|---|
| A | 9708 | 130 | 1.339102% |
| B | 9708 | 65 | 0.669551% |
| C | 9708 | 33 | 0.339926% |
| D | 9708 | 204 | 2.101360% |
Noise dominated data is calculated using 1-second bins in cleaned event files. If a bin has >2000 counts, and if more than 50% of those come from <1% of pixels, then it is considered to be noise-dominated and hence unusable.
| Quadrant | # 1 sec bins | Bins with >0 counts | Bins with >2000 counts | High rate bins dominated by noise | Noise dominated (total time) | Noise dominated (detector-on time) | Marked lightcurve |
|---|---|---|---|---|---|---|---|
| A | 11643 | 9710 | 0 | 0 | 0.00% | 0.00% | 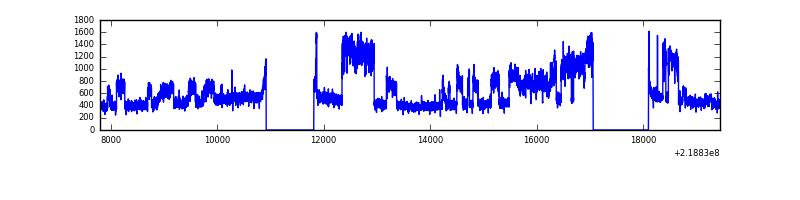 |
| B | 11643 | 9710 | 1 | 1 | 0.01% | 0.01% | 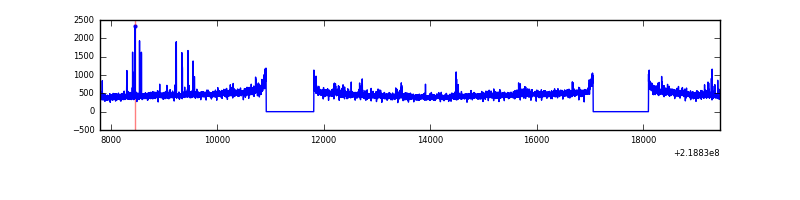 |
| C | 11643 | 9710 | 0 | 0 | 0.00% | 0.00% | 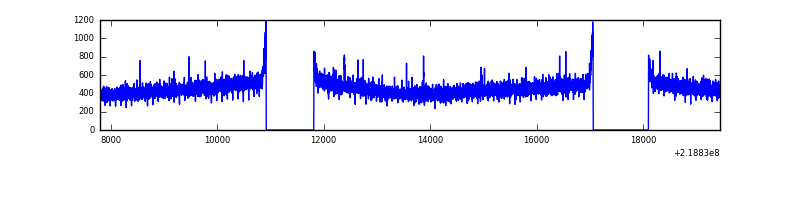 |
| D | 11643 | 9710 | 51 | 51 | 0.44% | 0.53% | 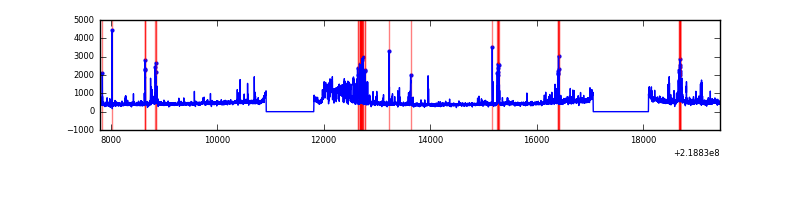 |
Top three noisy pixels from each quadrant. If the there are fewer than three noisy pixels in the level2.evt file, extra rows are filled as -1
| Pixel properties | Quadrant properties | ||||||
|---|---|---|---|---|---|---|---|
| Quadrant | DetID | PixID | Counts | Sigma | Mean | Median | Sigma |
| A | 15 | 236 | 1780231 | 7709.05 | 1136 | 1113 | 230.8 |
| A | 8 | 15 | 27218 | 113.11 | 1136 | 1113 | 230.8 |
| A | 10 | 133 | 14352 | 57.37 | 1136 | 1113 | 230.8 |
| B | 15 | 204 | 41412 | 181.42 | 1148 | 1121 | 222.1 |
| B | 0 | 219 | 26229 | 113.06 | 1148 | 1121 | 222.1 |
| B | 12 | 111 | 22965 | 98.36 | 1148 | 1121 | 222.1 |
| C | 1 | 16 | 46438 | 174.85 | 1111 | 1117 | 259.2 |
| C | 13 | 61 | 8729 | 29.37 | 1111 | 1117 | 259.2 |
| C | 12 | 4 | 8096 | 26.92 | 1111 | 1117 | 259.2 |
| D | 13 | 137 | 399136 | 1460.76 | 1107 | 1073 | 272.5 |
| D | 2 | 152 | 347932 | 1272.86 | 1107 | 1073 | 272.5 |
| D | 8 | 195 | 230728 | 842.76 | 1107 | 1073 | 272.5 |
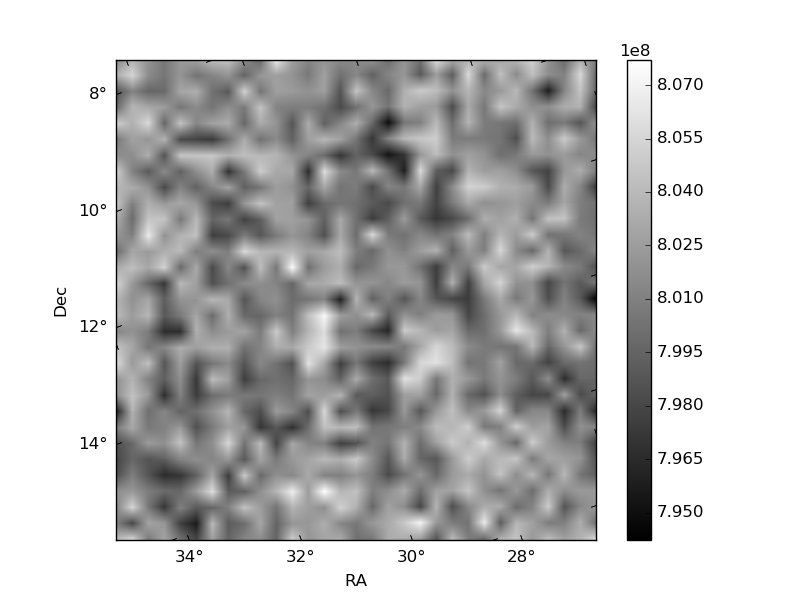
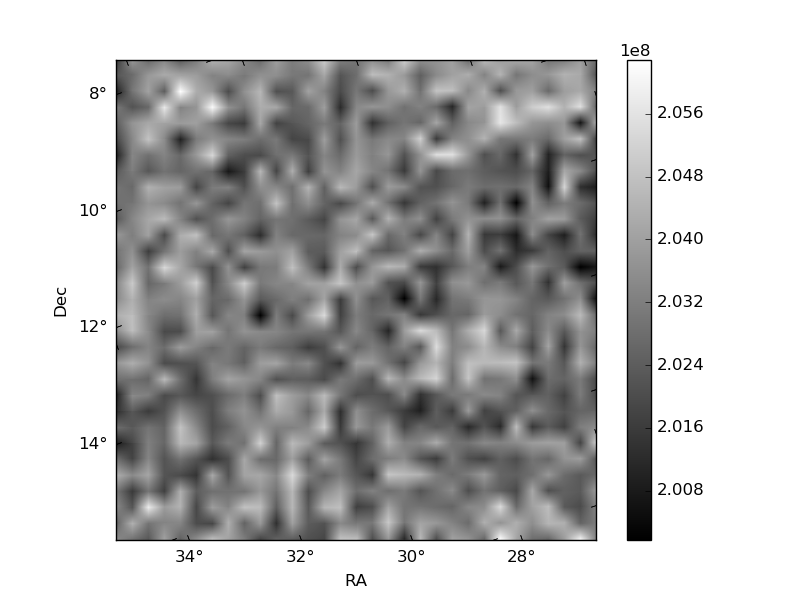
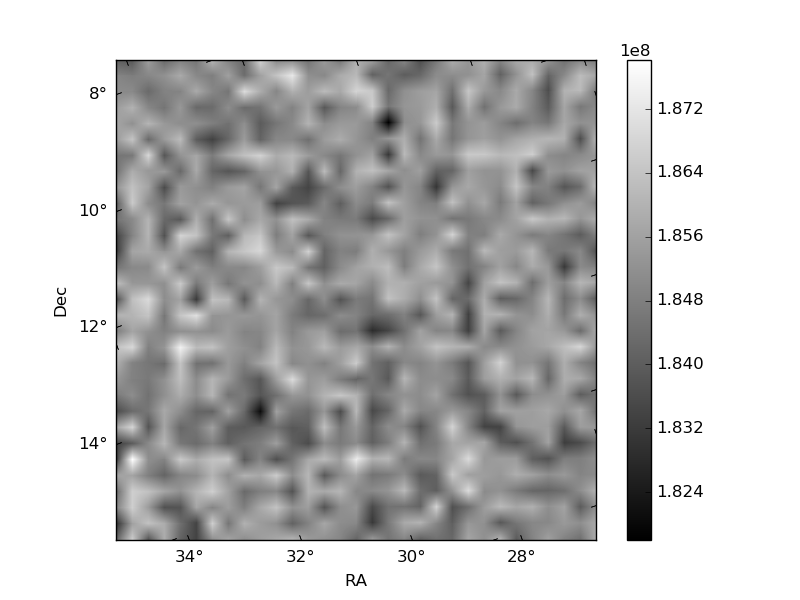
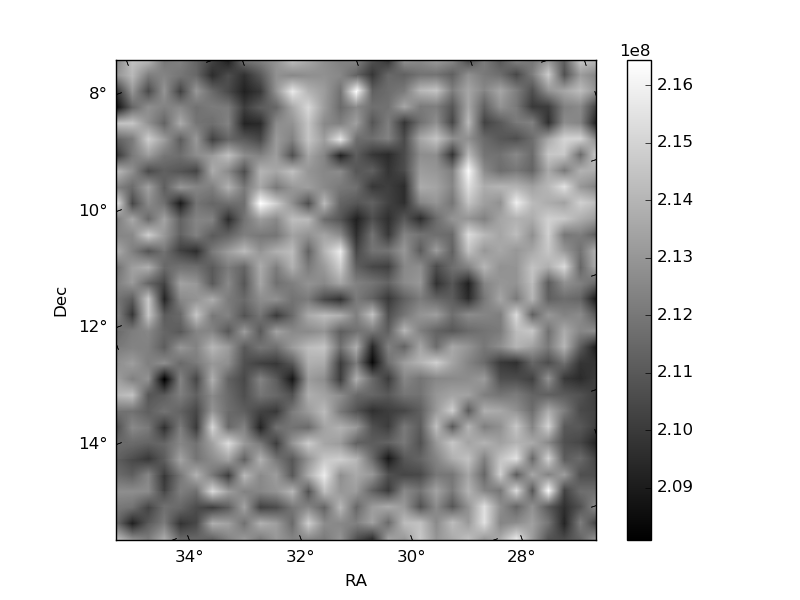
Histogram calculated using DETX and DETY for each event in the final _common_clean file
| Quadrant A | 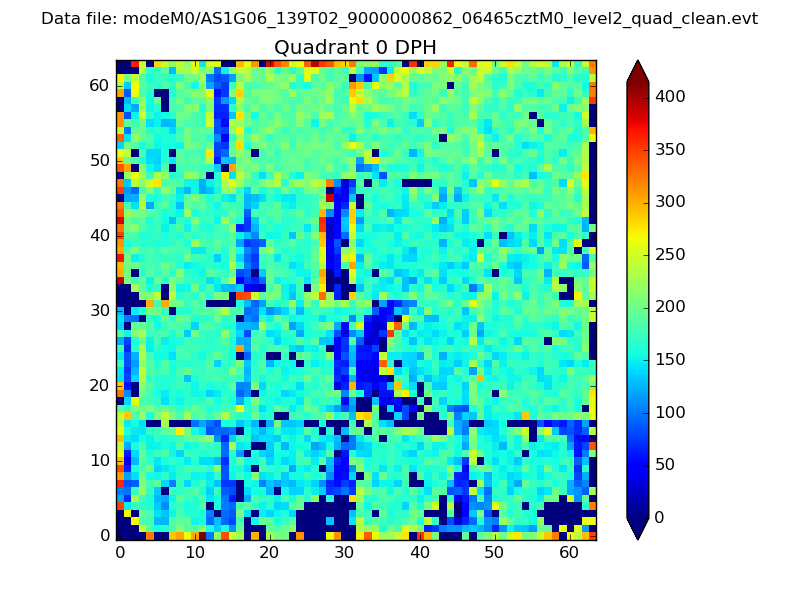 |
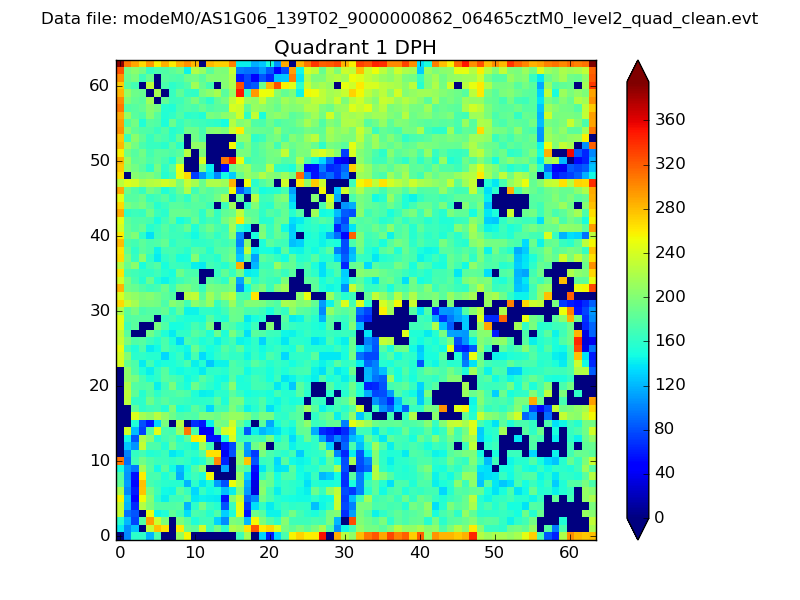 |
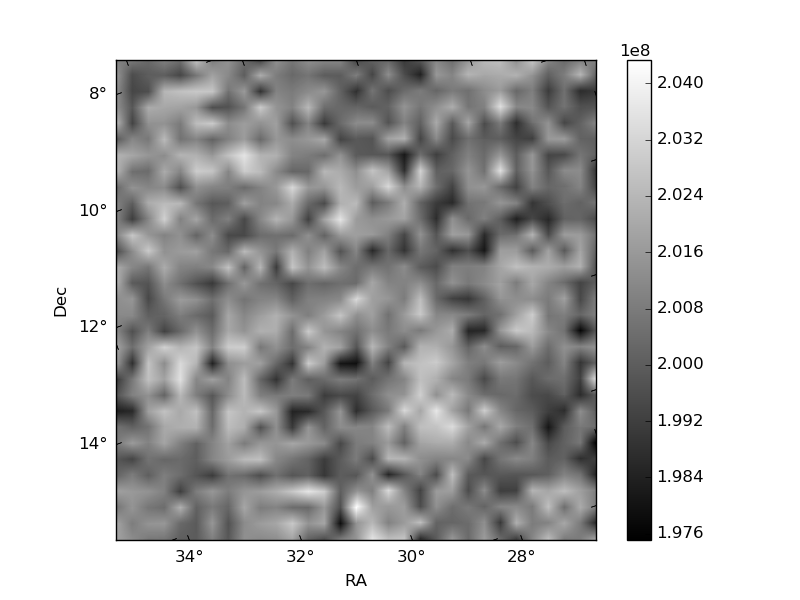
Quadrant B |
|---|---|---|---|
| Quadrant D | 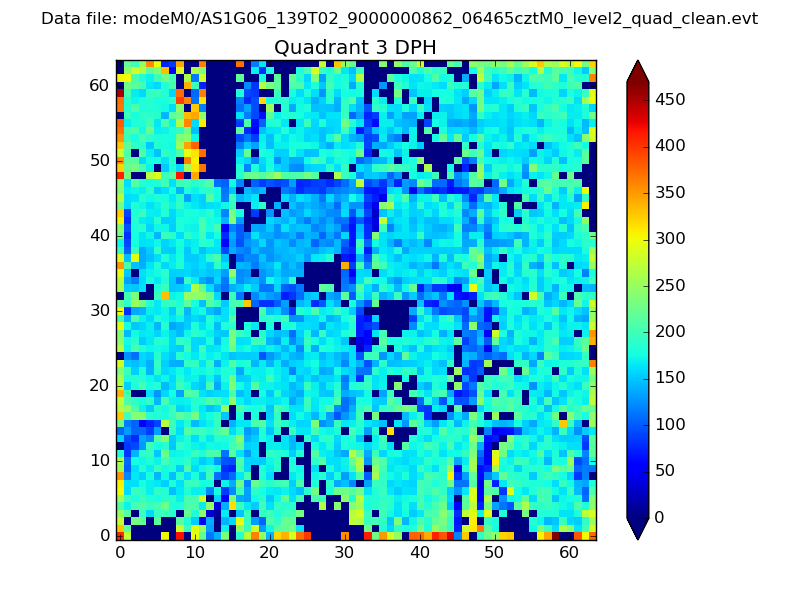 |
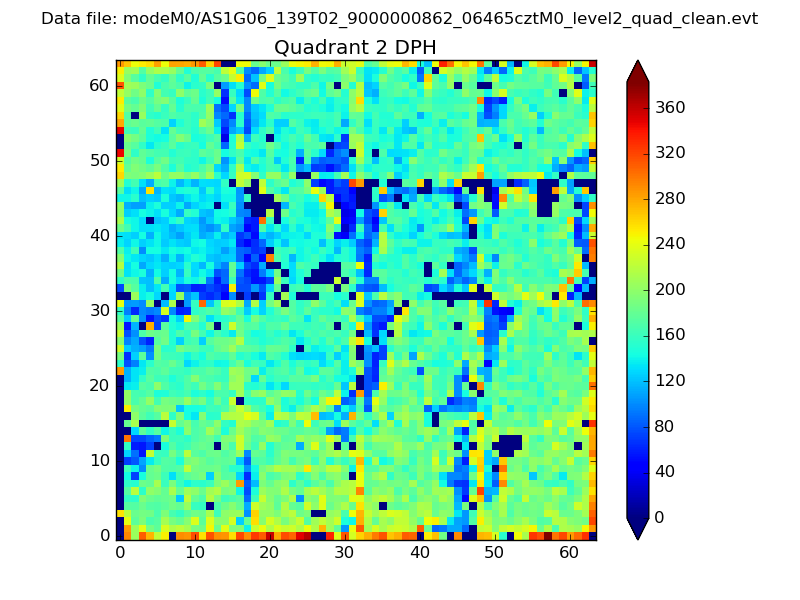 |
Quadrant C |
| Plot type | Count rate plots | Images |
|---|---|---|
| Comparison with Poisson distribution Blue bars denote a histogram of data divided into 1 sec bins. Red curve is a Poisson curve with rate = median count rate of data. |
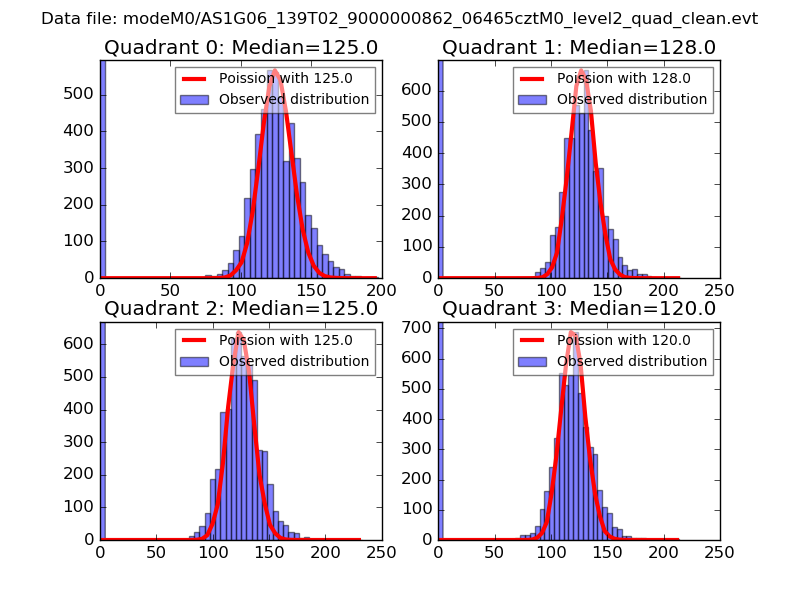 |
 |
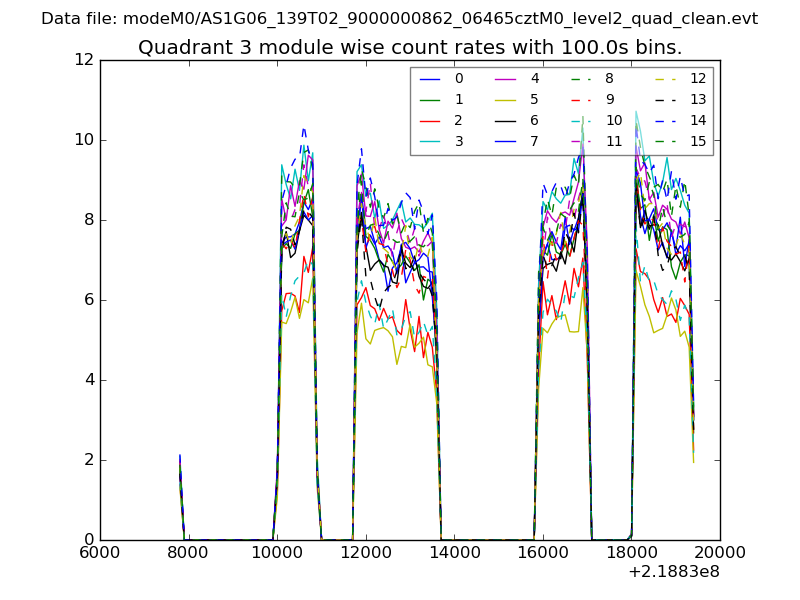
| Quadrant-wise count rates Data is divided into 100 sec bins |
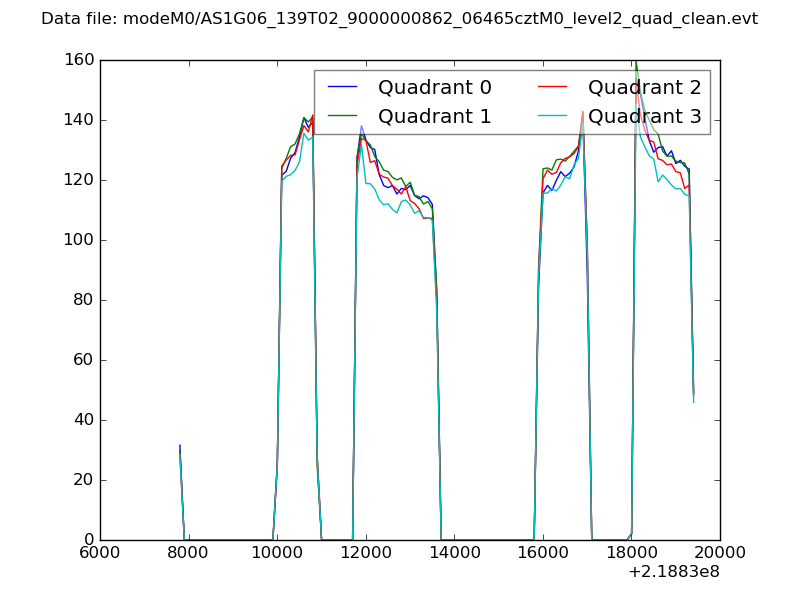 |
|
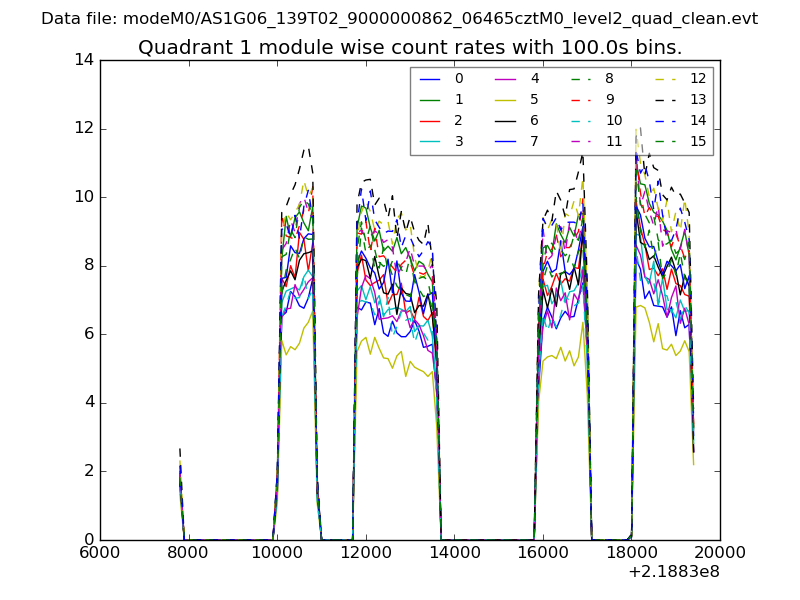
| Module-wise count rates for Quadrant A Data is divided into 100 sec bins |
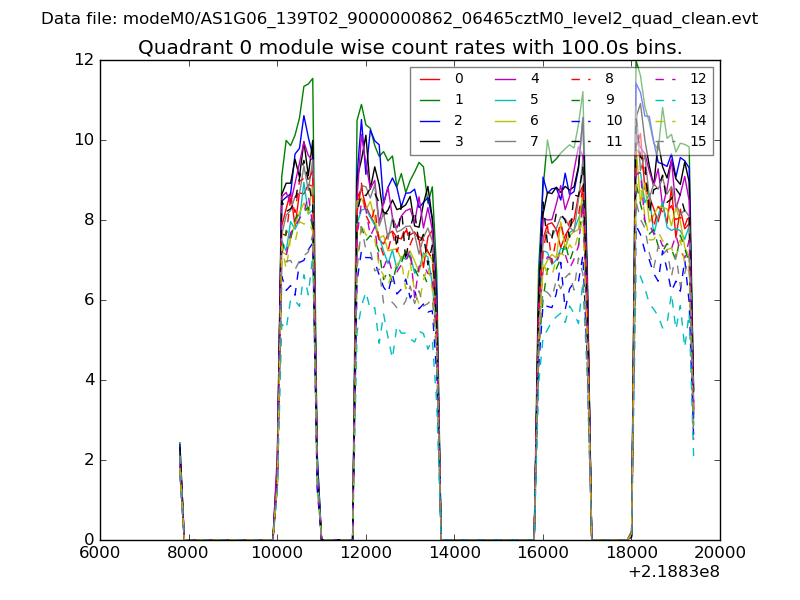 |
 |
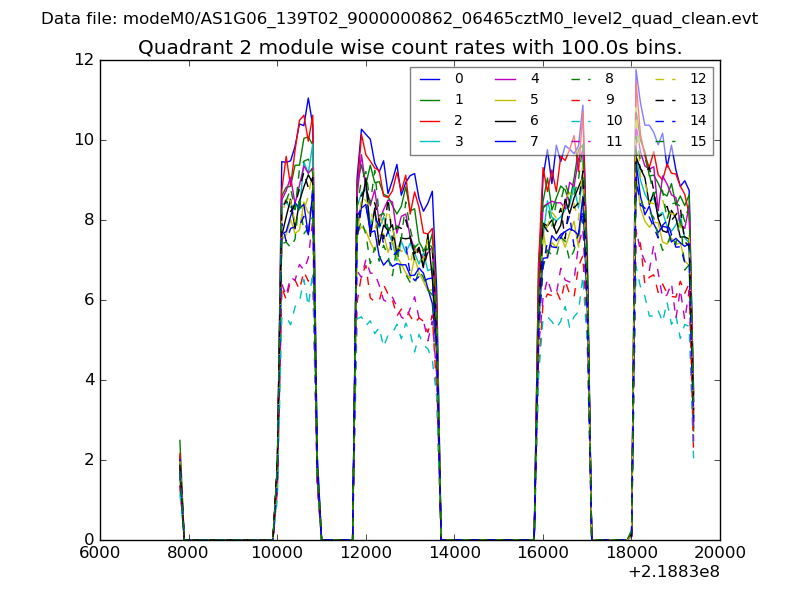
| Module-wise count rates for Quadrant B Data is divided into 100 sec bins |
 |
 |
| Module-wise count rates for Quadrant C Data is divided into 100 sec bins |
 |
 |
| Module-wise count rates for Quadrant D Data is divided into 100 sec bins |
 |
 |
| Parameter | Plot |
|---|---|
| CZT HV Monitor | 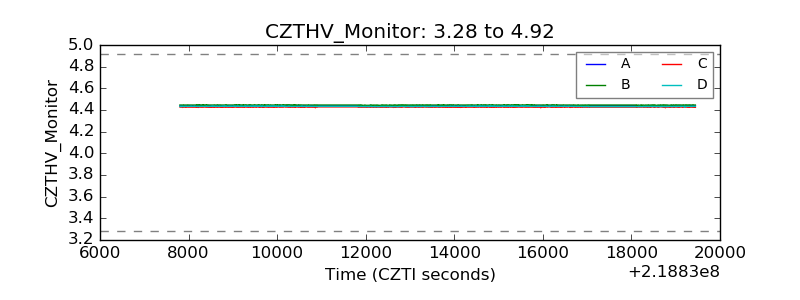 |
| D_VDD | 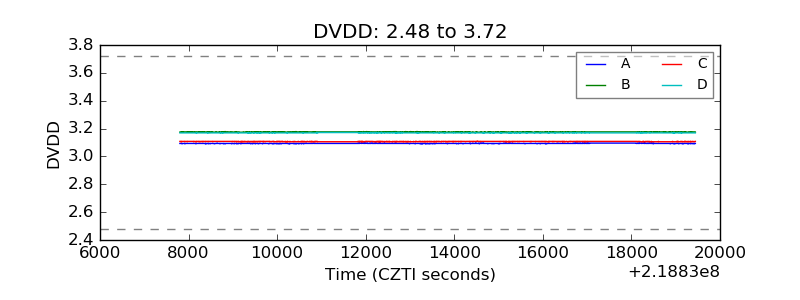 |
| Temperature 1 | 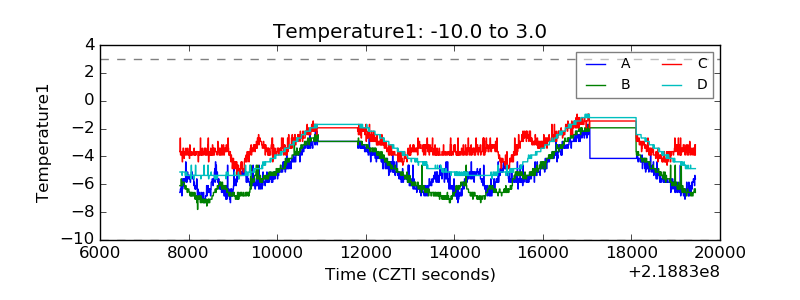 |
| Veto HV Monitor | 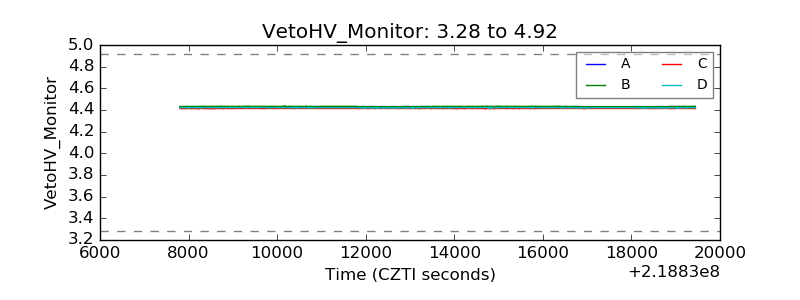 |
| Veto LLD | 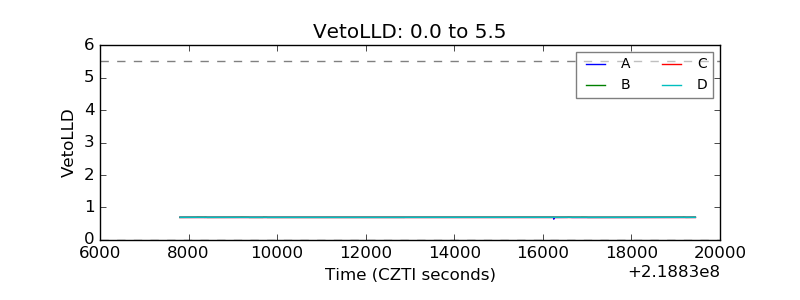 |
| Alpha Counter | 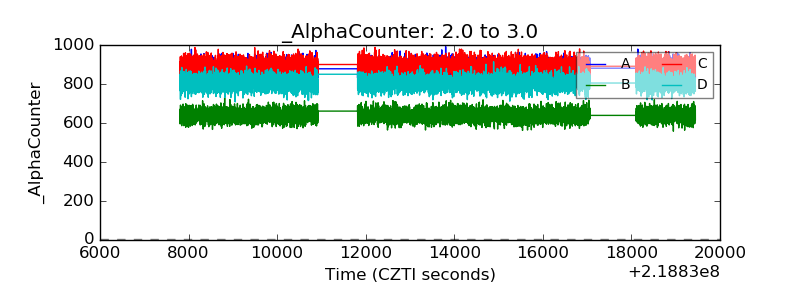 |
| _CPM_Rate | 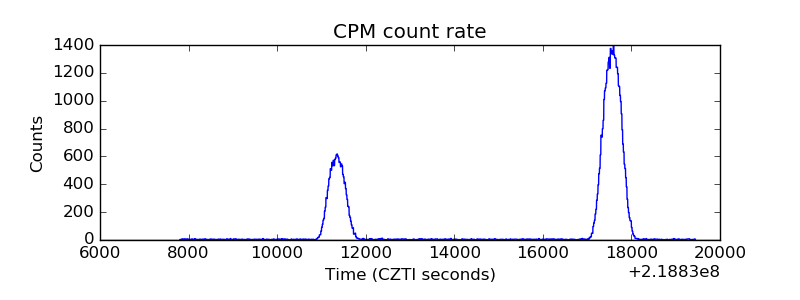 |
| CZT Counter | 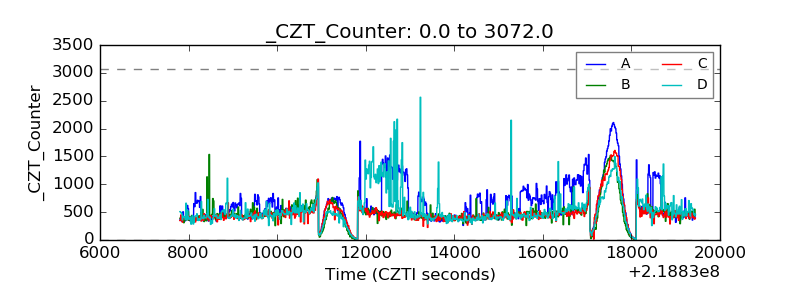 |
| +2.5 Volts monitor |  |
| +5 Volts monitor | 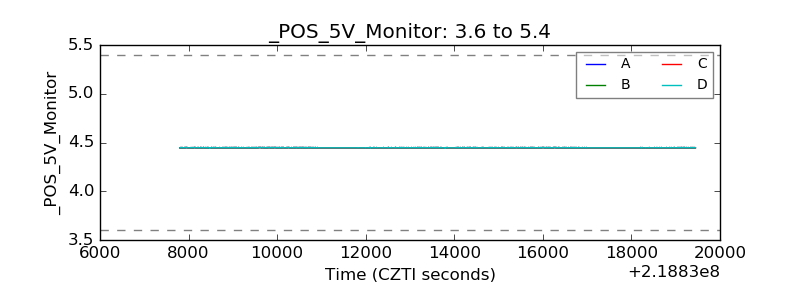 |
| _ROLL_ROT | 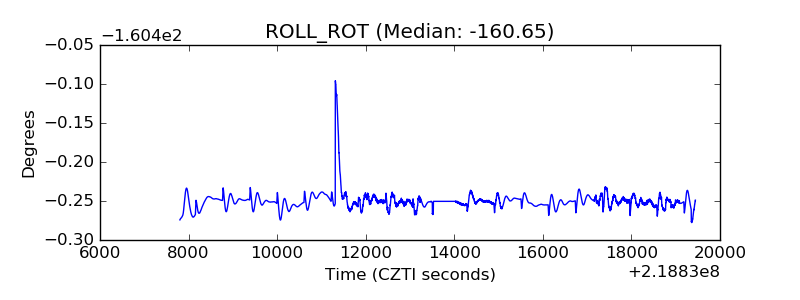 |
| _Roll_DEC | 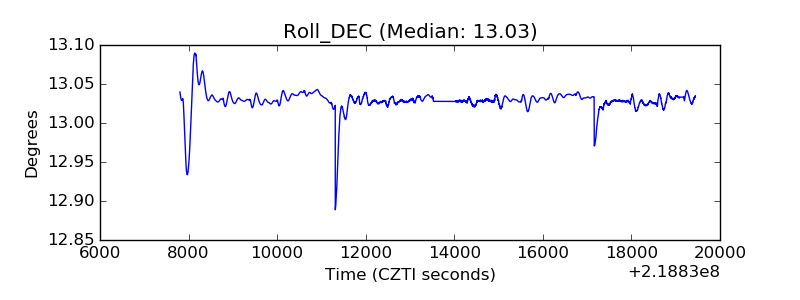 |
| _Roll_RA | 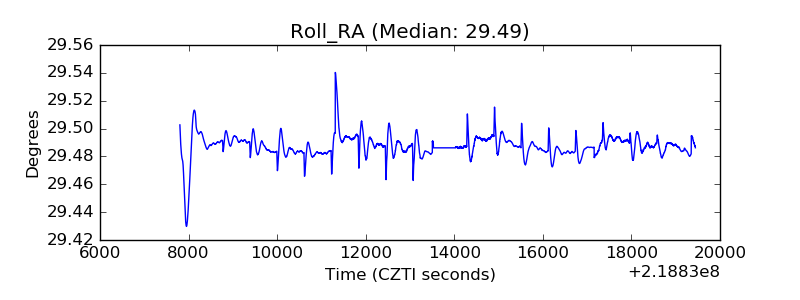 |
| Veto Counter | 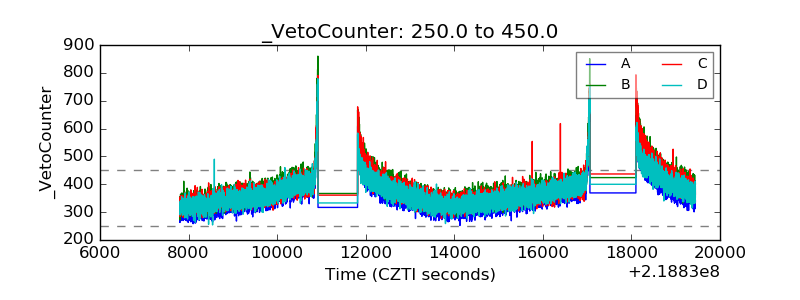 |