| Param | Original file | Final file |
|---|---|---|
| Filename | modeM0/AS1G06_139T02_9000000862_06469cztM0_level2.evt | modeM0/AS1G06_139T02_9000000862_06469cztM0_level2_quad_clean.evt |
| Size (bytes) | 466,058,880 | 67,429,440 |
| Size | 444.5 MB | 64.3 MB |
| Events in quadrant A | 3,612,544 | 401,553 |
| Events in quadrant B | 3,346,319 | 410,177 |
| Events in quadrant C | 3,415,834 | 396,409 |
| Events in quadrant D | 3,298,580 | 380,142 |
| Mode M9 | |||
|---|---|---|---|
| Quadrant | BADHDUFLAG | Total packets | Discarded packets |
| A | 0 | 21 | 0 |
| B | 0 | 21 | 0 |
| C | 0 | 21 | 0 |
| D | 0 | 22 | 0 |
| Mode M0 | |||
|---|---|---|---|
| Quadrant | BADHDUFLAG | Total packets | Discarded packets |
| A | 0 | 14832 | 3 |
| B | 0 | 13794 | 2 |
| C | 0 | 14348 | 2 |
| D | 0 | 13925 | 2 |
| Mode SS | |||
|---|---|---|---|
| Quadrant | BADHDUFLAG | Total packets | Discarded packets |
| A | 0 | 132 | 0 |
| B | 0 | 132 | 0 |
| C | 0 | 132 | 0 |
| D | 0 | 132 | 0 |
| Quadrant | Total seconds | Saturated seconds | Saturation percentage |
|---|---|---|---|
| A | 6499 | 57 | 0.877058% |
| B | 6499 | 66 | 1.015541% |
| C | 6499 | 52 | 0.800123% |
| D | 6499 | 58 | 0.892445% |
Noise dominated data is calculated using 1-second bins in cleaned event files. If a bin has >2000 counts, and if more than 50% of those come from <1% of pixels, then it is considered to be noise-dominated and hence unusable.
| Quadrant | # 1 sec bins | Bins with >0 counts | Bins with >2000 counts | High rate bins dominated by noise | Noise dominated (total time) | Noise dominated (detector-on time) | Marked lightcurve |
|---|---|---|---|---|---|---|---|
| A | 7814 | 6500 | 0 | 0 | 0.00% | 0.00% | 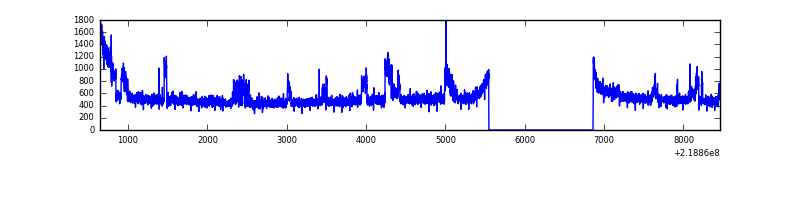 |
| B | 7814 | 6500 | 3 | 3 | 0.04% | 0.05% | 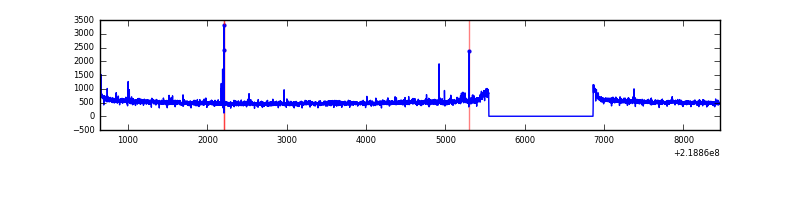 |
| C | 7814 | 6500 | 0 | 0 | 0.00% | 0.00% | 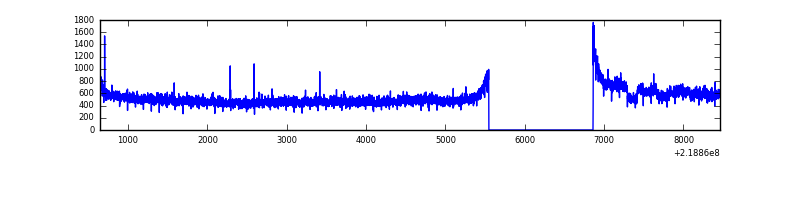 |
| D | 7814 | 6500 | 5 | 5 | 0.06% | 0.08% | 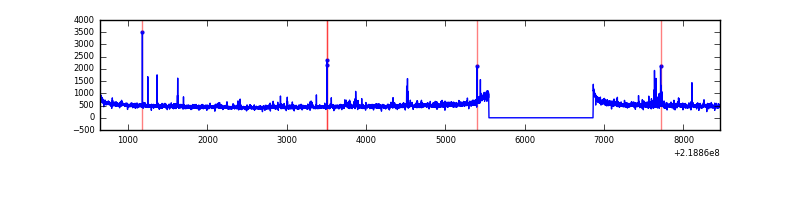 |
Top three noisy pixels from each quadrant. If the there are fewer than three noisy pixels in the level2.evt file, extra rows are filled as -1
| Pixel properties | Quadrant properties | ||||||
|---|---|---|---|---|---|---|---|
| Quadrant | DetID | PixID | Counts | Sigma | Mean | Median | Sigma |
| A | 15 | 236 | 393663 | 2366.82 | 828 | 812 | 166.0 |
| A | 8 | 15 | 22958 | 133.42 | 828 | 812 | 166.0 |
| A | 10 | 133 | 10803 | 60.19 | 828 | 812 | 166.0 |
| B | 15 | 204 | 40222 | 248.45 | 842 | 825 | 158.6 |
| B | 12 | 111 | 15734 | 94.02 | 842 | 825 | 158.6 |
| B | 11 | 111 | 12336 | 72.59 | 842 | 825 | 158.6 |
| C | 1 | 16 | 262246 | 1409.47 | 804 | 810 | 185.5 |
| C | 12 | 4 | 10996 | 54.92 | 804 | 810 | 185.5 |
| C | 13 | 61 | 6437 | 30.34 | 804 | 810 | 185.5 |
| D | 8 | 195 | 138299 | 696.55 | 801 | 775 | 197.4 |
| D | 2 | 152 | 73527 | 368.48 | 801 | 775 | 197.4 |
| D | 2 | 63 | 21227 | 103.59 | 801 | 775 | 197.4 |
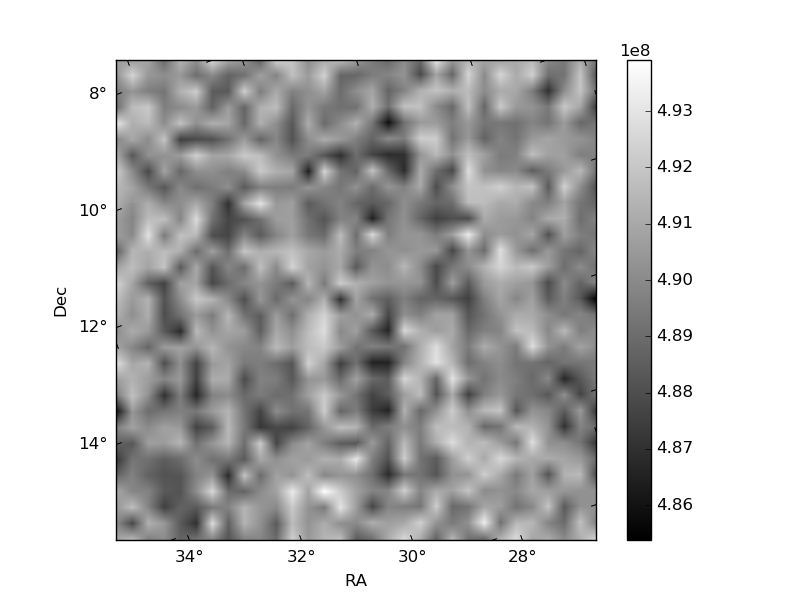
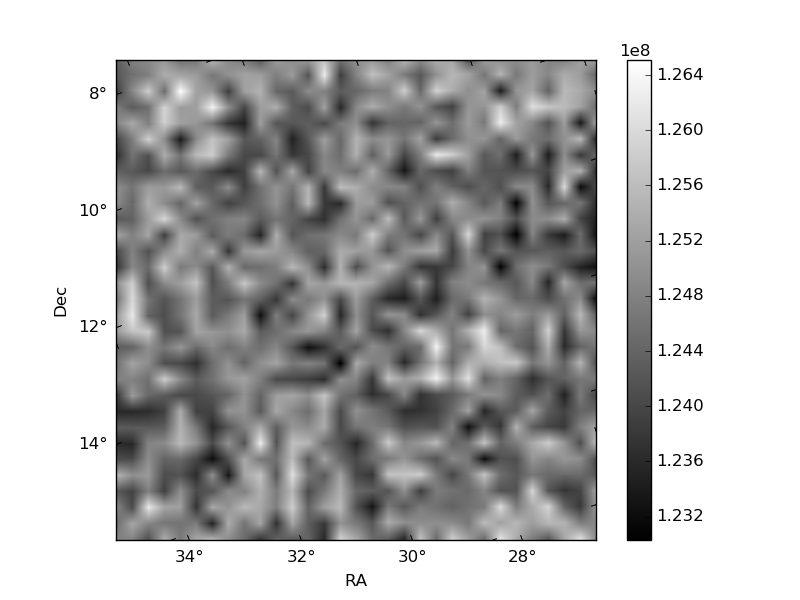
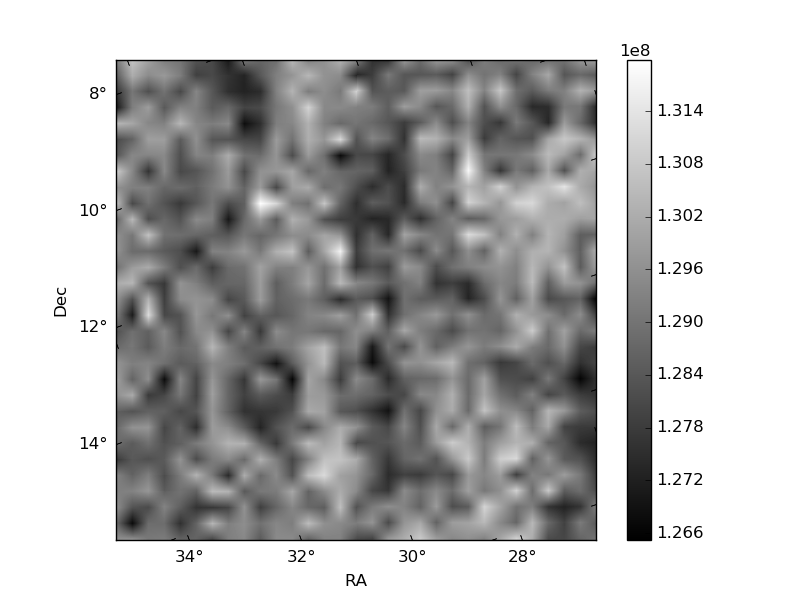
Histogram calculated using DETX and DETY for each event in the final _common_clean file
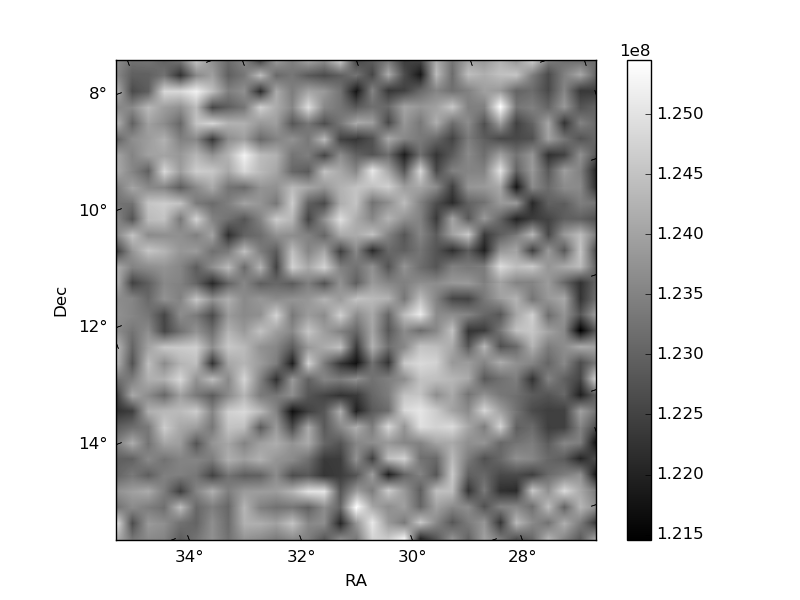
| Quadrant A | 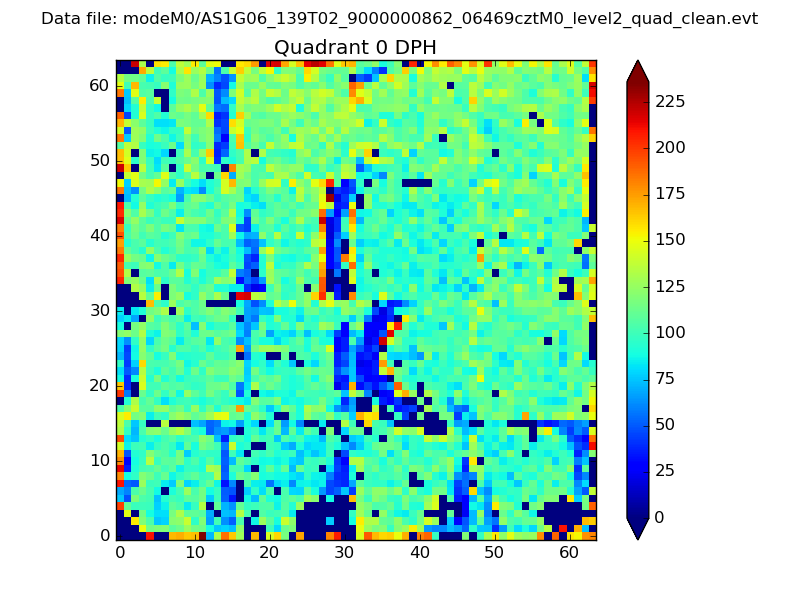 |
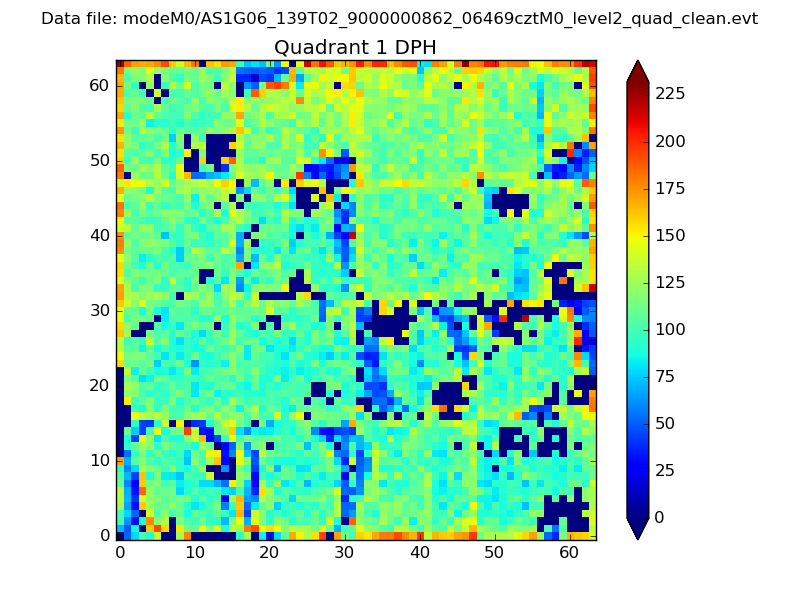 |
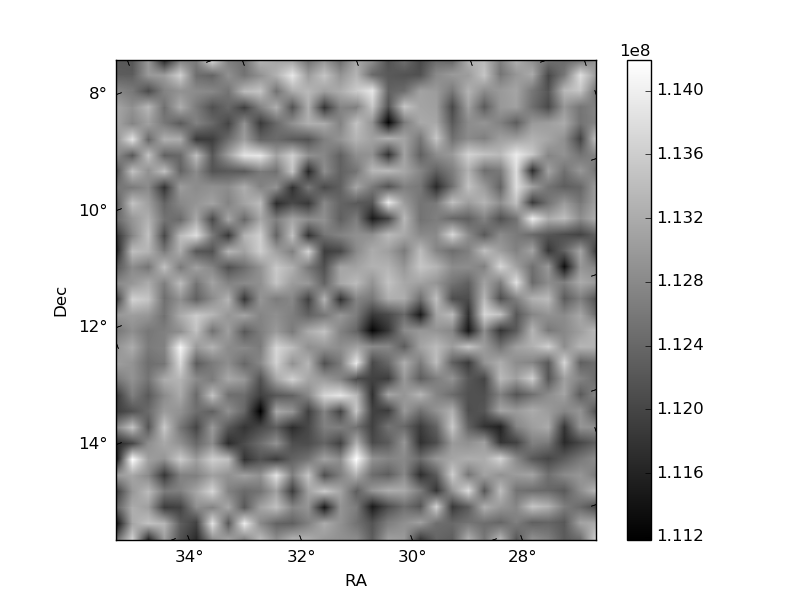
Quadrant B |
|---|---|---|---|
| Quadrant D | 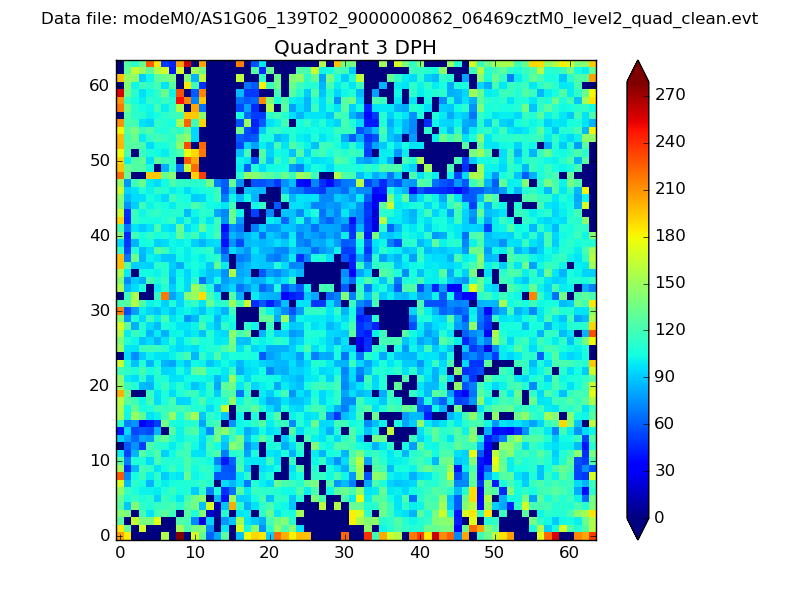 |
 |
Quadrant C |
| Plot type | Count rate plots | Images |
|---|---|---|
| Comparison with Poisson distribution Blue bars denote a histogram of data divided into 1 sec bins. Red curve is a Poisson curve with rate = median count rate of data. |
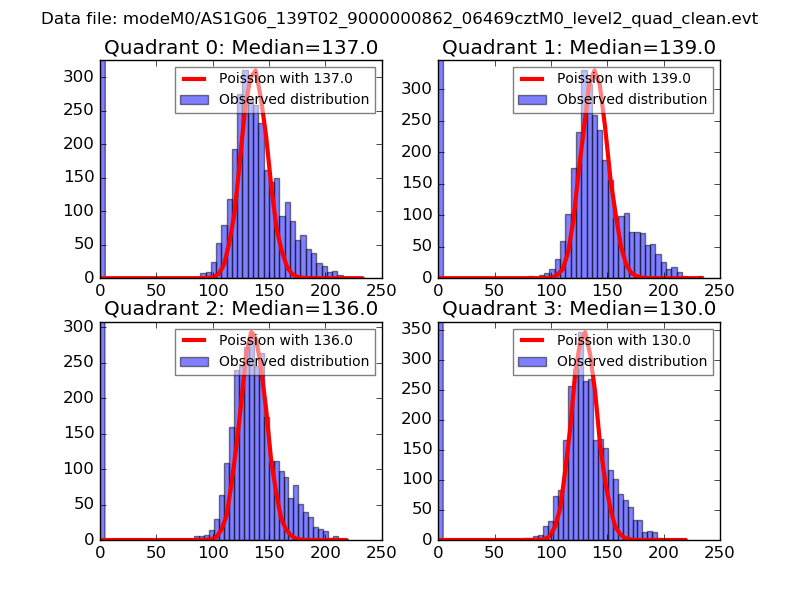 |
 |
| Quadrant-wise count rates Data is divided into 100 sec bins |
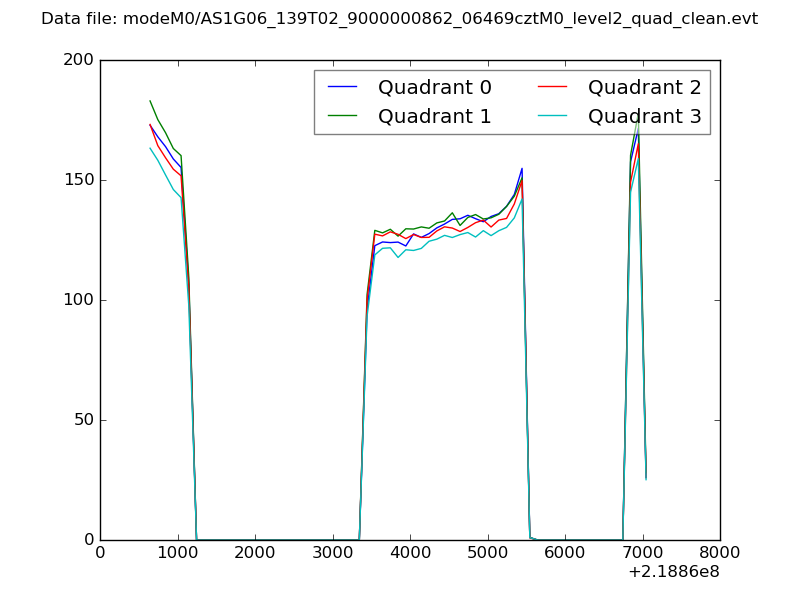 |
|
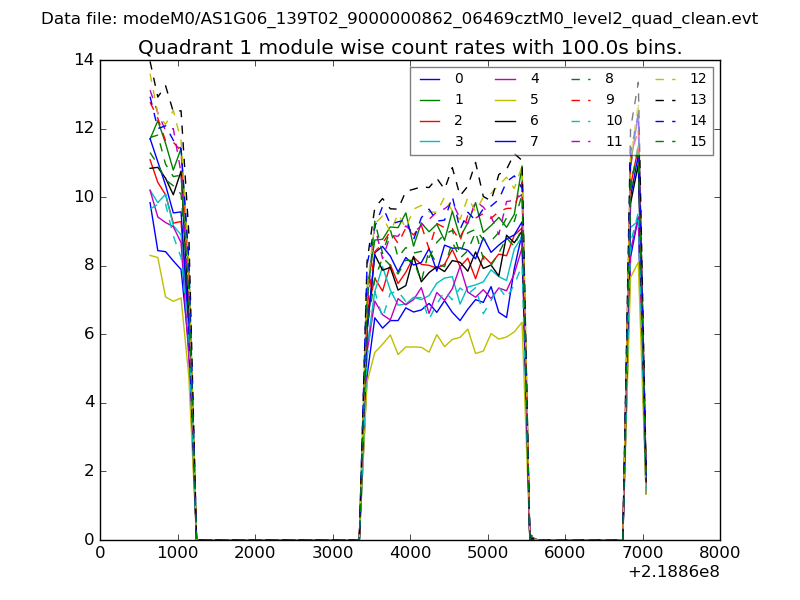
| Module-wise count rates for Quadrant A Data is divided into 100 sec bins |
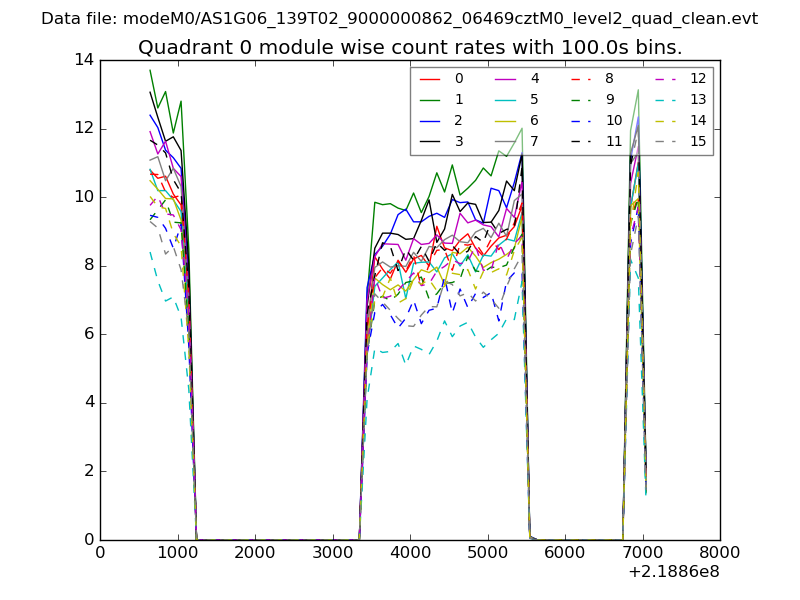 |
 |
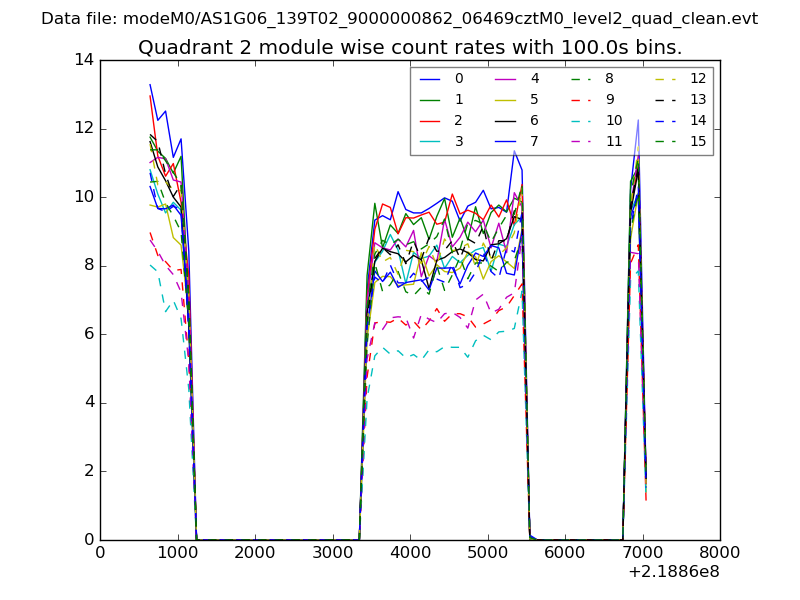
| Module-wise count rates for Quadrant B Data is divided into 100 sec bins |
 |
 |
| Module-wise count rates for Quadrant C Data is divided into 100 sec bins |
 |
 |
| Module-wise count rates for Quadrant D Data is divided into 100 sec bins |
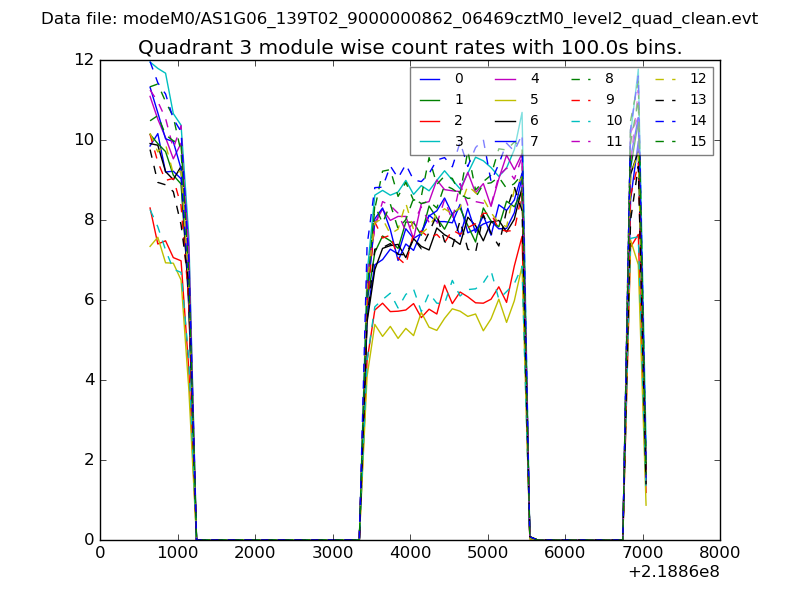 |
 |
| Parameter | Plot |
|---|---|
| CZT HV Monitor | 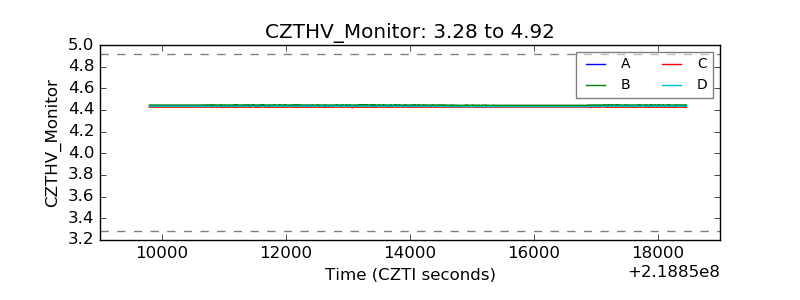 |
| D_VDD | 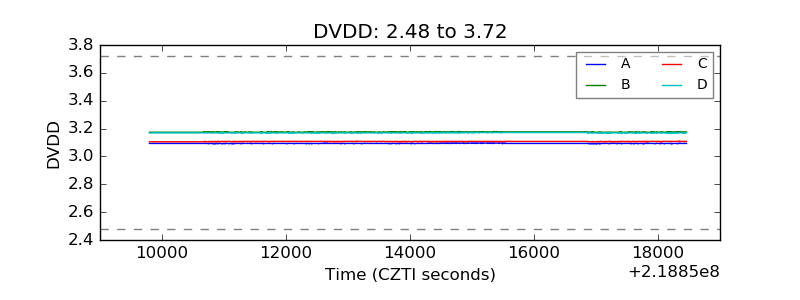 |
| Temperature 1 | 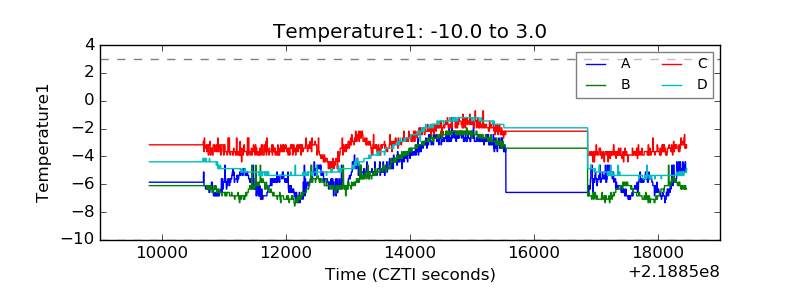 |
| Veto HV Monitor | 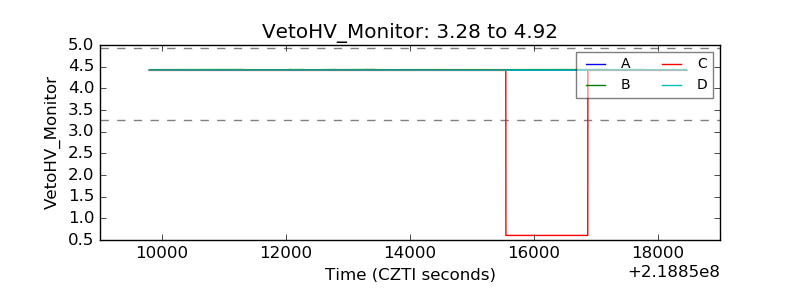 |
| Veto LLD |  |
| Alpha Counter | 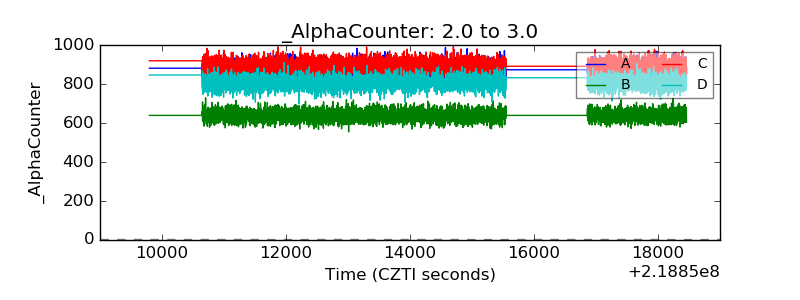 |
| _CPM_Rate | 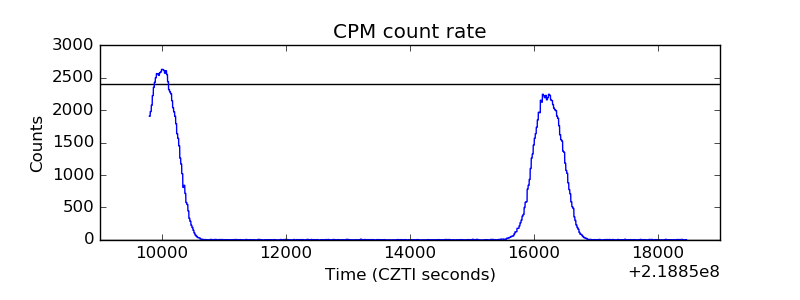 |
| CZT Counter | 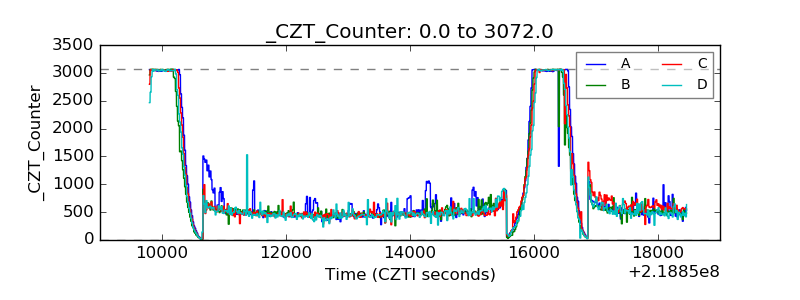 |
| +2.5 Volts monitor |  |
| +5 Volts monitor |  |
| _ROLL_ROT | 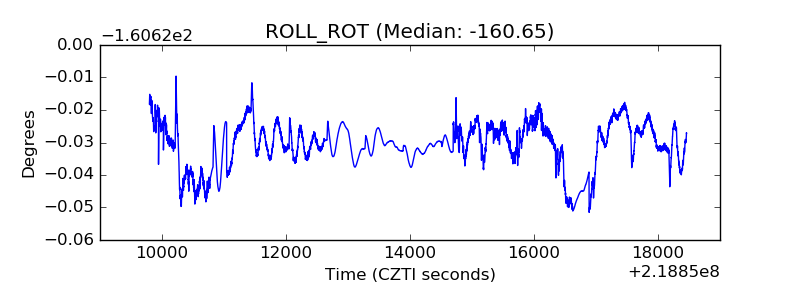 |
| _Roll_DEC | 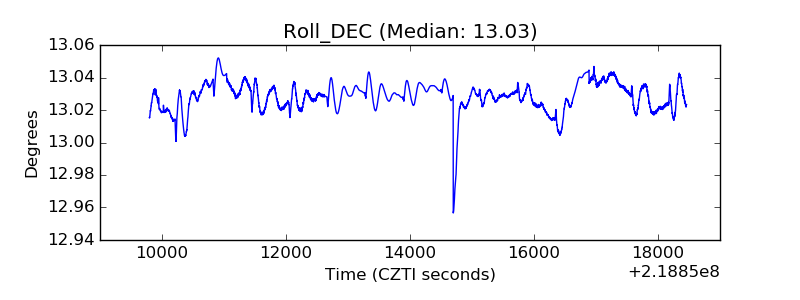 |
| _Roll_RA | 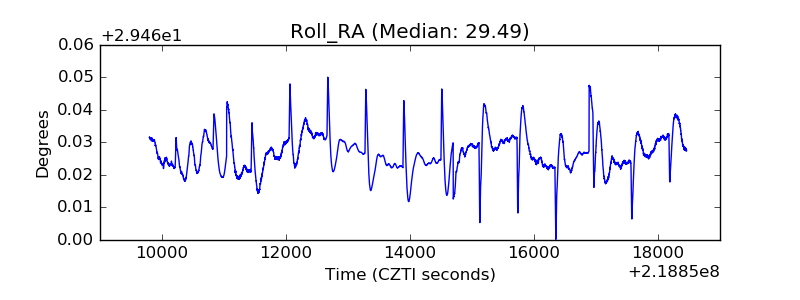 |
| Veto Counter | 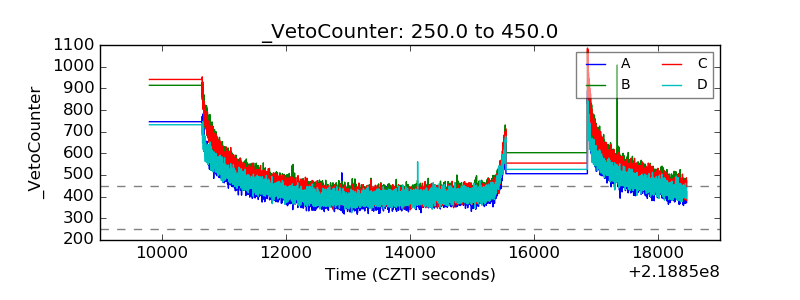 |