| Param | Original file | Final file |
|---|---|---|
| Filename | modeM0/AS1G06_139T02_9000000862_06470cztM0_level2.evt | modeM0/AS1G06_139T02_9000000862_06470cztM0_level2_quad_clean.evt |
| Size (bytes) | 454,328,640 | 61,099,200 |
| Size | 433.3 MB | 58.3 MB |
| Events in quadrant A | 3,292,958 | 356,835 |
| Events in quadrant B | 3,238,446 | 363,532 |
| Events in quadrant C | 3,387,421 | 352,849 |
| Events in quadrant D | 3,415,206 | 339,377 |
| Mode M9 | |||
|---|---|---|---|
| Quadrant | BADHDUFLAG | Total packets | Discarded packets |
| A | 0 | 17 | 0 |
| B | 0 | 17 | 0 |
| C | 0 | 17 | 0 |
| D | 0 | 18 | 0 |
| Mode M0 | |||
|---|---|---|---|
| Quadrant | BADHDUFLAG | Total packets | Discarded packets |
| A | 0 | 13615 | 3 |
| B | 0 | 13327 | 2 |
| C | 0 | 14062 | 2 |
| D | 0 | 14057 | 2 |
| Mode SS | |||
|---|---|---|---|
| Quadrant | BADHDUFLAG | Total packets | Discarded packets |
| A | 0 | 126 | 0 |
| B | 0 | 126 | 0 |
| C | 0 | 126 | 0 |
| D | 0 | 126 | 0 |
| Quadrant | Total seconds | Saturated seconds | Saturation percentage |
|---|---|---|---|
| A | 6269 | 58 | 0.925187% |
| B | 6269 | 42 | 0.669963% |
| C | 6269 | 33 | 0.526400% |
| D | 6269 | 45 | 0.717818% |
Noise dominated data is calculated using 1-second bins in cleaned event files. If a bin has >2000 counts, and if more than 50% of those come from <1% of pixels, then it is considered to be noise-dominated and hence unusable.
| Quadrant | # 1 sec bins | Bins with >0 counts | Bins with >2000 counts | High rate bins dominated by noise | Noise dominated (total time) | Noise dominated (detector-on time) | Marked lightcurve |
|---|---|---|---|---|---|---|---|
| A | 7629 | 6271 | 6 | 6 | 0.08% | 0.10% | 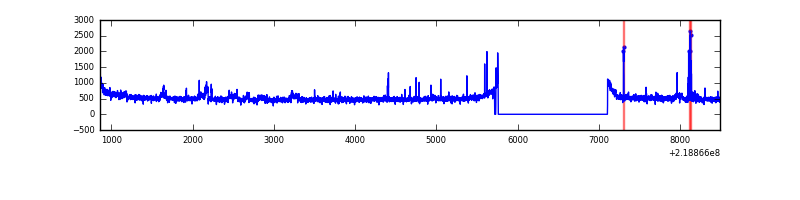 |
| B | 7629 | 6271 | 0 | 0 | 0.00% | 0.00% | 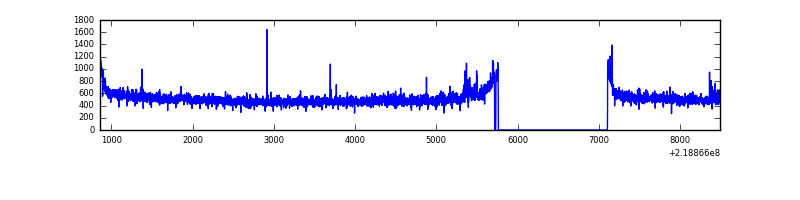 |
| C | 7629 | 6271 | 0 | 0 | 0.00% | 0.00% | 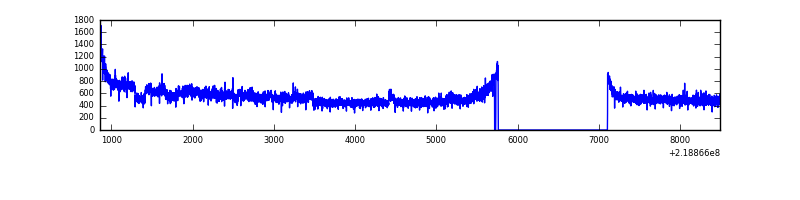 |
| D | 7629 | 6271 | 13 | 13 | 0.17% | 0.21% | 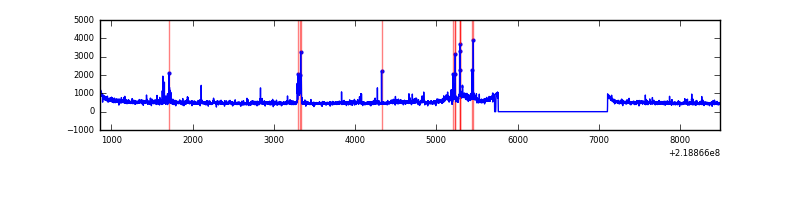 |
Top three noisy pixels from each quadrant. If the there are fewer than three noisy pixels in the level2.evt file, extra rows are filled as -1
| Pixel properties | Quadrant properties | ||||||
|---|---|---|---|---|---|---|---|
| Quadrant | DetID | PixID | Counts | Sigma | Mean | Median | Sigma |
| A | 15 | 236 | 128623 | 788.25 | 802 | 787 | 162.2 |
| A | 8 | 15 | 61927 | 377.0 | 802 | 787 | 162.2 |
| A | 10 | 133 | 10512 | 59.97 | 802 | 787 | 162.2 |
| B | 15 | 204 | 52926 | 341.27 | 814 | 798 | 152.7 |
| B | 12 | 111 | 15287 | 94.86 | 814 | 798 | 152.7 |
| B | 0 | 229 | 15165 | 94.06 | 814 | 798 | 152.7 |
| C | 1 | 16 | 350072 | 1937.89 | 777 | 782 | 180.2 |
| C | 13 | 61 | 6197 | 30.04 | 777 | 782 | 180.2 |
| C | 12 | 4 | 5934 | 28.58 | 777 | 782 | 180.2 |
| D | 8 | 195 | 194809 | 1019.22 | 774 | 750 | 190.4 |
| D | 10 | 15 | 85697 | 446.15 | 774 | 750 | 190.4 |
| D | 2 | 152 | 80661 | 419.7 | 774 | 750 | 190.4 |
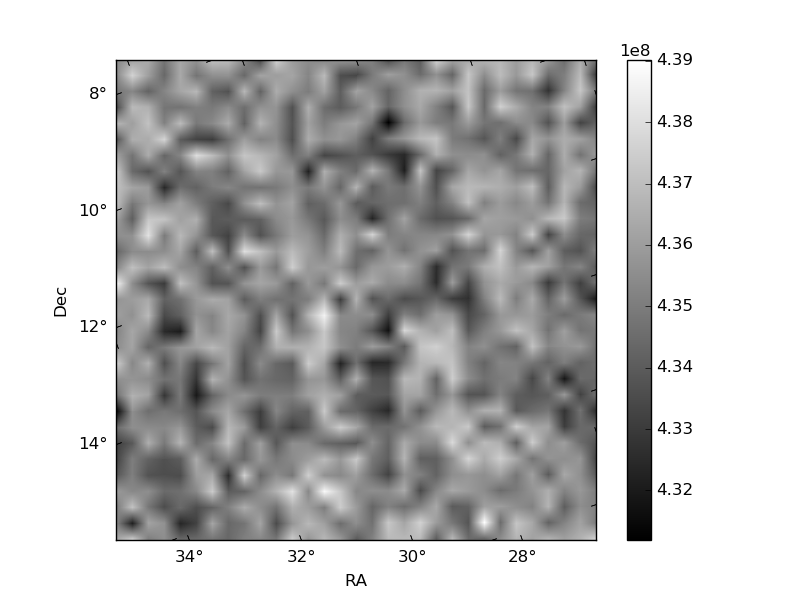
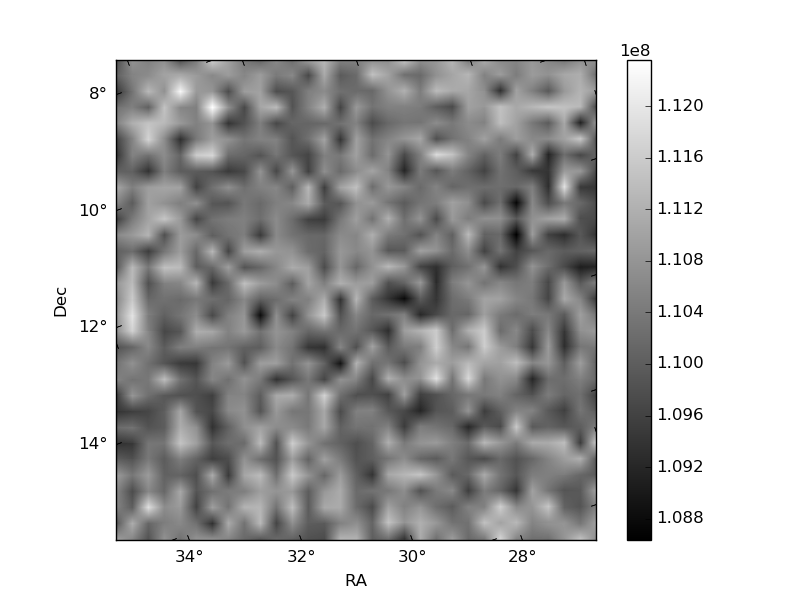
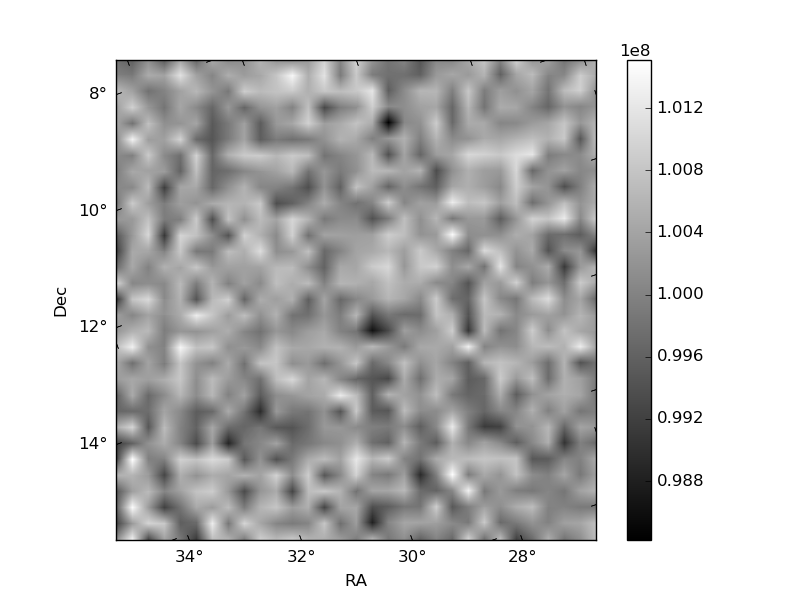
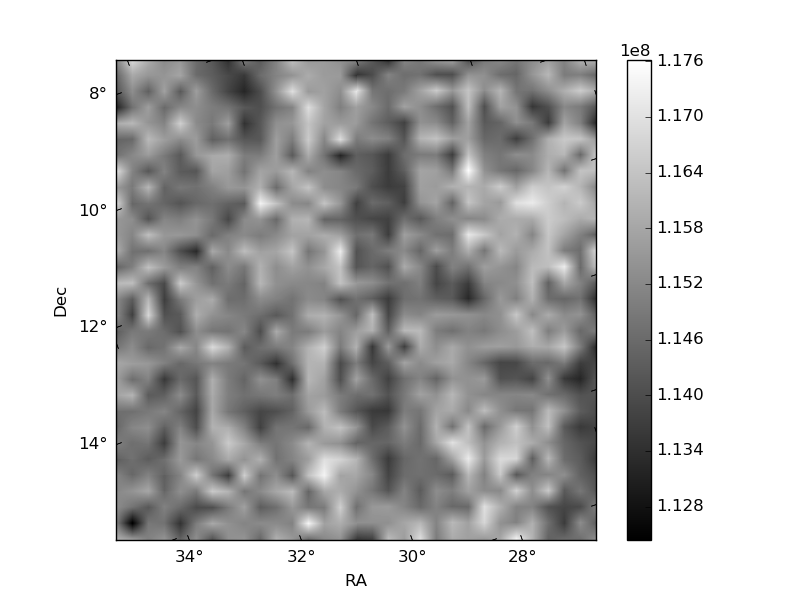
Histogram calculated using DETX and DETY for each event in the final _common_clean file
| Quadrant A | 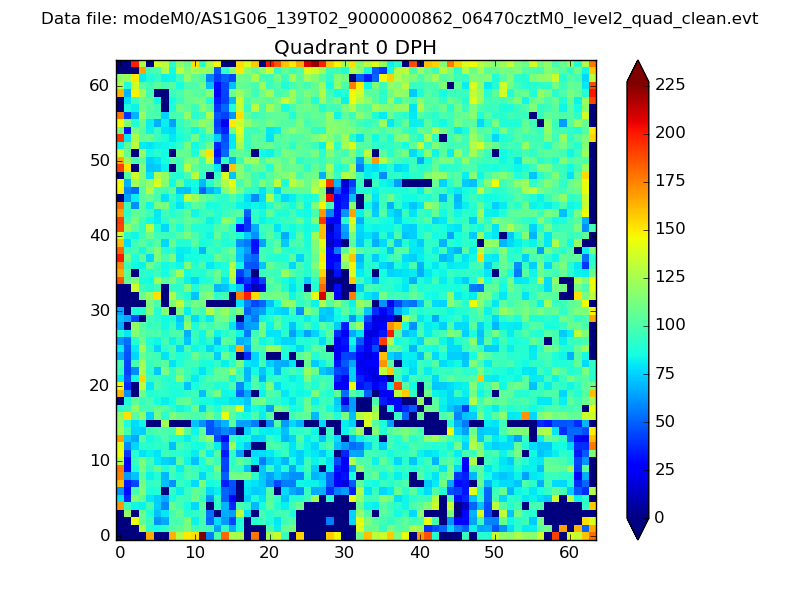 |
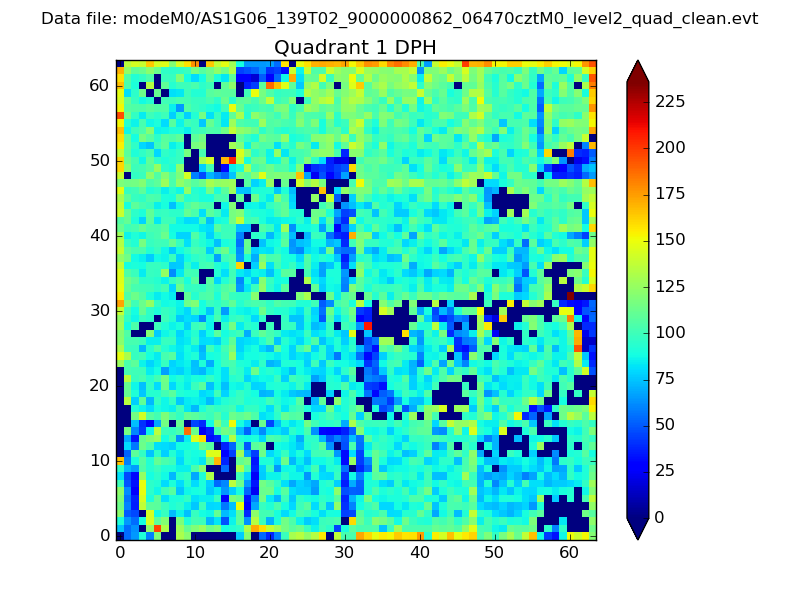 |
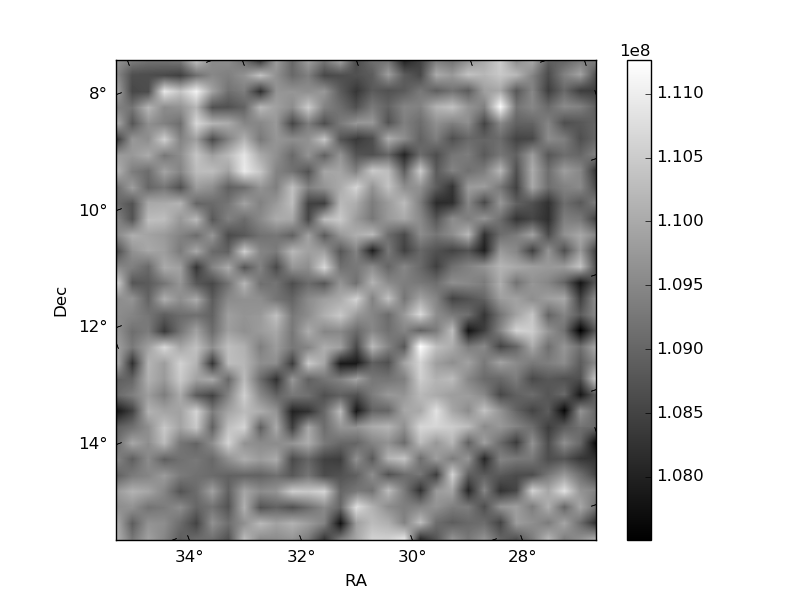
Quadrant B |
|---|---|---|---|
| Quadrant D | 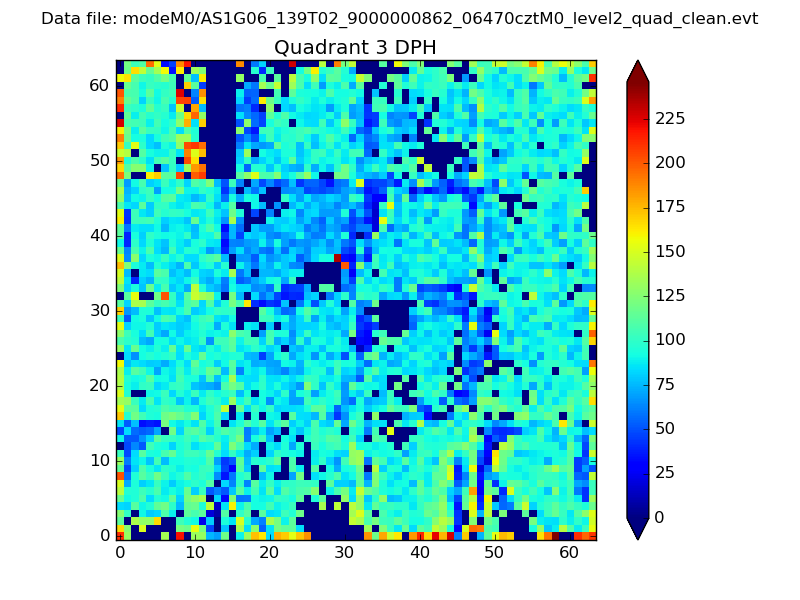 |
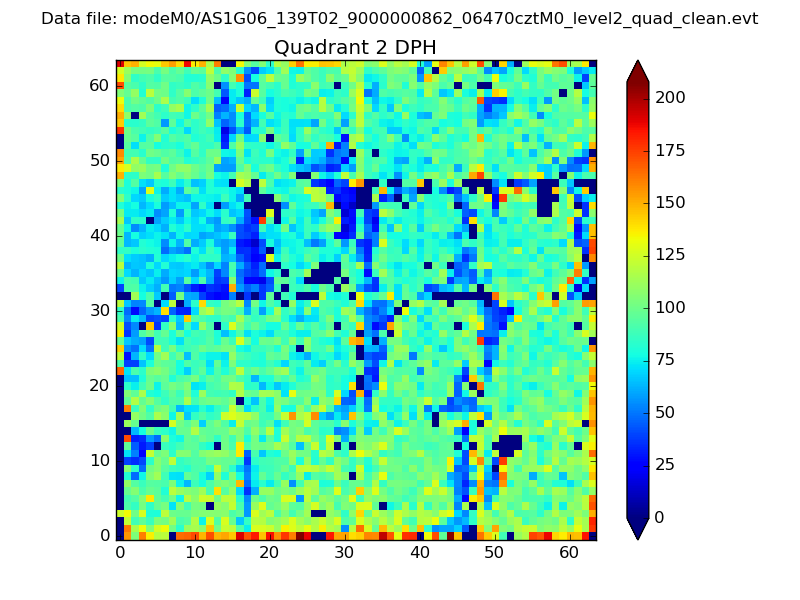 |
Quadrant C |
| Plot type | Count rate plots | Images |
|---|---|---|
| Comparison with Poisson distribution Blue bars denote a histogram of data divided into 1 sec bins. Red curve is a Poisson curve with rate = median count rate of data. |
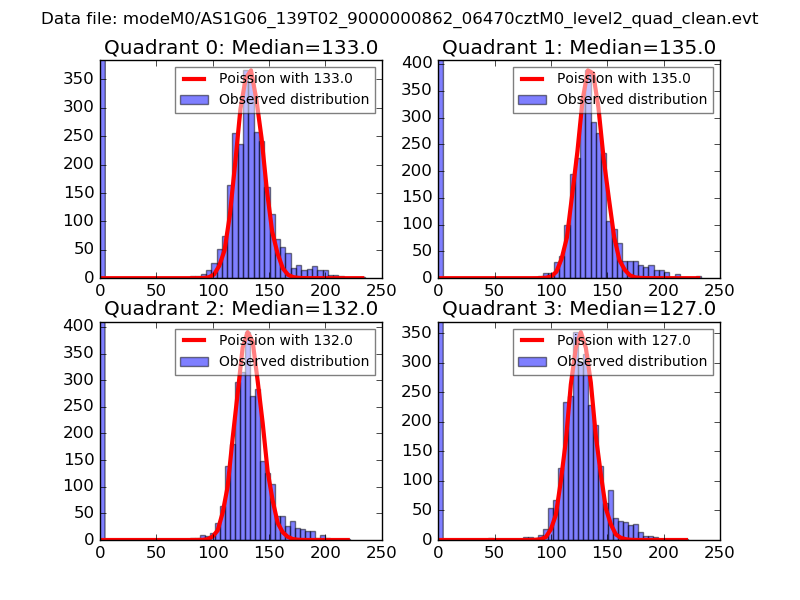 |
 |
| Quadrant-wise count rates Data is divided into 100 sec bins |
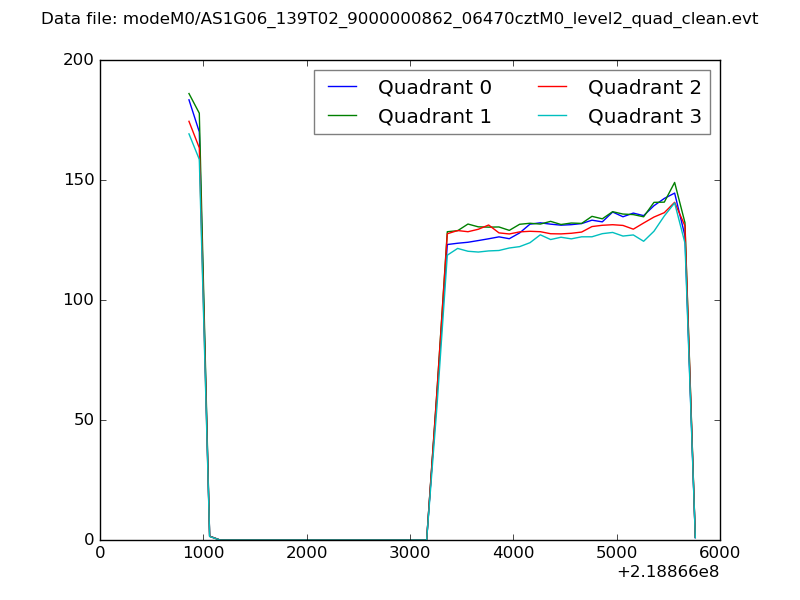 |
|
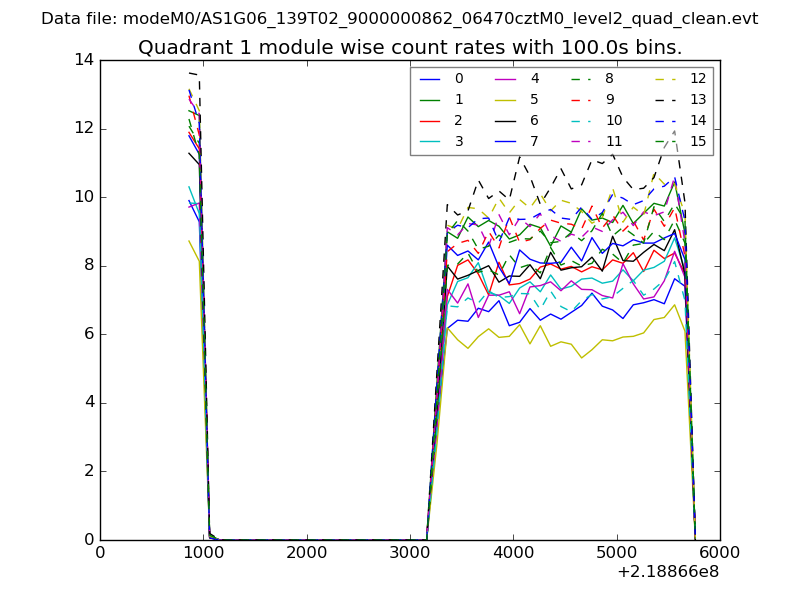
| Module-wise count rates for Quadrant A Data is divided into 100 sec bins |
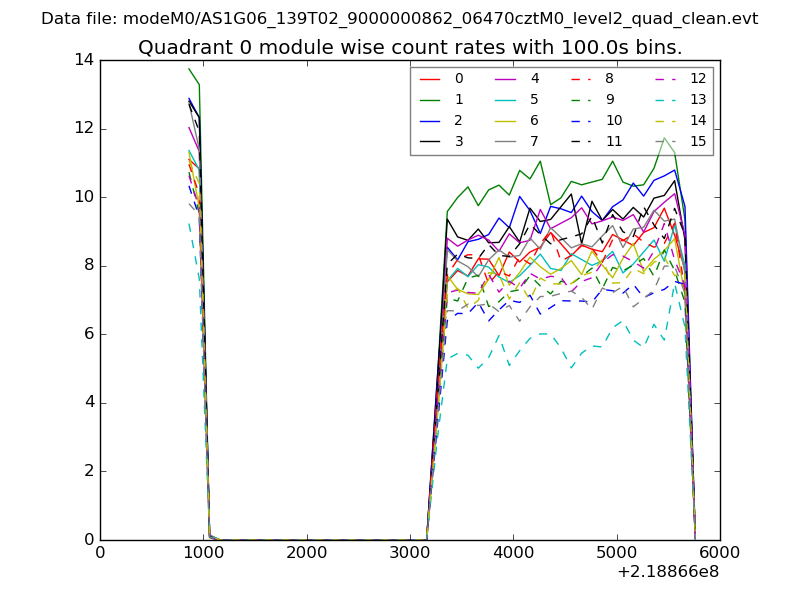 |
 |
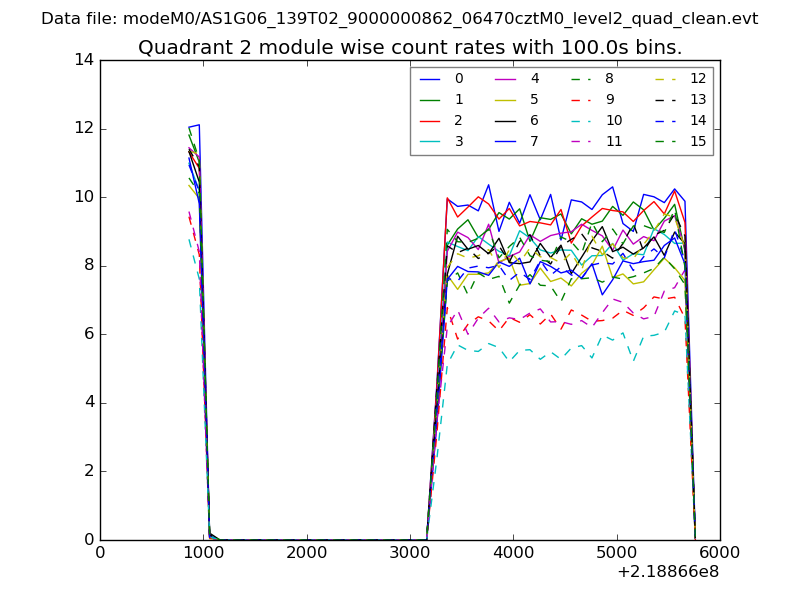
| Module-wise count rates for Quadrant B Data is divided into 100 sec bins |
 |
 |
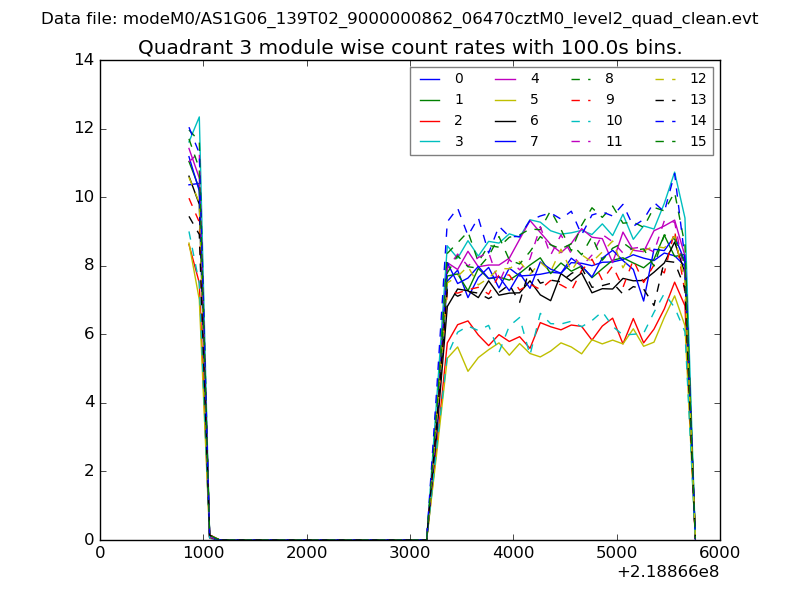
| Module-wise count rates for Quadrant C Data is divided into 100 sec bins |
 |
 |
| Module-wise count rates for Quadrant D Data is divided into 100 sec bins |
 |
 |
| Parameter | Plot |
|---|---|
| CZT HV Monitor | 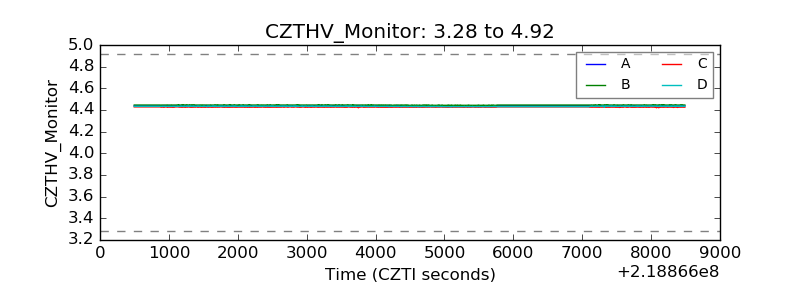 |
| D_VDD | 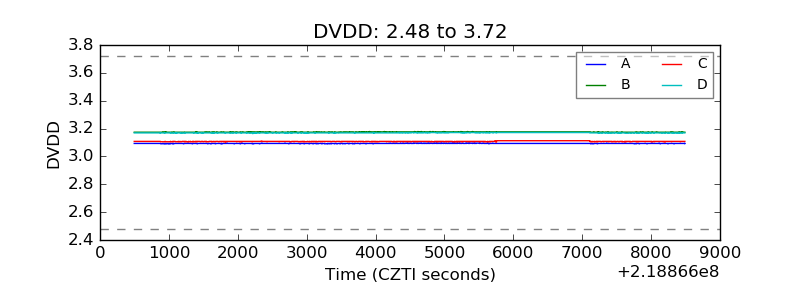 |
| Temperature 1 | 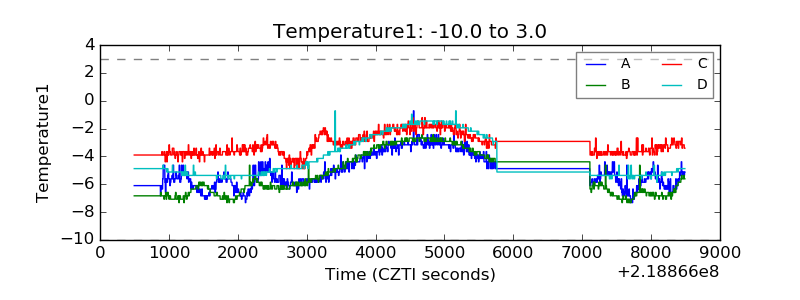 |
| Veto HV Monitor |  |
| Veto LLD | 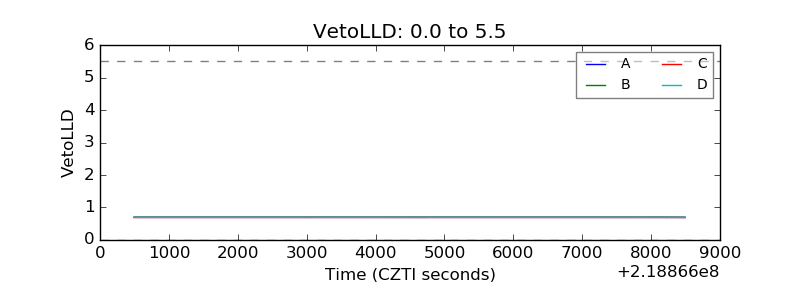 |
| Alpha Counter | 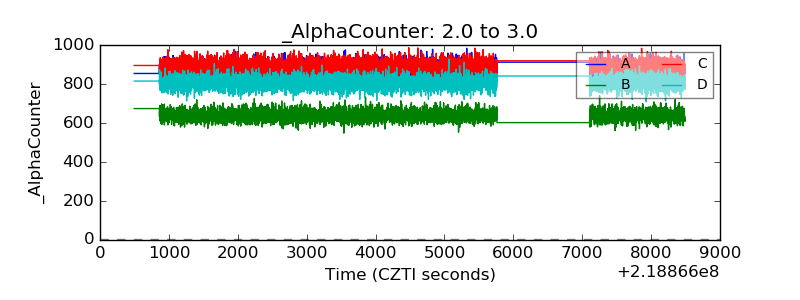 |
| _CPM_Rate | 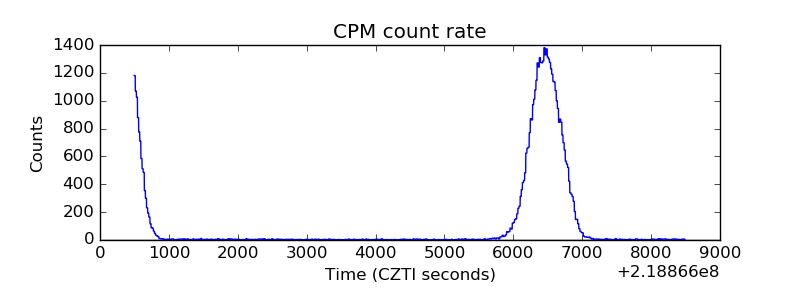 |
| CZT Counter | 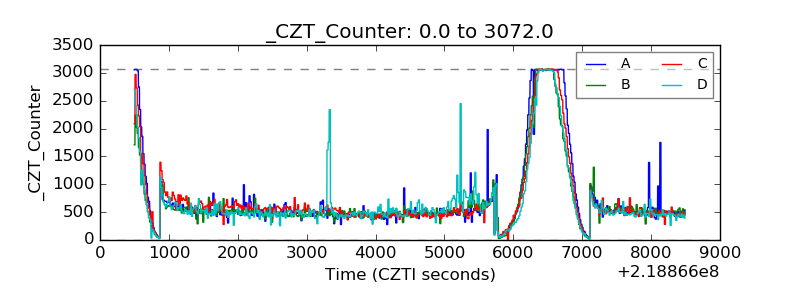 |
| +2.5 Volts monitor |  |
| +5 Volts monitor |  |
| _ROLL_ROT | 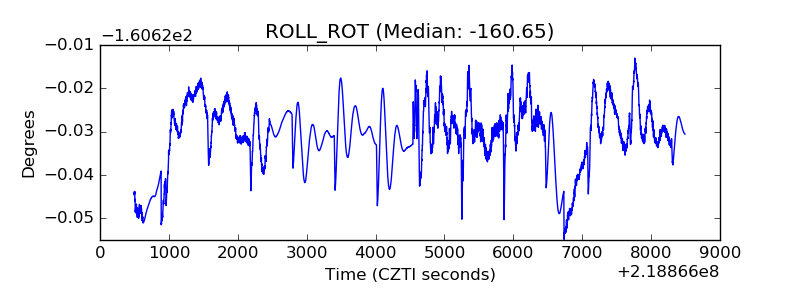 |
| _Roll_DEC | 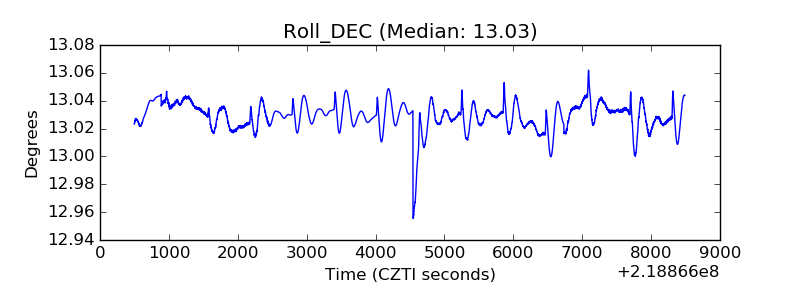 |
| _Roll_RA | 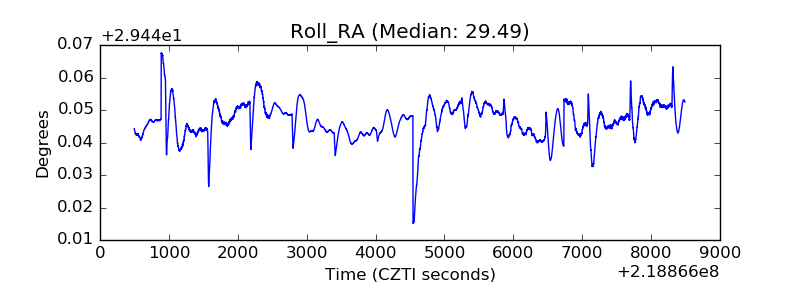 |
| Veto Counter | 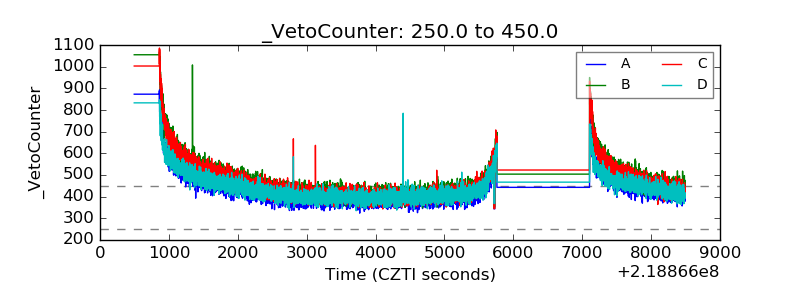 |