| Param | Original file | Final file |
|---|---|---|
| Filename | modeM0/AS1G06_139T02_9000000862_06471cztM0_level2.evt | modeM0/AS1G06_139T02_9000000862_06471cztM0_level2_quad_clean.evt |
| Size (bytes) | 443,347,200 | 66,683,520 |
| Size | 422.8 MB | 63.6 MB |
| Events in quadrant A | 3,357,035 | 398,288 |
| Events in quadrant B | 3,316,464 | 400,076 |
| Events in quadrant C | 3,110,676 | 393,257 |
| Events in quadrant D | 3,205,724 | 379,169 |
| Mode M9 | |||
|---|---|---|---|
| Quadrant | BADHDUFLAG | Total packets | Discarded packets |
| A | 0 | 26 | 0 |
| B | 0 | 26 | 0 |
| C | 0 | 26 | 0 |
| D | 0 | 26 | 0 |
| Mode M0 | |||
|---|---|---|---|
| Quadrant | BADHDUFLAG | Total packets | Discarded packets |
| A | 0 | 14170 | 3 |
| B | 0 | 13738 | 2 |
| C | 0 | 13460 | 2 |
| D | 0 | 13839 | 2 |
| Mode SS | |||
|---|---|---|---|
| Quadrant | BADHDUFLAG | Total packets | Discarded packets |
| A | 0 | 130 | 0 |
| B | 0 | 130 | 0 |
| C | 0 | 130 | 0 |
| D | 0 | 130 | 0 |
| Quadrant | Total seconds | Saturated seconds | Saturation percentage |
|---|---|---|---|
| A | 6432 | 126 | 1.958955% |
| B | 6432 | 138 | 2.145522% |
| C | 6432 | 90 | 1.399254% |
| D | 6433 | 108 | 1.678843% |
Noise dominated data is calculated using 1-second bins in cleaned event files. If a bin has >2000 counts, and if more than 50% of those come from <1% of pixels, then it is considered to be noise-dominated and hence unusable.
| Quadrant | # 1 sec bins | Bins with >0 counts | Bins with >2000 counts | High rate bins dominated by noise | Noise dominated (total time) | Noise dominated (detector-on time) | Marked lightcurve |
|---|---|---|---|---|---|---|---|
| A | 8952 | 6434 | 6 | 6 | 0.07% | 0.09% | 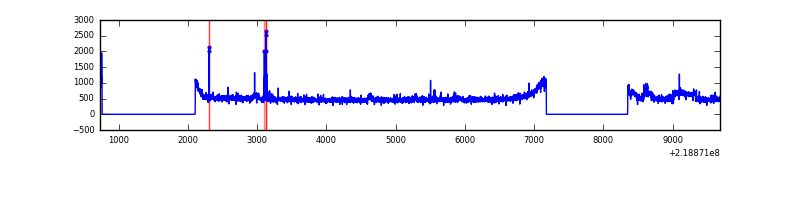 |
| B | 8952 | 6434 | 1 | 1 | 0.01% | 0.02% | 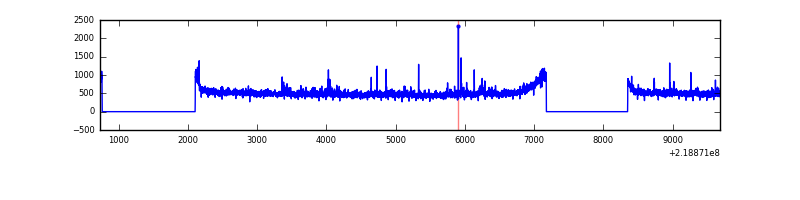 |
| C | 8952 | 6434 | 0 | 0 | 0.00% | 0.00% | 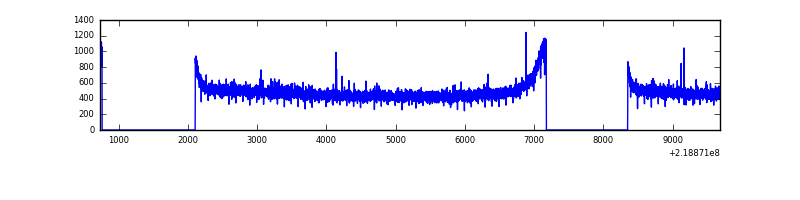 |
| D | 8953 | 6435 | 17 | 17 | 0.19% | 0.26% | 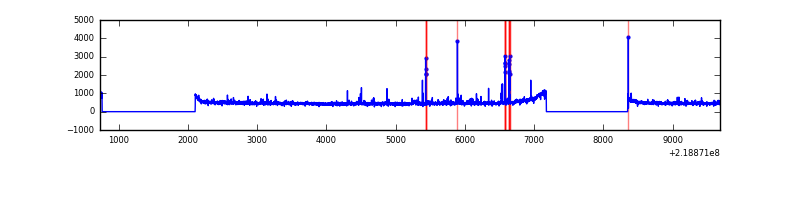 |
Top three noisy pixels from each quadrant. If the there are fewer than three noisy pixels in the level2.evt file, extra rows are filled as -1
| Pixel properties | Quadrant properties | ||||||
|---|---|---|---|---|---|---|---|
| Quadrant | DetID | PixID | Counts | Sigma | Mean | Median | Sigma |
| A | 15 | 236 | 137009 | 811.08 | 820 | 801 | 167.9 |
| A | 8 | 15 | 59289 | 348.28 | 820 | 801 | 167.9 |
| A | 10 | 133 | 10517 | 57.86 | 820 | 801 | 167.9 |
| B | 4 | 81 | 60924 | 375.78 | 828 | 810 | 160.0 |
| B | 12 | 111 | 16294 | 96.79 | 828 | 810 | 160.0 |
| B | 0 | 229 | 14475 | 85.42 | 828 | 810 | 160.0 |
| C | 13 | 61 | 6328 | 29.92 | 795 | 799 | 184.8 |
| C | 12 | 4 | 5861 | 27.4 | 795 | 799 | 184.8 |
| C | 1 | 16 | 2784 | 10.74 | 795 | 799 | 184.8 |
| D | 2 | 14 | 69861 | 353.47 | 792 | 768 | 195.5 |
| D | 2 | 152 | 56078 | 282.96 | 792 | 768 | 195.5 |
| D | 2 | 234 | 18616 | 91.31 | 792 | 768 | 195.5 |
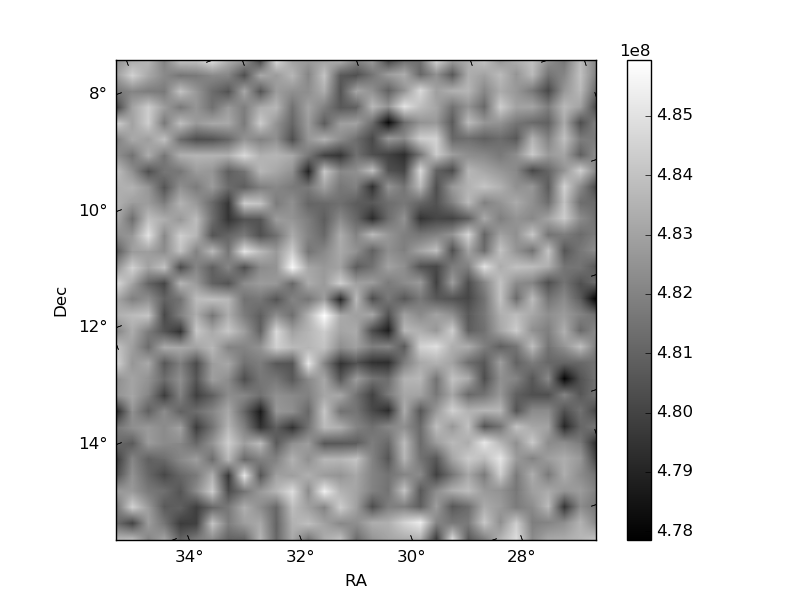
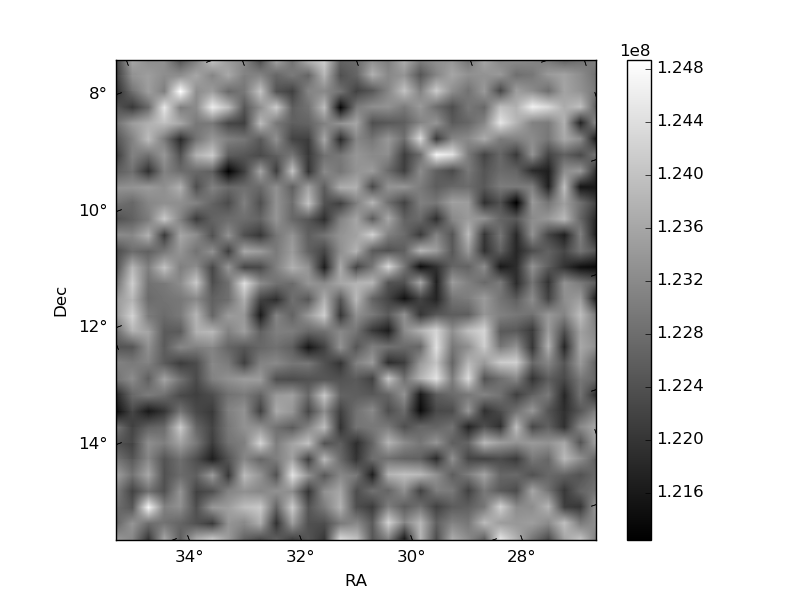
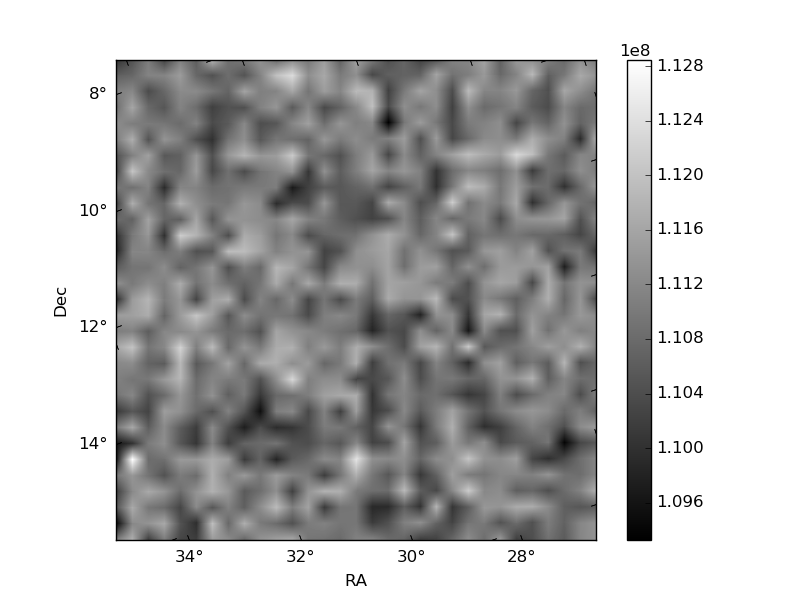
Histogram calculated using DETX and DETY for each event in the final _common_clean file
| Quadrant A | 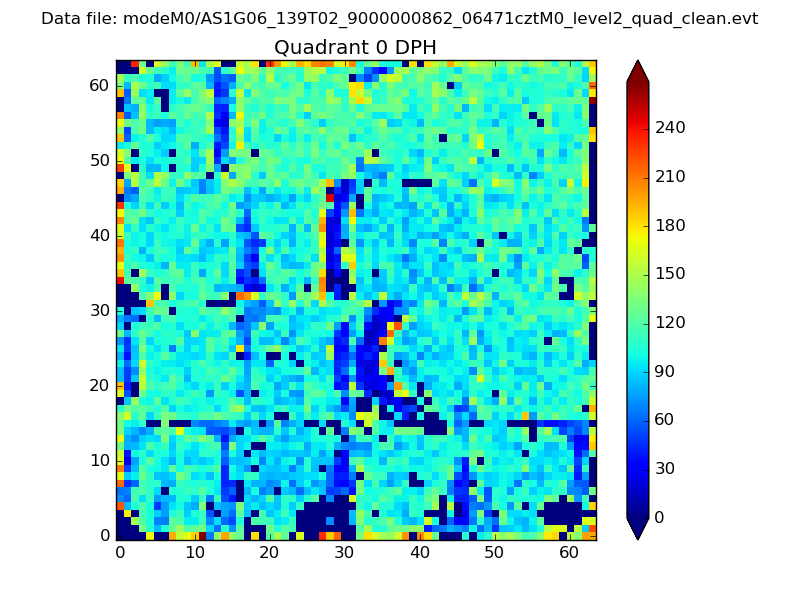 |
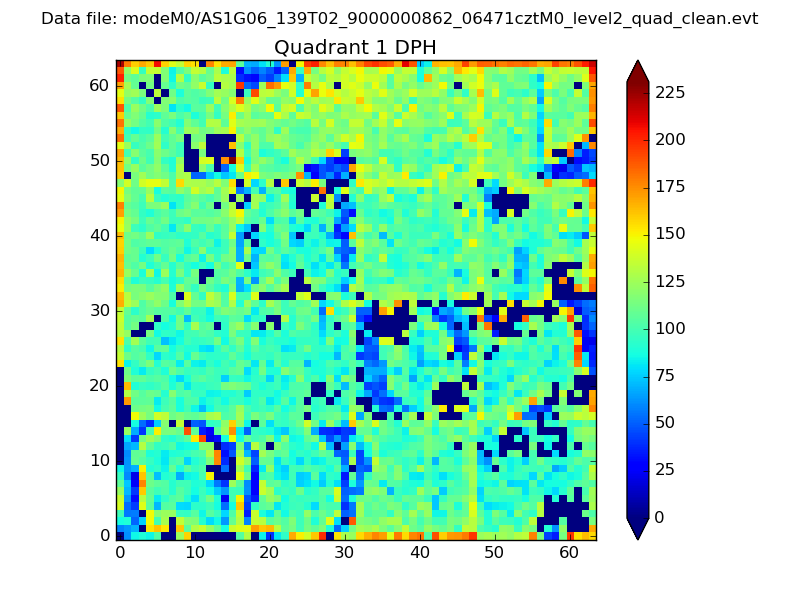 |
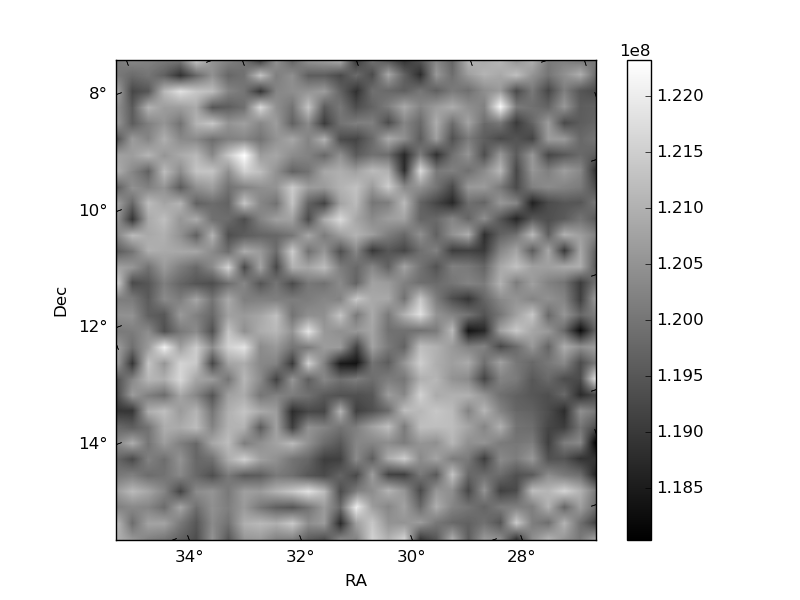
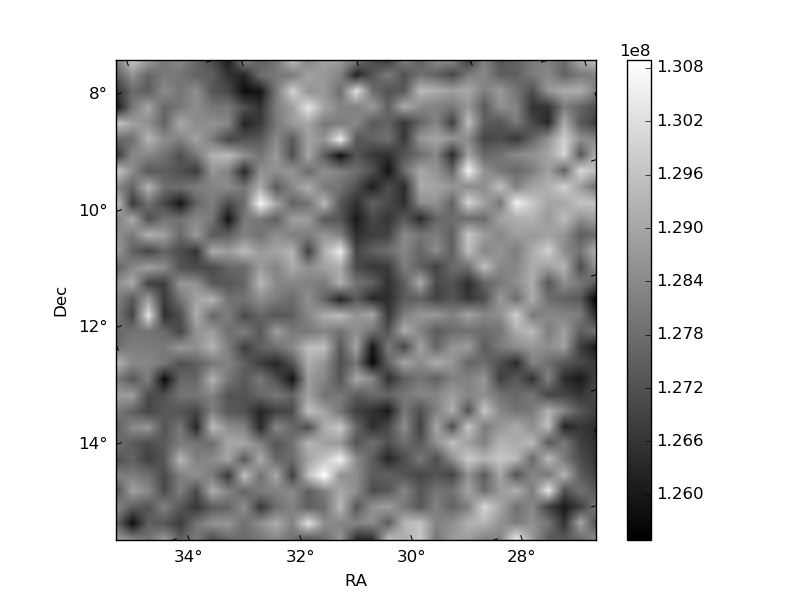
Quadrant B |
|---|---|---|---|
| Quadrant D | 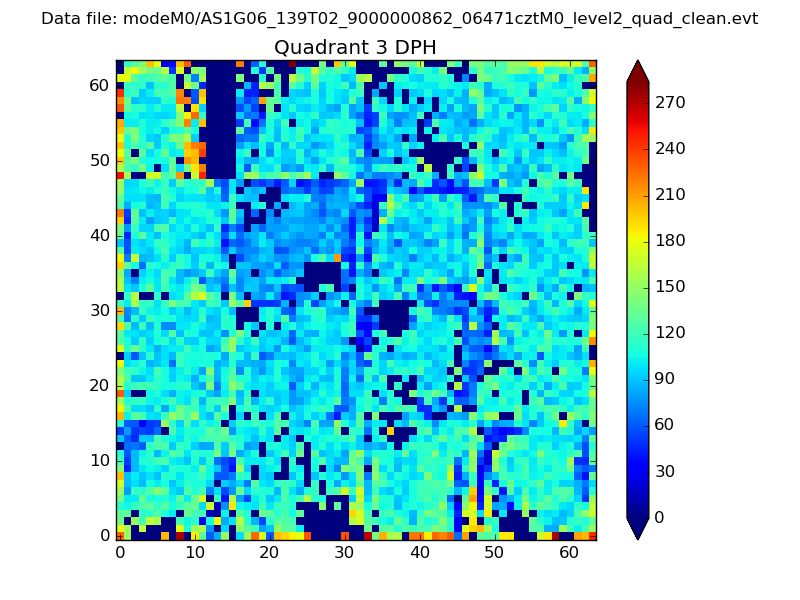 |
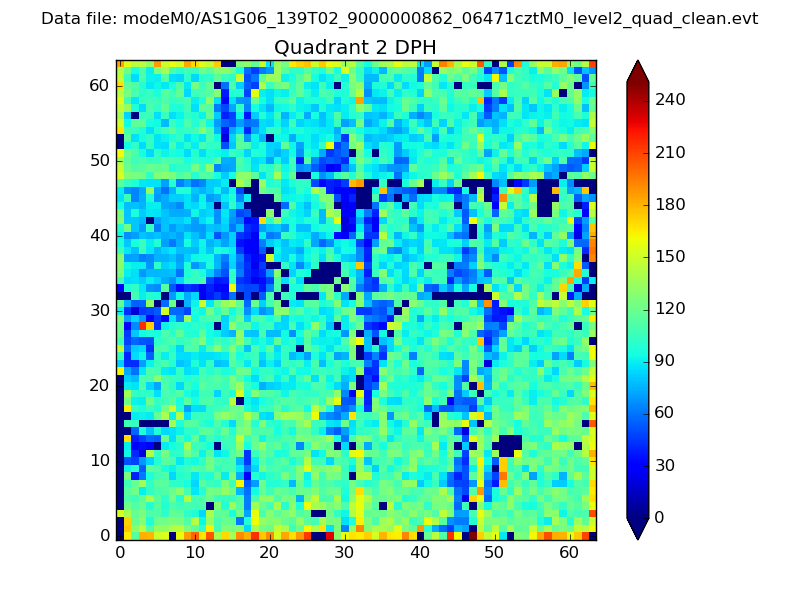 |
Quadrant C |
| Plot type | Count rate plots | Images |
|---|---|---|
| Comparison with Poisson distribution Blue bars denote a histogram of data divided into 1 sec bins. Red curve is a Poisson curve with rate = median count rate of data. |
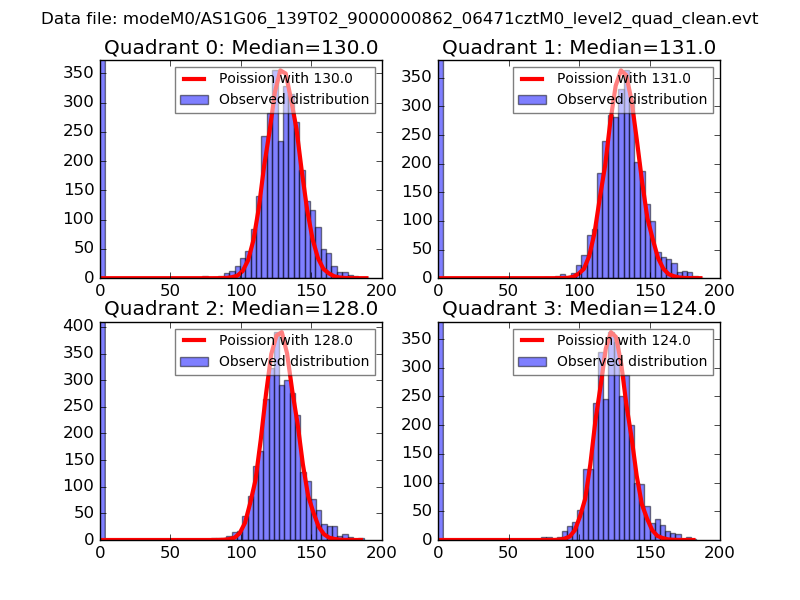 |
 |
| Quadrant-wise count rates Data is divided into 100 sec bins |
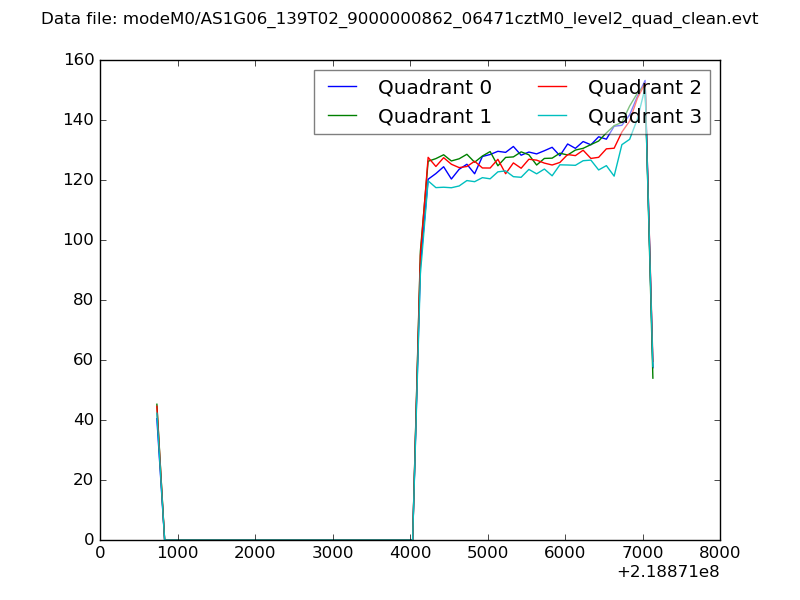 |
|
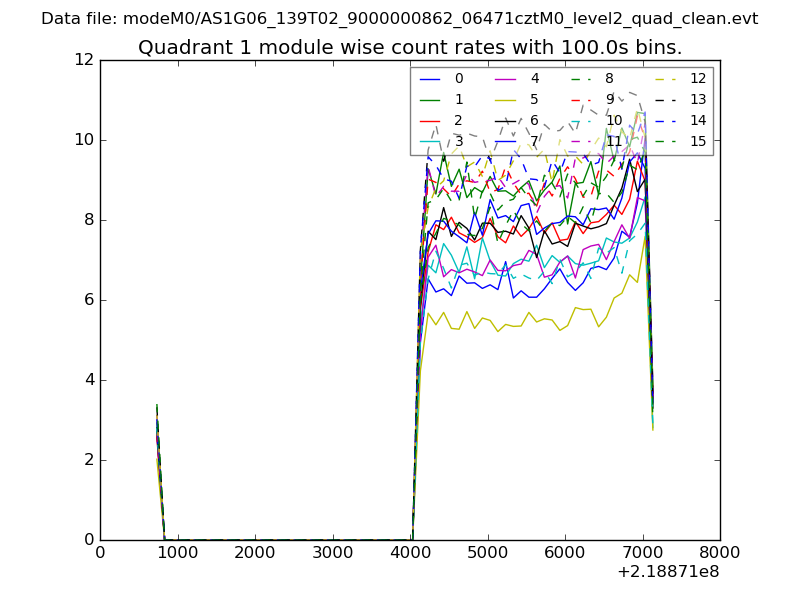
| Module-wise count rates for Quadrant A Data is divided into 100 sec bins |
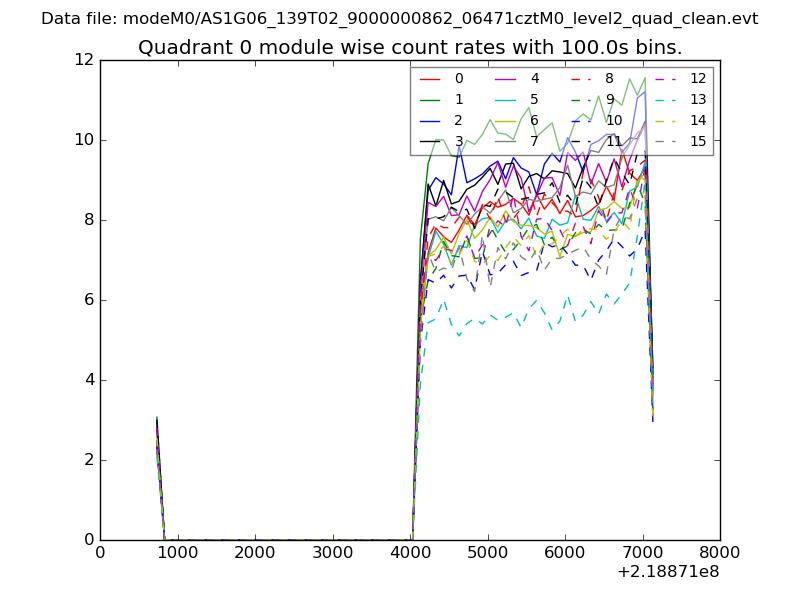 |
 |
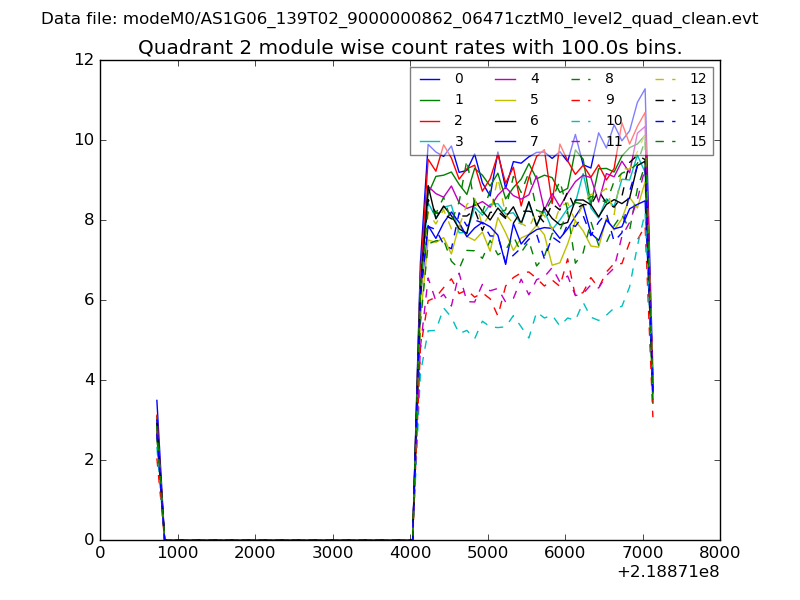
| Module-wise count rates for Quadrant B Data is divided into 100 sec bins |
 |
 |
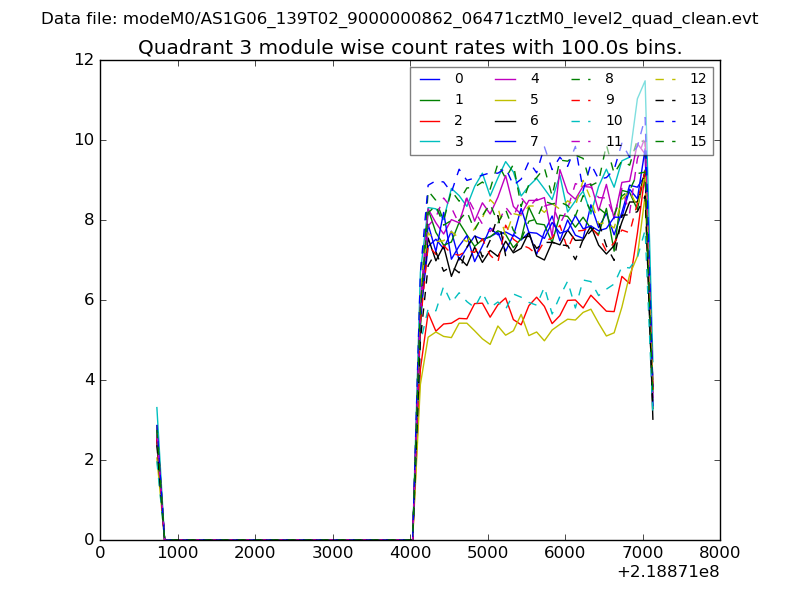
| Module-wise count rates for Quadrant C Data is divided into 100 sec bins |
 |
 |
| Module-wise count rates for Quadrant D Data is divided into 100 sec bins |
 |
 |
| Parameter | Plot |
|---|---|
| CZT HV Monitor | 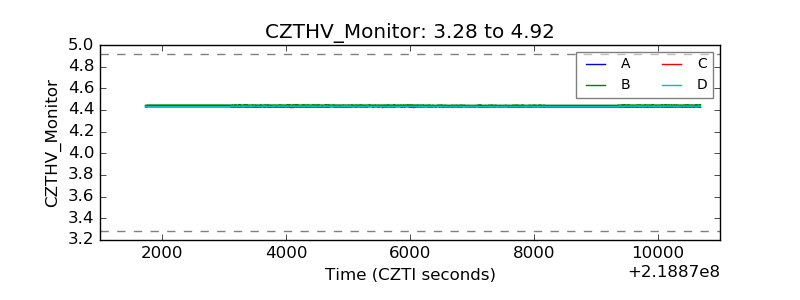 |
| D_VDD | 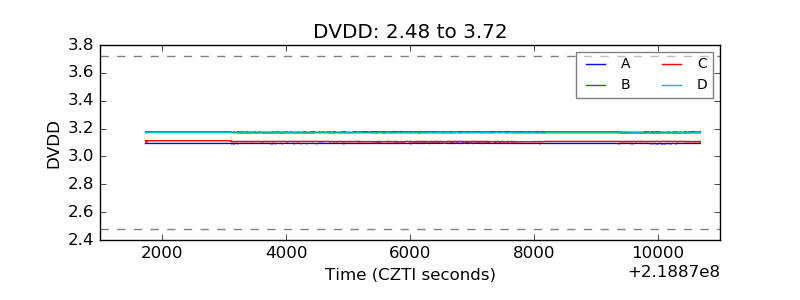 |
| Temperature 1 | 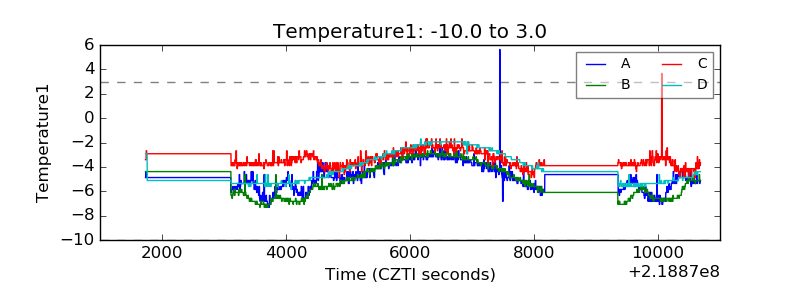 |
| Veto HV Monitor | 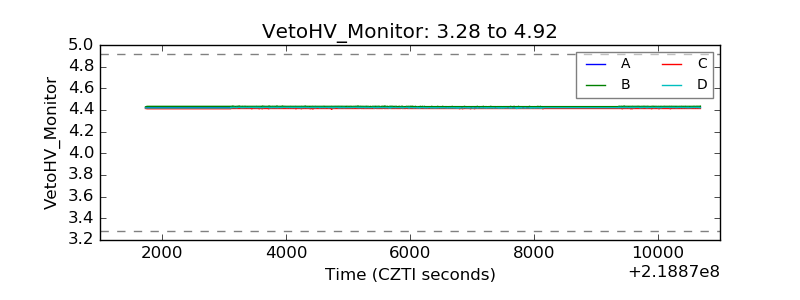 |
| Veto LLD | 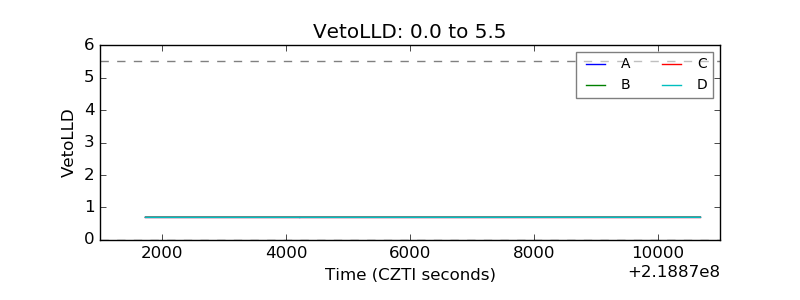 |
| Alpha Counter | 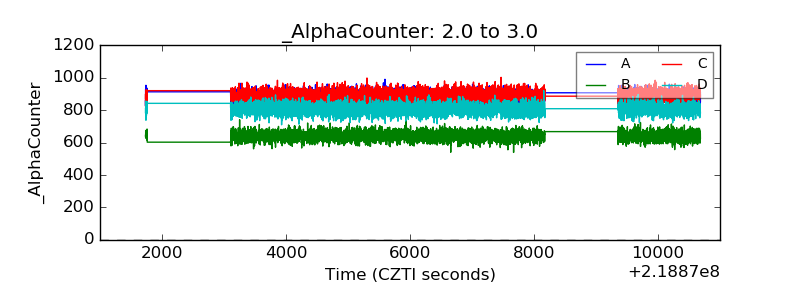 |
| _CPM_Rate | 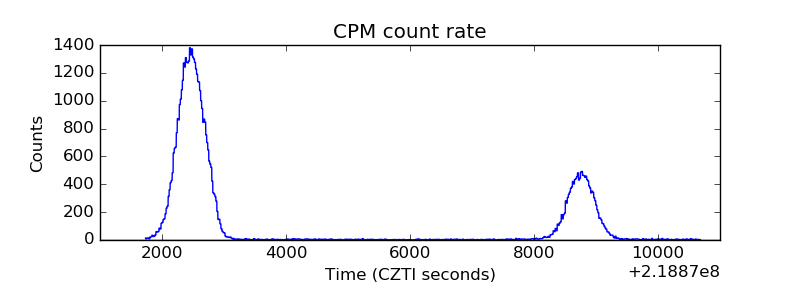 |
| CZT Counter | 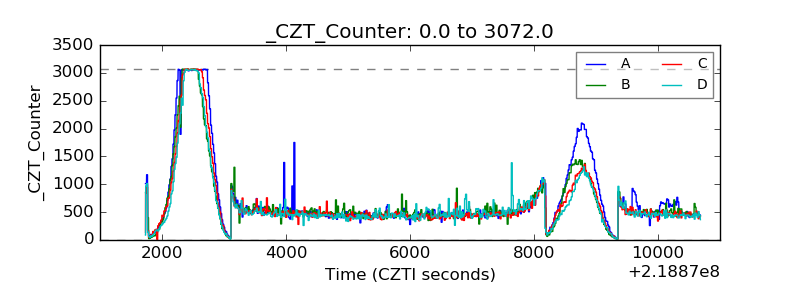 |
| +2.5 Volts monitor |  |
| +5 Volts monitor |  |
| _ROLL_ROT | 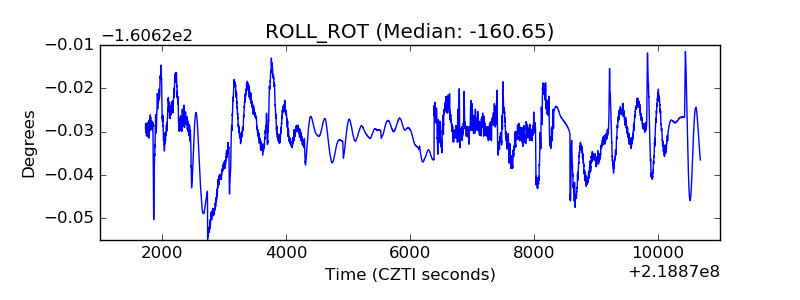 |
| _Roll_DEC | 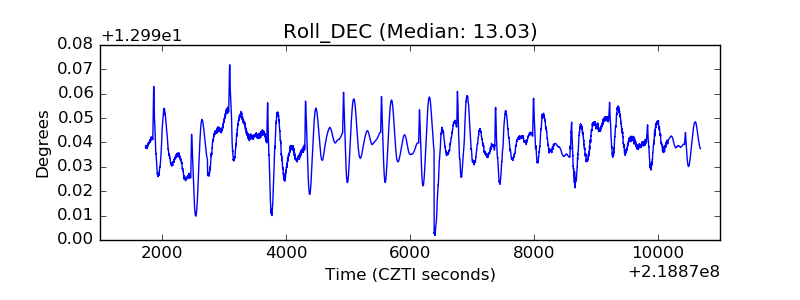 |
| _Roll_RA | 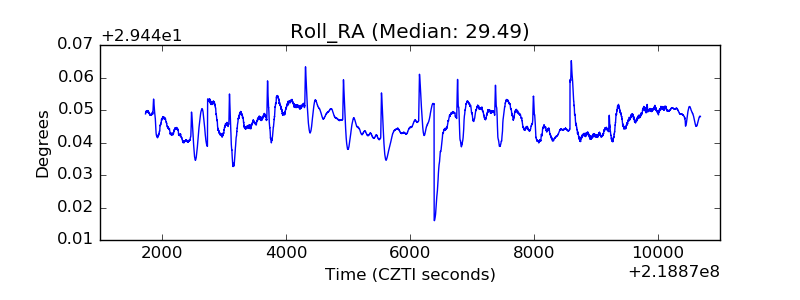 |
| Veto Counter | 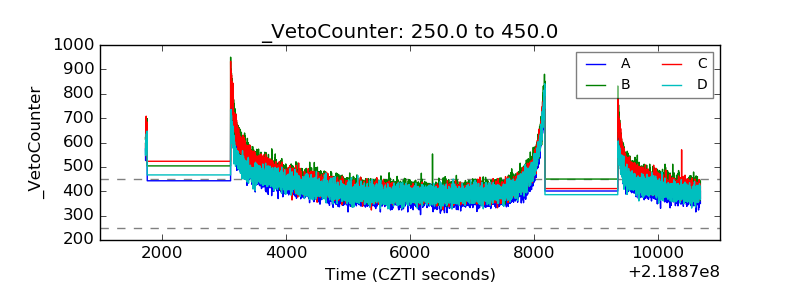 |