| Param | Original file | Final file |
|---|---|---|
| Filename | modeM0/AS1G06_139T02_9000000862_06472cztM0_level2.evt | modeM0/AS1G06_139T02_9000000862_06472cztM0_level2_quad_clean.evt |
| Size (bytes) | 456,894,720 | 76,651,200 |
| Size | 435.7 MB | 73.1 MB |
| Events in quadrant A | 3,647,890 | 469,097 |
| Events in quadrant B | 3,313,424 | 469,567 |
| Events in quadrant C | 3,161,590 | 459,234 |
| Events in quadrant D | 3,251,756 | 448,954 |
| Mode M9 | |||
|---|---|---|---|
| Quadrant | BADHDUFLAG | Total packets | Discarded packets |
| A | 0 | 10 | 0 |
| B | 0 | 10 | 0 |
| C | 0 | 10 | 0 |
| D | 0 | 11 | 0 |
| Mode M0 | |||
|---|---|---|---|
| Quadrant | BADHDUFLAG | Total packets | Discarded packets |
| A | 0 | 15488 | 3 |
| B | 0 | 14175 | 2 |
| C | 0 | 14048 | 2 |
| D | 0 | 14315 | 2 |
| Mode SS | |||
|---|---|---|---|
| Quadrant | BADHDUFLAG | Total packets | Discarded packets |
| A | 0 | 138 | 0 |
| B | 0 | 138 | 0 |
| C | 0 | 138 | 0 |
| D | 0 | 138 | 0 |
| Quadrant | Total seconds | Saturated seconds | Saturation percentage |
|---|---|---|---|
| A | 6802 | 149 | 2.190532% |
| B | 6802 | 142 | 2.087621% |
| C | 6802 | 78 | 1.146722% |
| D | 6802 | 105 | 1.543664% |
Noise dominated data is calculated using 1-second bins in cleaned event files. If a bin has >2000 counts, and if more than 50% of those come from <1% of pixels, then it is considered to be noise-dominated and hence unusable.
| Quadrant | # 1 sec bins | Bins with >0 counts | Bins with >2000 counts | High rate bins dominated by noise | Noise dominated (total time) | Noise dominated (detector-on time) | Marked lightcurve |
|---|---|---|---|---|---|---|---|
| A | 7642 | 6803 | 0 | 0 | 0.00% | 0.00% | 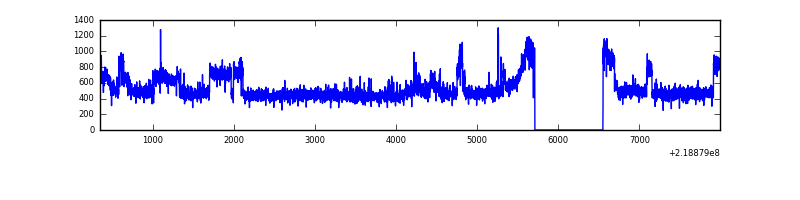 |
| B | 7642 | 6803 | 0 | 0 | 0.00% | 0.00% | 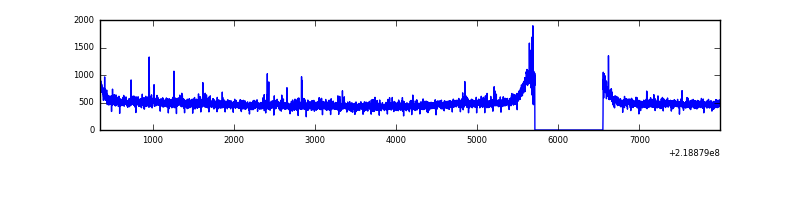 |
| C | 7642 | 6803 | 0 | 0 | 0.00% | 0.00% |  |
| D | 7642 | 6803 | 10 | 10 | 0.13% | 0.15% | 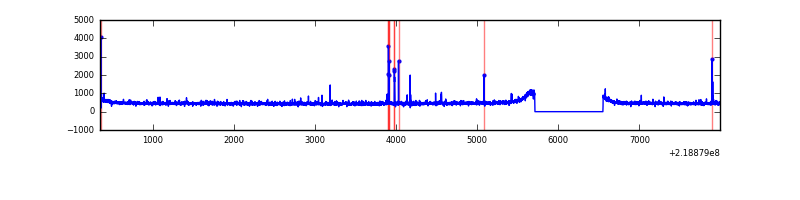 |
Top three noisy pixels from each quadrant. If the there are fewer than three noisy pixels in the level2.evt file, extra rows are filled as -1
| Pixel properties | Quadrant properties | ||||||
|---|---|---|---|---|---|---|---|
| Quadrant | DetID | PixID | Counts | Sigma | Mean | Median | Sigma |
| A | 15 | 236 | 397508 | 2317.37 | 835 | 819 | 171.2 |
| A | 8 | 15 | 12221 | 66.61 | 835 | 819 | 171.2 |
| A | 10 | 133 | 9774 | 52.31 | 835 | 819 | 171.2 |
| B | 4 | 81 | 32087 | 190.11 | 843 | 821 | 164.5 |
| B | 12 | 111 | 17047 | 98.66 | 843 | 821 | 164.5 |
| B | 11 | 111 | 13341 | 76.13 | 843 | 821 | 164.5 |
| C | 13 | 61 | 6330 | 29.21 | 809 | 813 | 188.9 |
| C | 3 | 202 | 1994 | 6.25 | 809 | 813 | 188.9 |
| C | 10 | 170 | 1897 | 5.74 | 809 | 813 | 188.9 |
| D | 13 | 137 | 57760 | 286.14 | 811 | 785 | 199.1 |
| D | 5 | 97 | 42517 | 209.58 | 811 | 785 | 199.1 |
| D | 2 | 152 | 21163 | 102.34 | 811 | 785 | 199.1 |
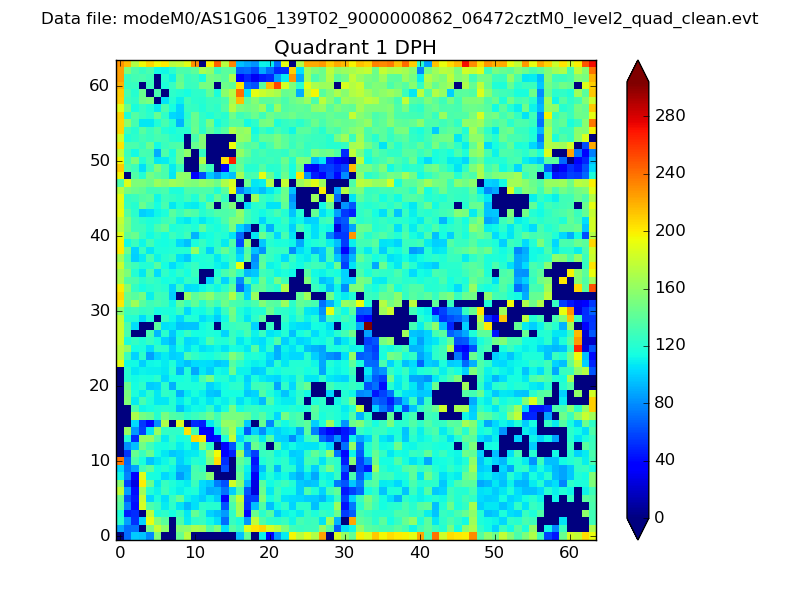
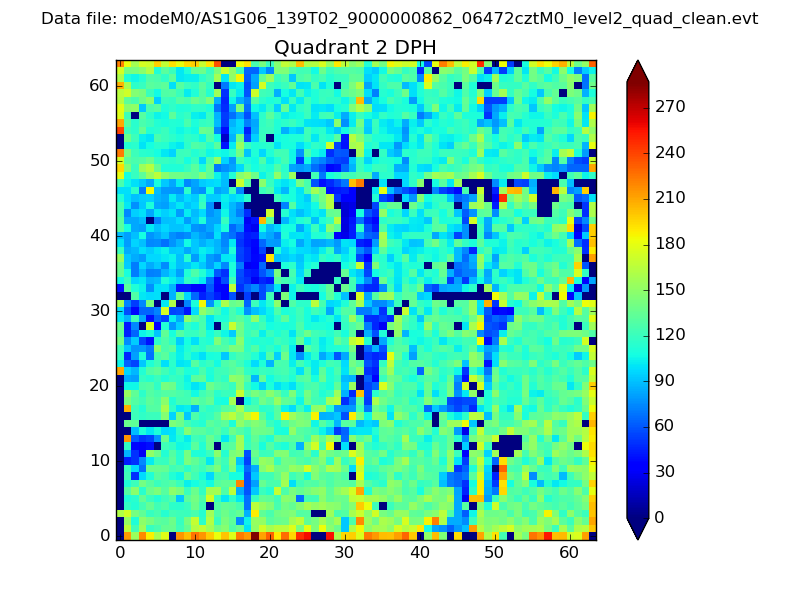
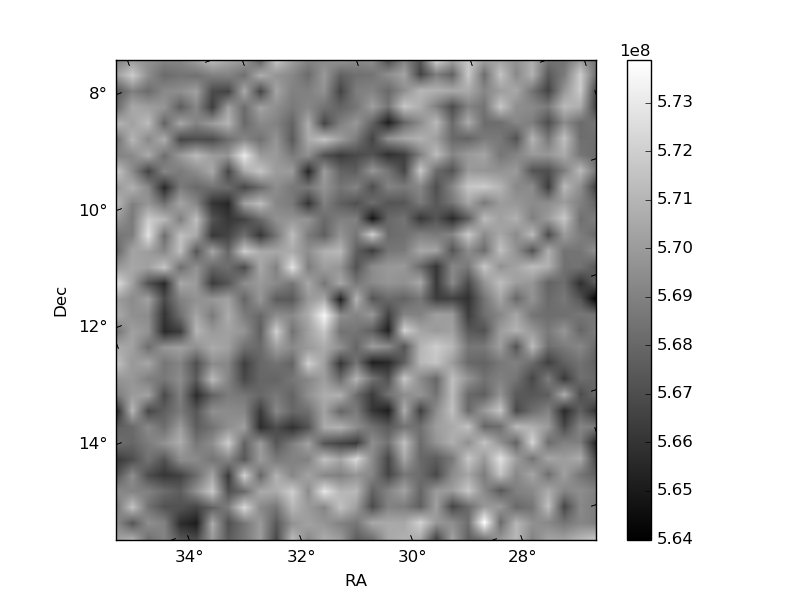
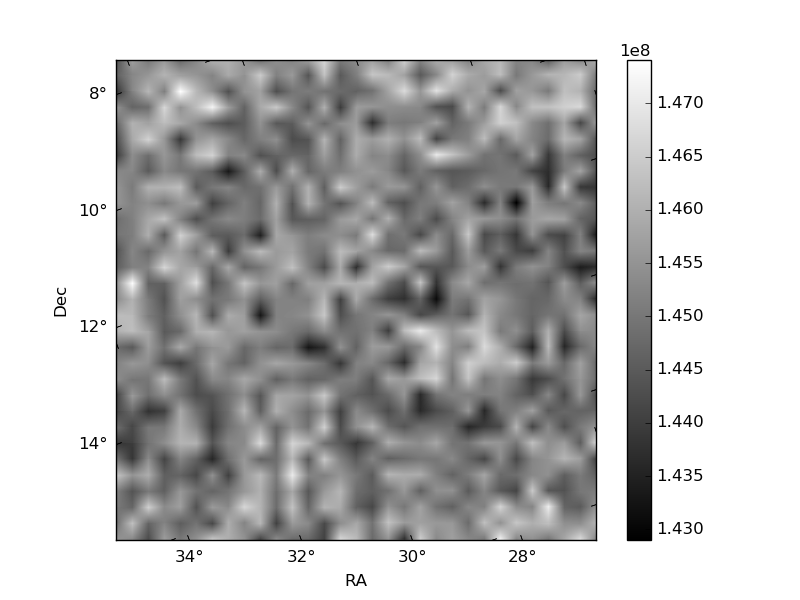
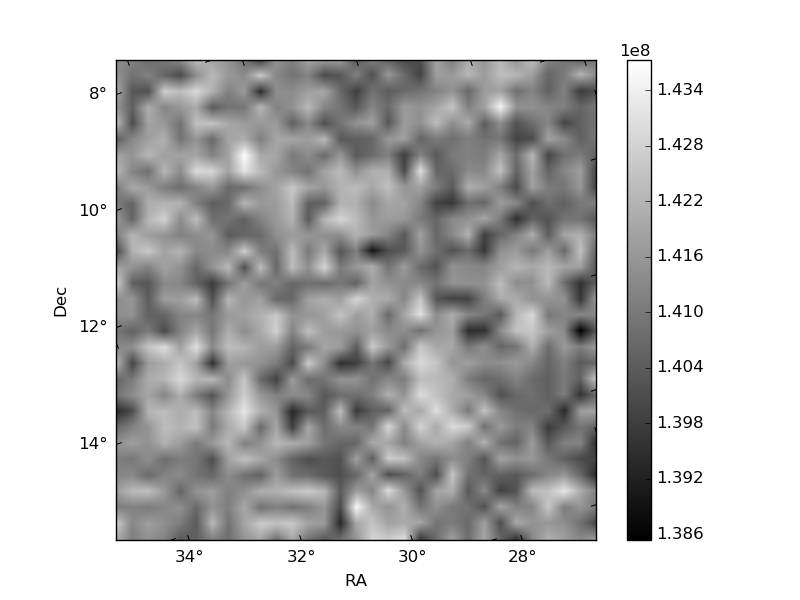
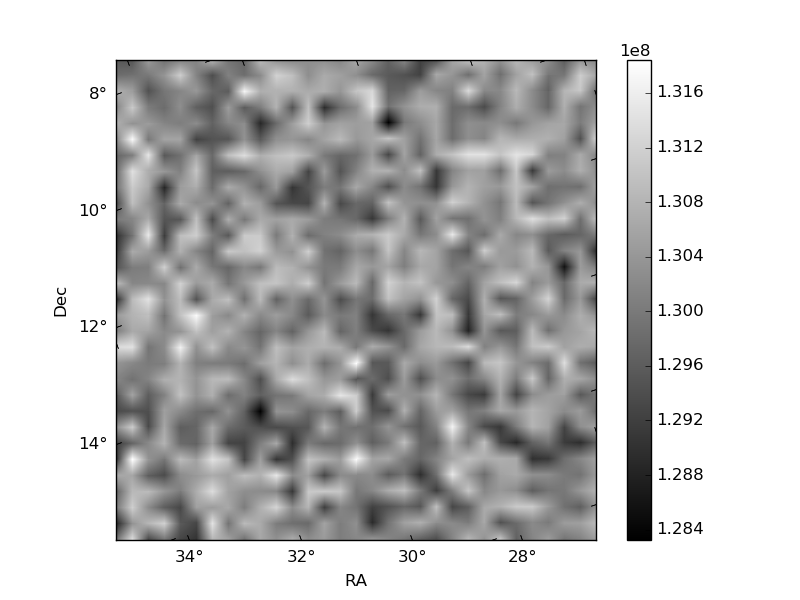
Histogram calculated using DETX and DETY for each event in the final _common_clean file
| Quadrant A | 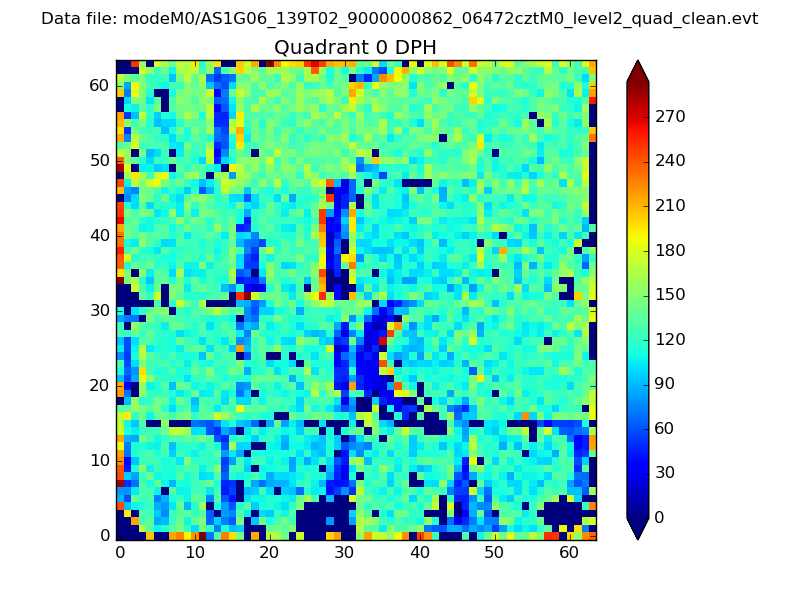 |
 |
Quadrant B |
|---|---|---|---|
| Quadrant D | 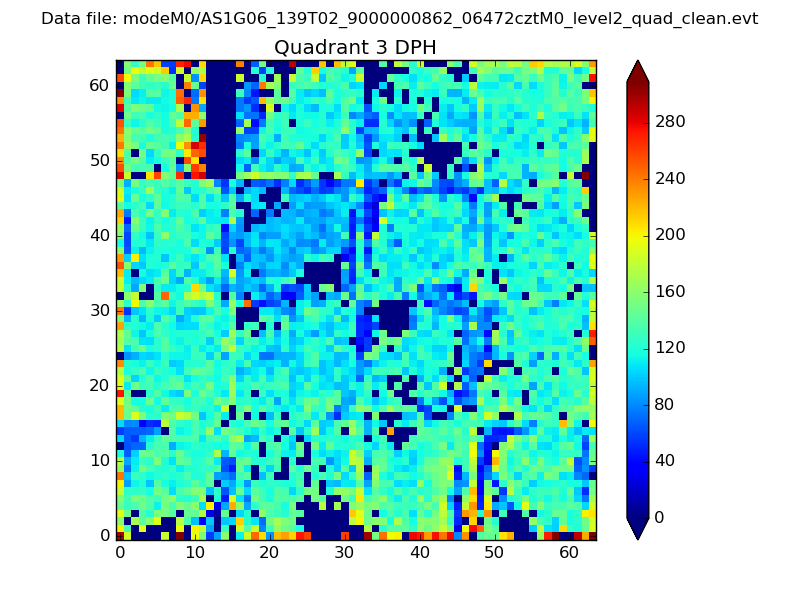 |
 |
Quadrant C |
| Plot type | Count rate plots | Images |
|---|---|---|
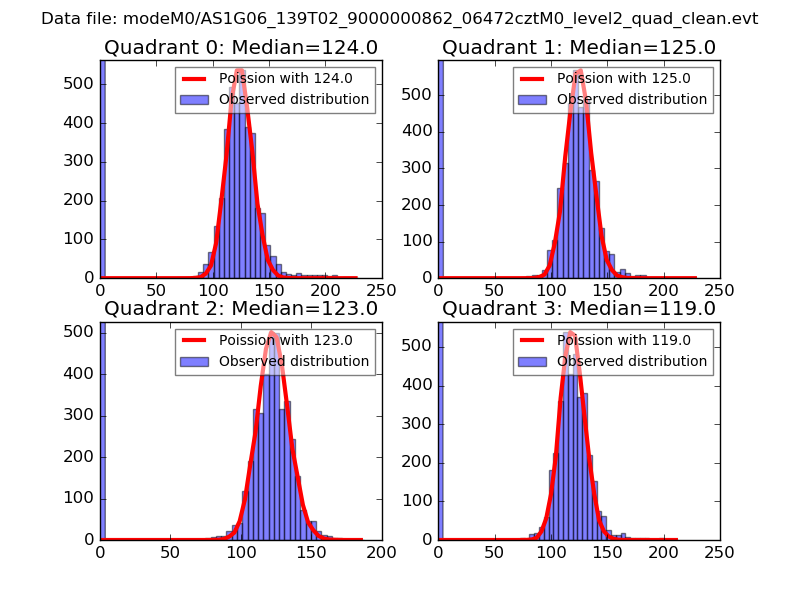
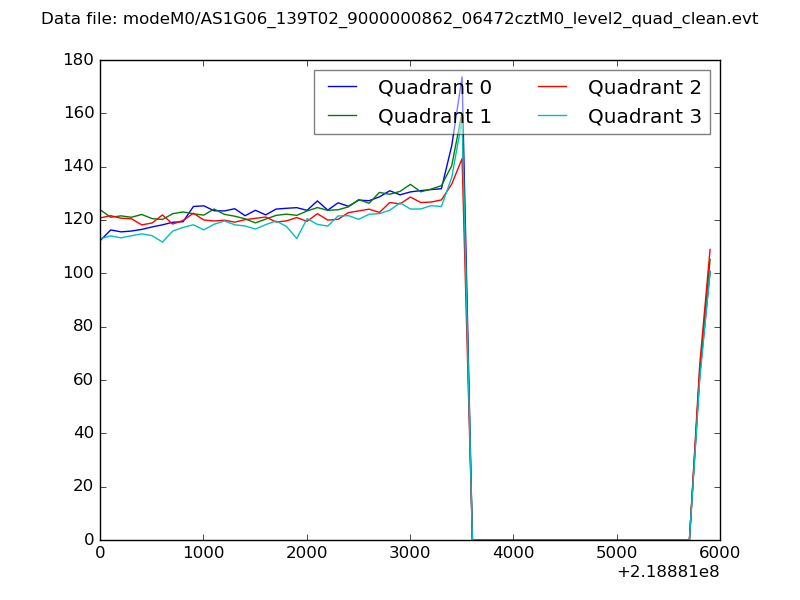
| Comparison with Poisson distribution Blue bars denote a histogram of data divided into 1 sec bins. Red curve is a Poisson curve with rate = median count rate of data. |
 |
 |
| Quadrant-wise count rates Data is divided into 100 sec bins |
 |
|
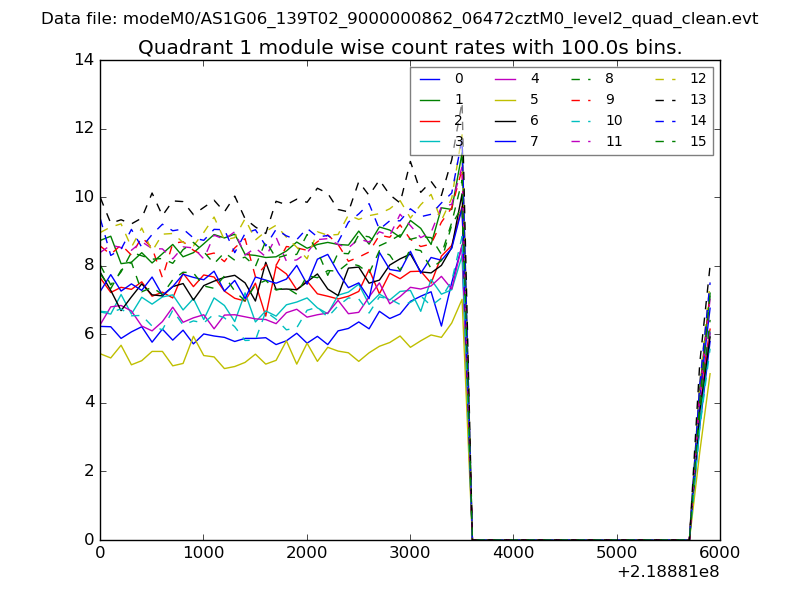
| Module-wise count rates for Quadrant A Data is divided into 100 sec bins |
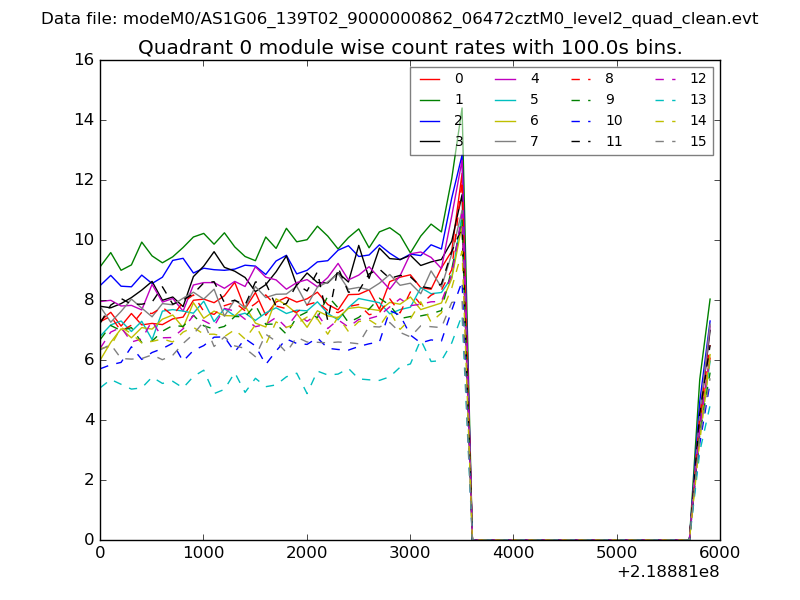 |
 |
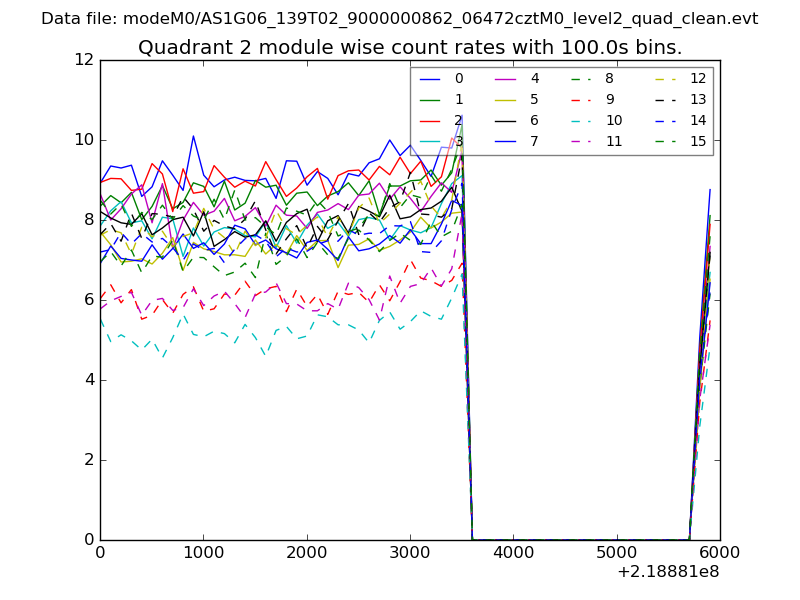
| Module-wise count rates for Quadrant B Data is divided into 100 sec bins |
 |
 |
| Module-wise count rates for Quadrant C Data is divided into 100 sec bins |
 |
 |
| Module-wise count rates for Quadrant D Data is divided into 100 sec bins |
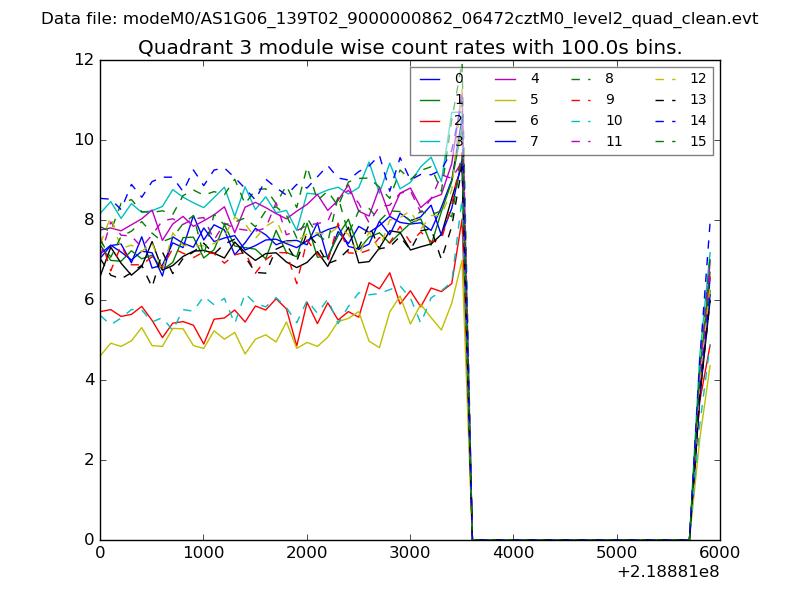 |
 |
| Parameter | Plot |
|---|---|
| CZT HV Monitor | 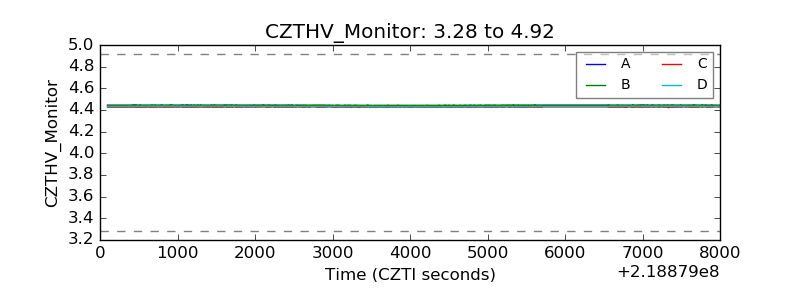 |
| D_VDD | 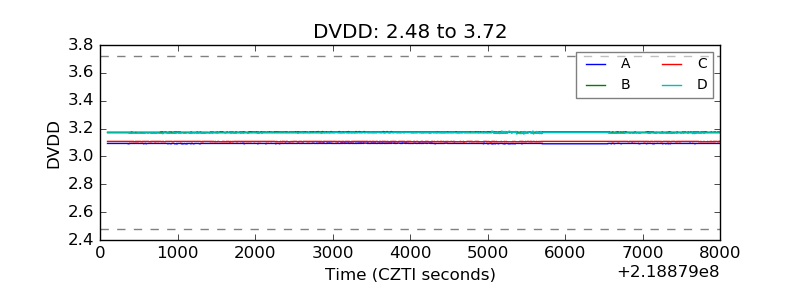 |
| Temperature 1 | 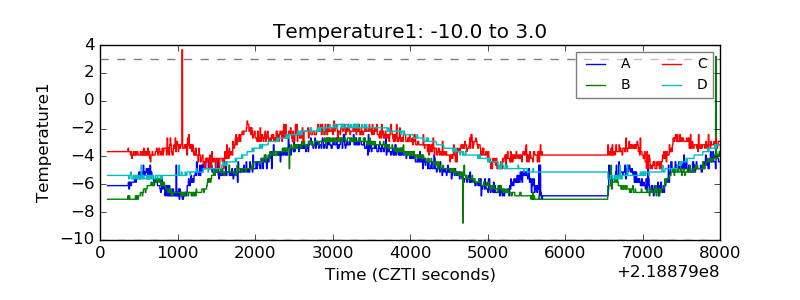 |
| Veto HV Monitor | 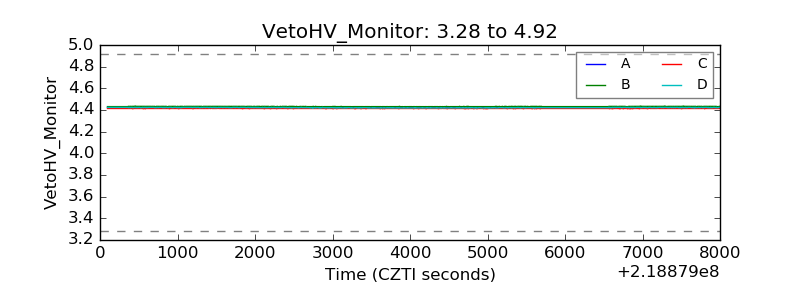 |
| Veto LLD | 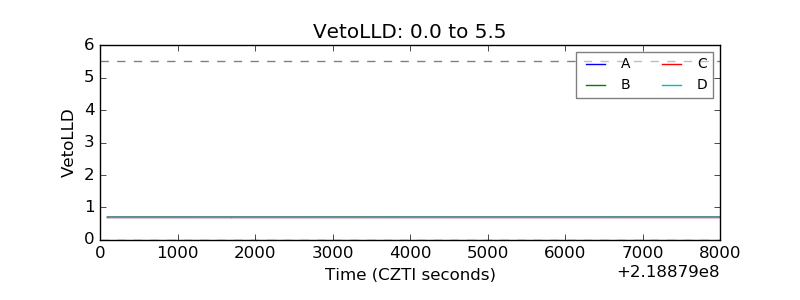 |
| Alpha Counter | 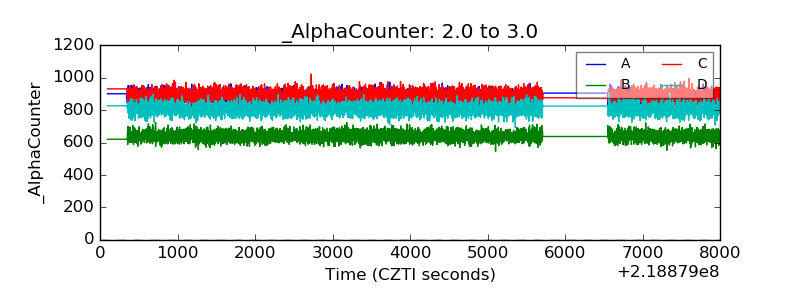 |
| _CPM_Rate | 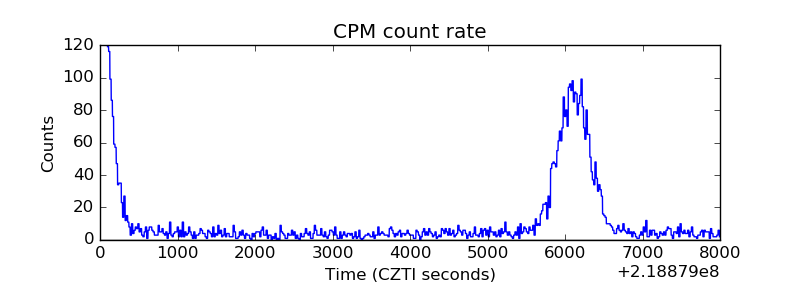 |
| CZT Counter | 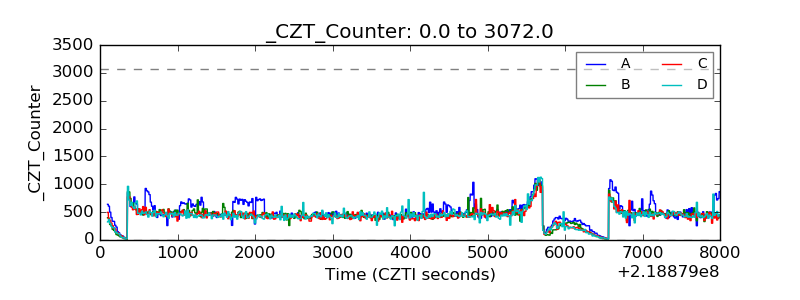 |
| +2.5 Volts monitor |  |
| +5 Volts monitor |  |
| _ROLL_ROT | 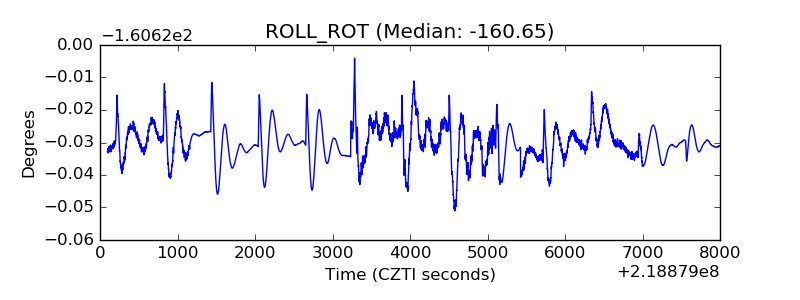 |
| _Roll_DEC | 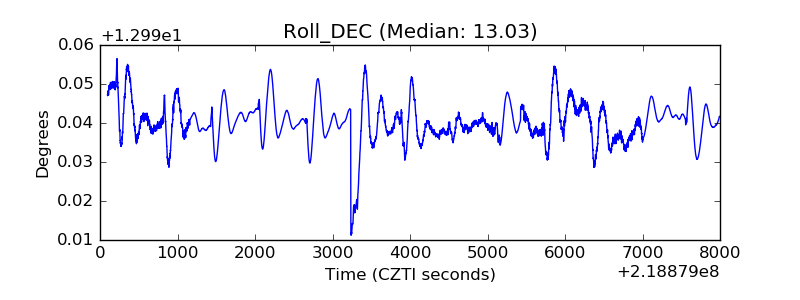 |
| _Roll_RA | 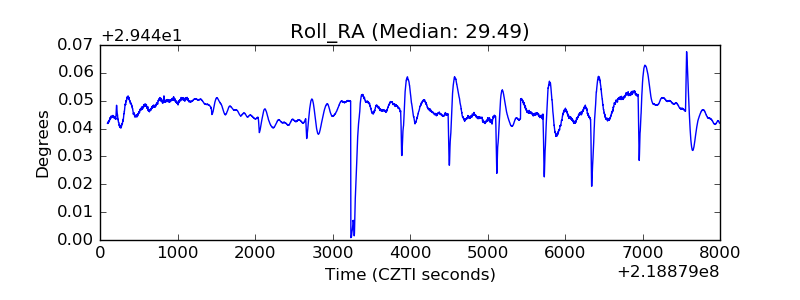 |
| Veto Counter | 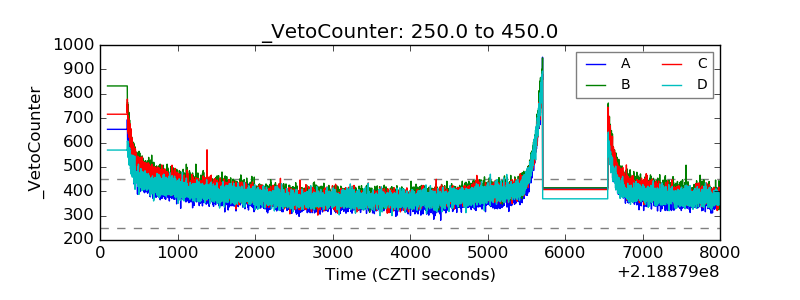 |