| Param | Original file | Final file |
|---|---|---|
| Filename | modeM0/AS1G06_139T02_9000000862_06474cztM0_level2.evt | modeM0/AS1G06_139T02_9000000862_06474cztM0_level2_quad_clean.evt |
| Size (bytes) | 513,276,480 | 87,238,080 |
| Size | 489.5 MB | 83.2 MB |
| Events in quadrant A | 3,969,145 | 532,832 |
| Events in quadrant B | 3,666,199 | 537,520 |
| Events in quadrant C | 3,600,306 | 529,472 |
| Events in quadrant D | 3,793,676 | 514,168 |
| Mode M0 | |||
|---|---|---|---|
| Quadrant | BADHDUFLAG | Total packets | Discarded packets |
| A | 0 | 16960 | 1 |
| B | 0 | 15904 | 0 |
| C | 0 | 15956 | 0 |
| D | 0 | 16326 | 0 |
| Mode SS | |||
|---|---|---|---|
| Quadrant | BADHDUFLAG | Total packets | Discarded packets |
| A | 0 | 152 | 0 |
| B | 0 | 152 | 0 |
| C | 0 | 152 | 0 |
| D | 0 | 152 | 0 |
| Quadrant | Total seconds | Saturated seconds | Saturation percentage |
|---|---|---|---|
| A | 7585 | 195 | 2.570864% |
| B | 7585 | 133 | 1.753461% |
| C | 7585 | 33 | 0.435069% |
| D | 7585 | 104 | 1.371127% |
Noise dominated data is calculated using 1-second bins in cleaned event files. If a bin has >2000 counts, and if more than 50% of those come from <1% of pixels, then it is considered to be noise-dominated and hence unusable.
| Quadrant | # 1 sec bins | Bins with >0 counts | Bins with >2000 counts | High rate bins dominated by noise | Noise dominated (total time) | Noise dominated (detector-on time) | Marked lightcurve |
|---|---|---|---|---|---|---|---|
| A | 7585 | 7585 | 2 | 2 | 0.03% | 0.03% | 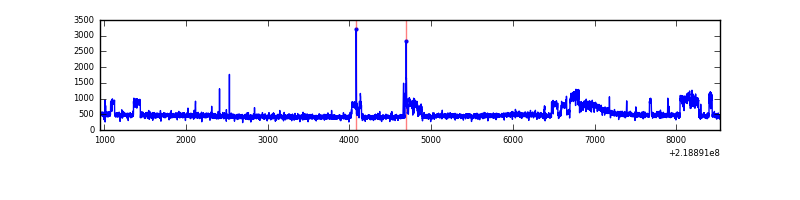 |
| B | 7585 | 7585 | 3 | 3 | 0.04% | 0.04% | 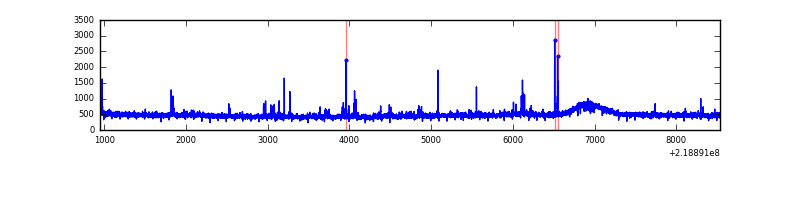 |
| C | 7585 | 7585 | 0 | 0 | 0.00% | 0.00% | 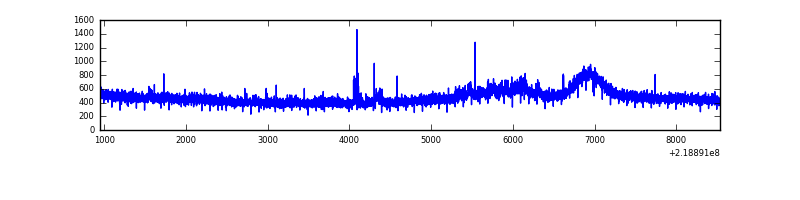 |
| D | 7585 | 7585 | 26 | 26 | 0.34% | 0.34% | 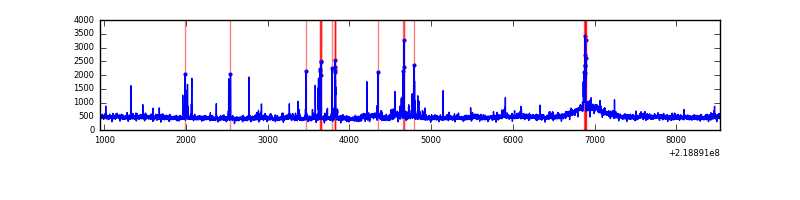 |
Top three noisy pixels from each quadrant. If the there are fewer than three noisy pixels in the level2.evt file, extra rows are filled as -1
| Pixel properties | Quadrant properties | ||||||
|---|---|---|---|---|---|---|---|
| Quadrant | DetID | PixID | Counts | Sigma | Mean | Median | Sigma |
| A | 15 | 236 | 420251 | 2219.15 | 913 | 891 | 189.0 |
| A | 15 | 239 | 13626 | 67.39 | 913 | 891 | 189.0 |
| A | 8 | 15 | 11089 | 53.97 | 913 | 891 | 189.0 |
| B | 4 | 81 | 60363 | 331.22 | 917 | 894 | 179.5 |
| B | 0 | 219 | 30272 | 163.62 | 917 | 894 | 179.5 |
| B | 12 | 111 | 18324 | 97.08 | 917 | 894 | 179.5 |
| C | 1 | 16 | 98813 | 474.96 | 885 | 889 | 206.2 |
| C | 8 | 128 | 20042 | 92.9 | 885 | 889 | 206.2 |
| C | 12 | 4 | 10254 | 45.42 | 885 | 889 | 206.2 |
| D | 2 | 152 | 109584 | 491.78 | 888 | 861 | 221.1 |
| D | 8 | 195 | 102384 | 459.21 | 888 | 861 | 221.1 |
| D | 2 | 136 | 76247 | 340.99 | 888 | 861 | 221.1 |
Histogram calculated using DETX and DETY for each event in the final _common_clean file
| Quadrant A | 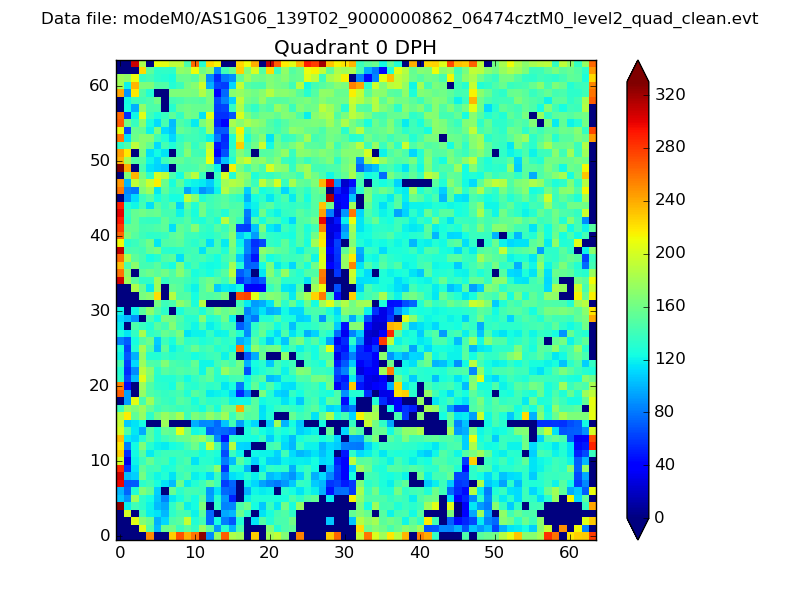 |
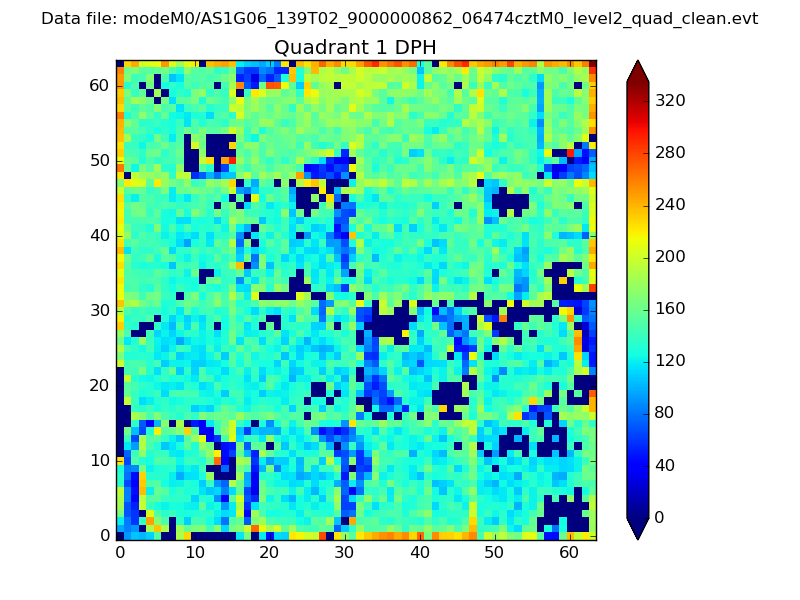 |
Quadrant B |
|---|---|---|---|
| Quadrant D | 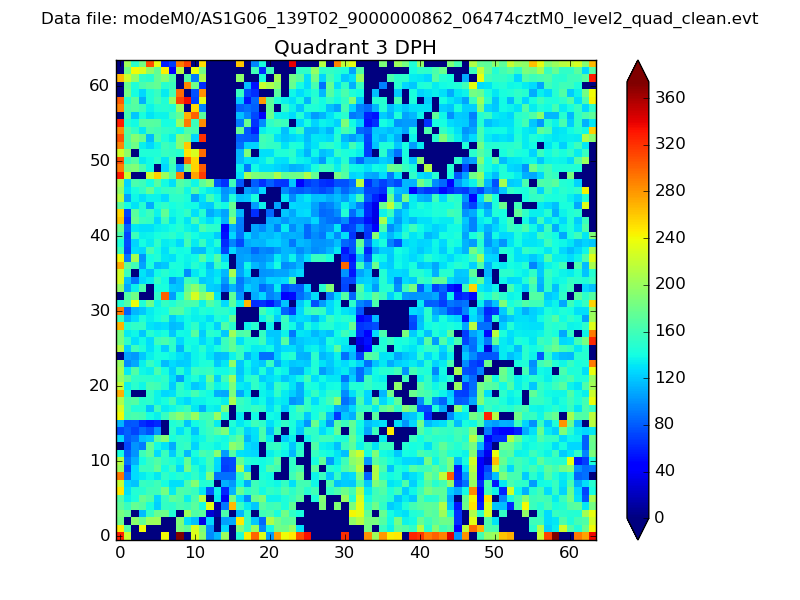 |
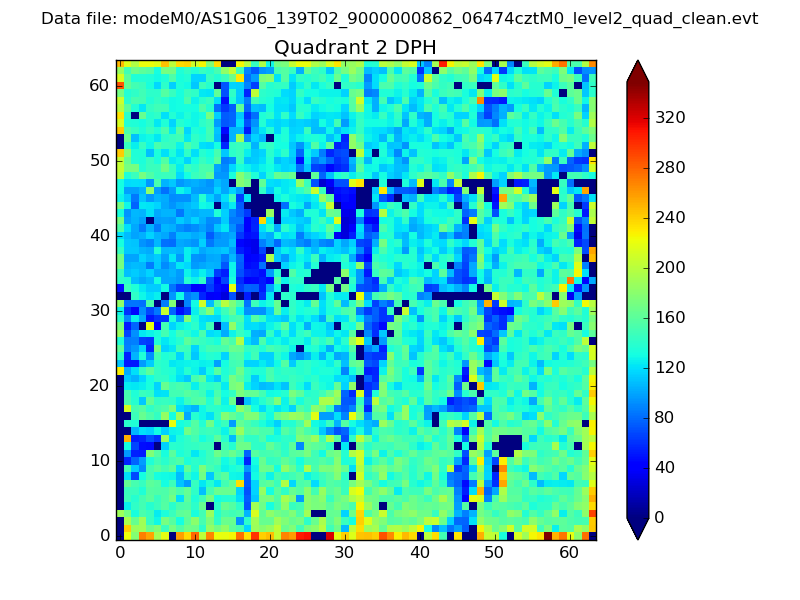 |
Quadrant C |
| Plot type | Count rate plots | Images |
|---|---|---|
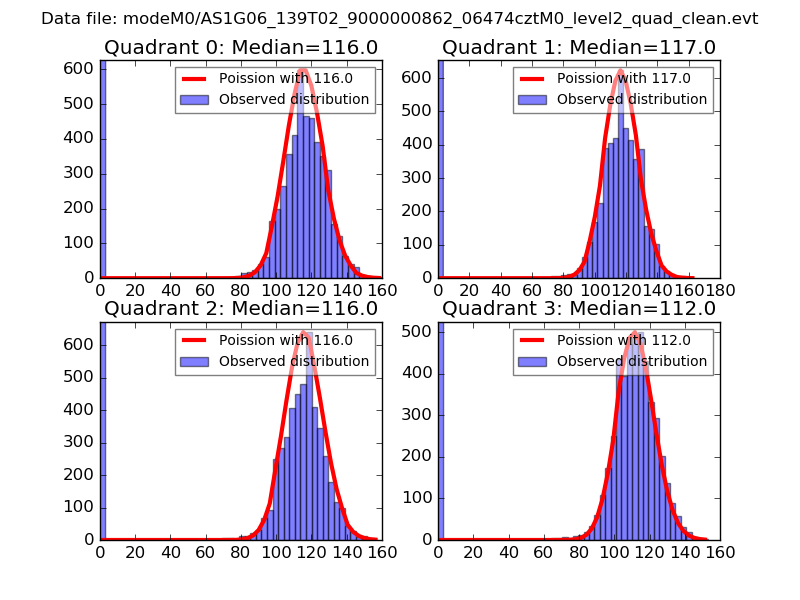
| Comparison with Poisson distribution Blue bars denote a histogram of data divided into 1 sec bins. Red curve is a Poisson curve with rate = median count rate of data. |
 |
 |
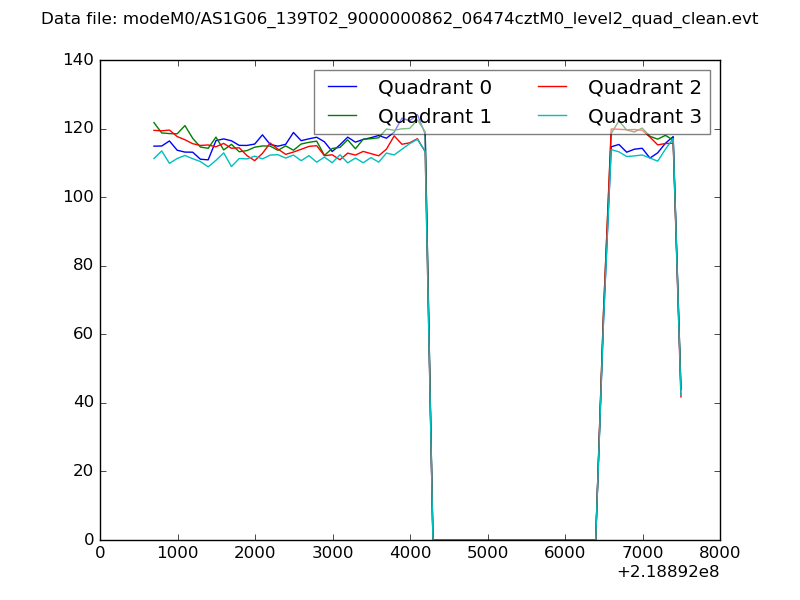
| Quadrant-wise count rates Data is divided into 100 sec bins |
 |
|
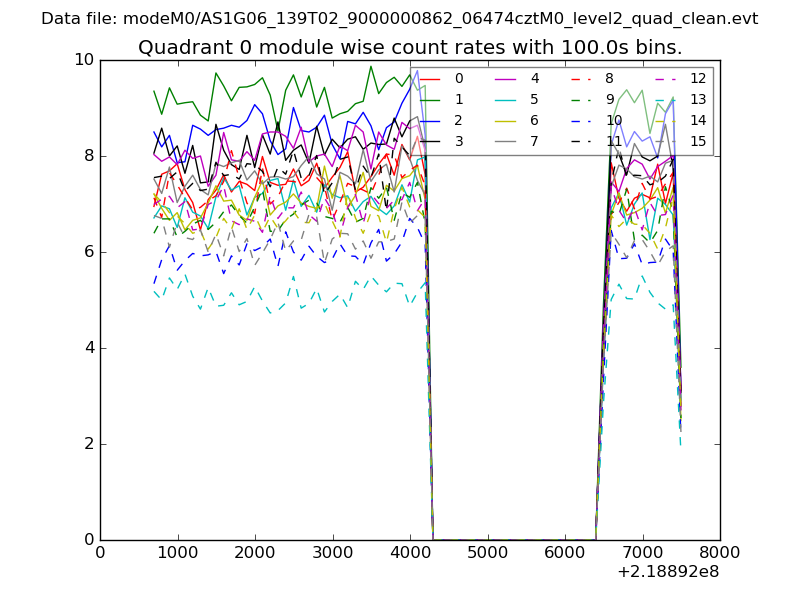
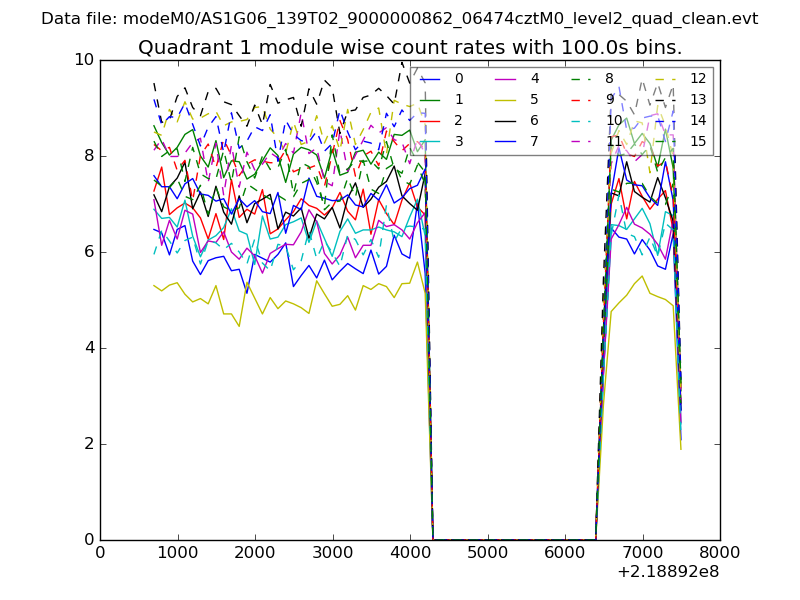
| Module-wise count rates for Quadrant A Data is divided into 100 sec bins |
 |
 |
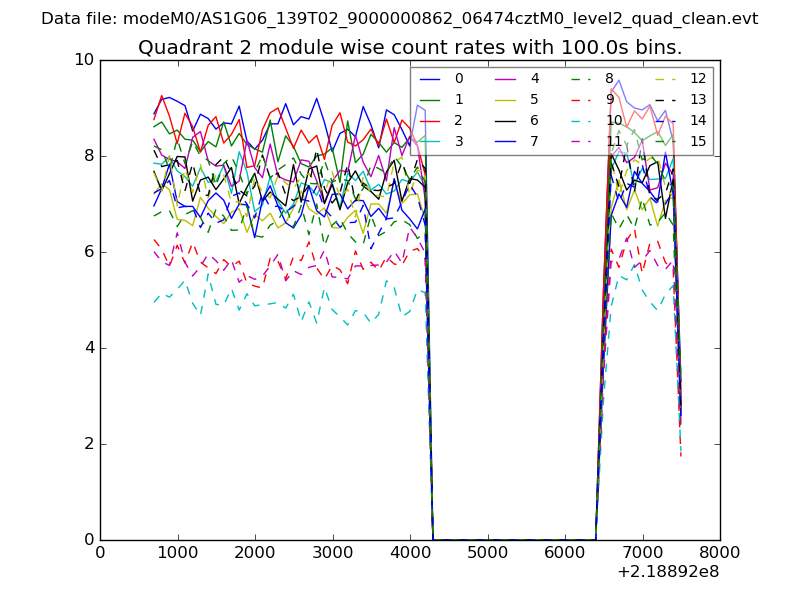
| Module-wise count rates for Quadrant B Data is divided into 100 sec bins |
 |
 |
| Module-wise count rates for Quadrant C Data is divided into 100 sec bins |
 |
 |
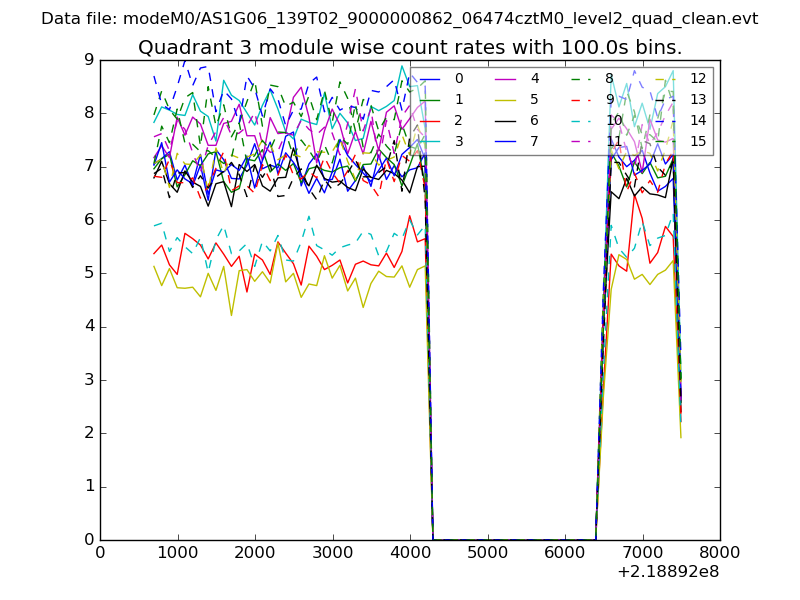
| Module-wise count rates for Quadrant D Data is divided into 100 sec bins |
 |
 |
| Parameter | Plot |
|---|---|
| CZT HV Monitor | 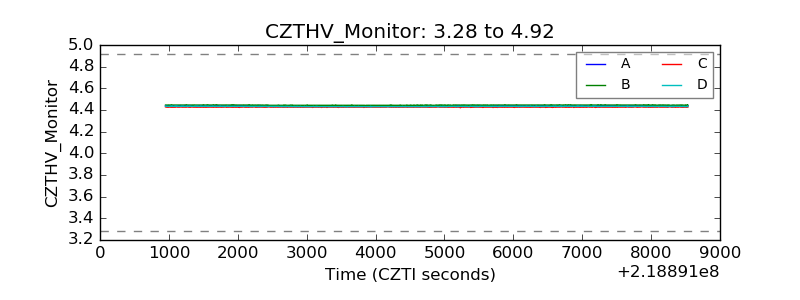 |
| D_VDD |  |
| Temperature 1 | 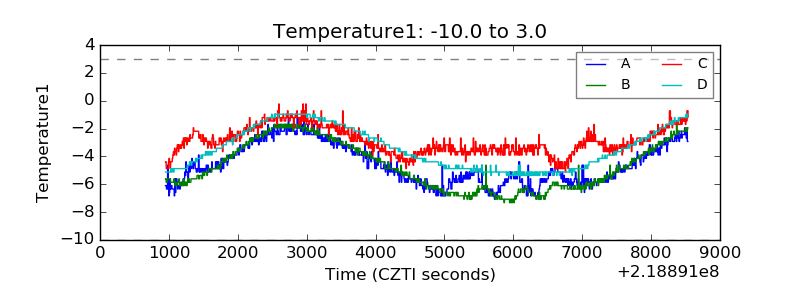 |
| Veto HV Monitor | 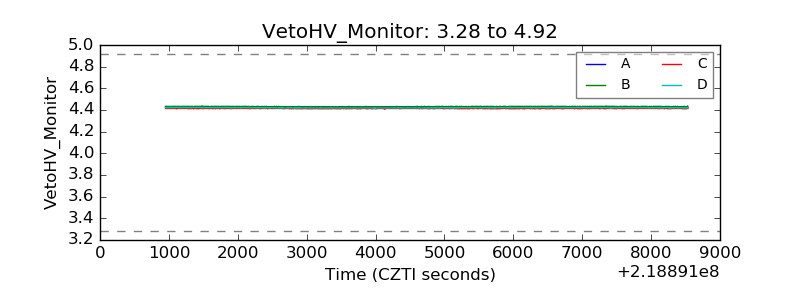 |
| Veto LLD | 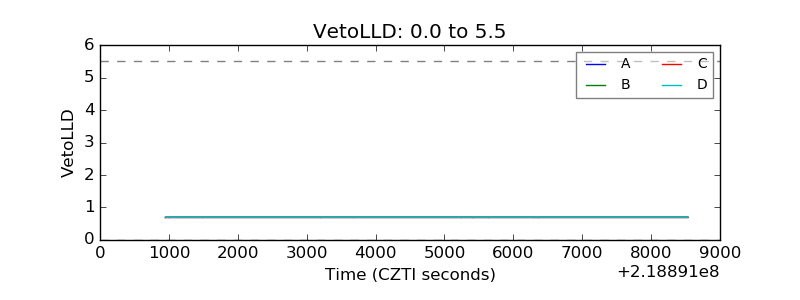 |
| Alpha Counter | 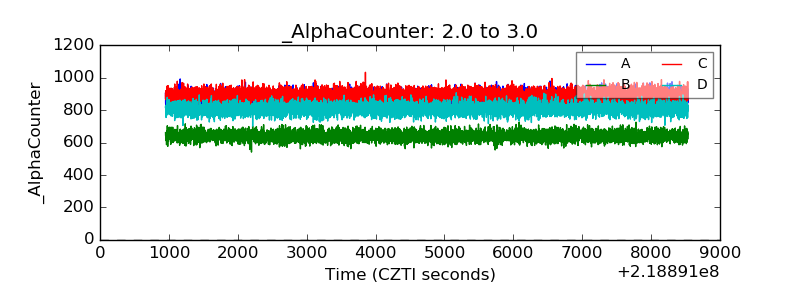 |
| _CPM_Rate | 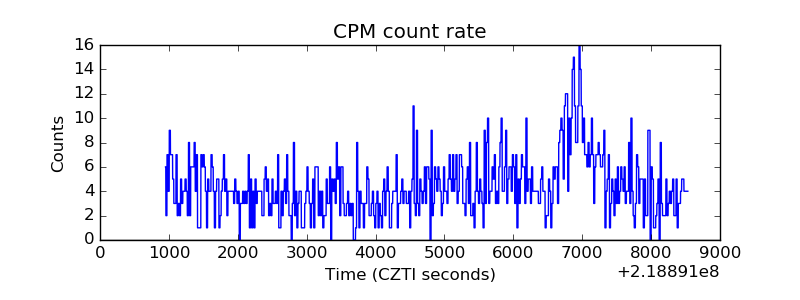 |
| CZT Counter | 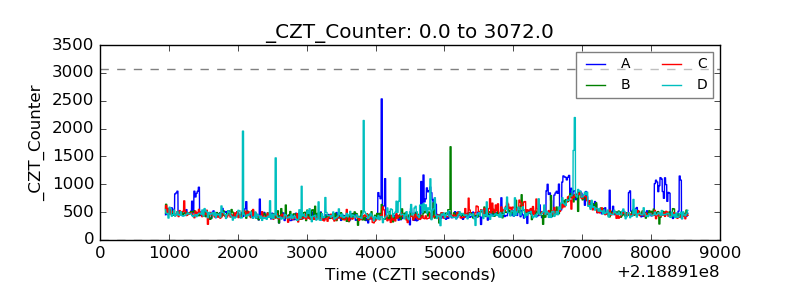 |
| +2.5 Volts monitor |  |
| +5 Volts monitor |  |
| _ROLL_ROT | 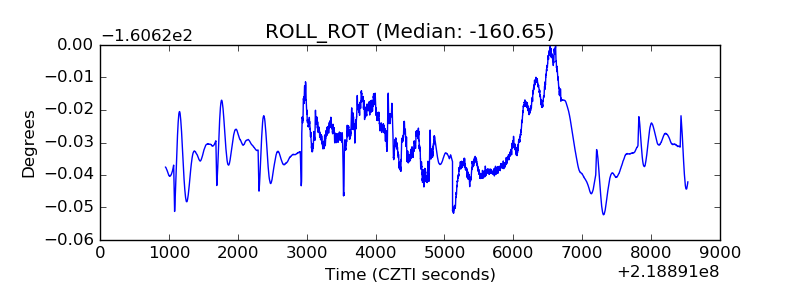 |
| _Roll_DEC | 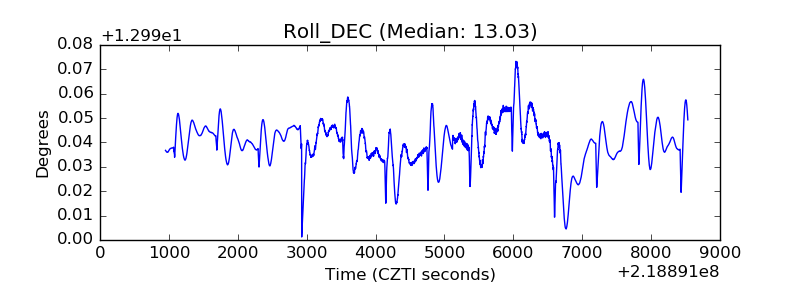 |
| _Roll_RA |  |
| Veto Counter | 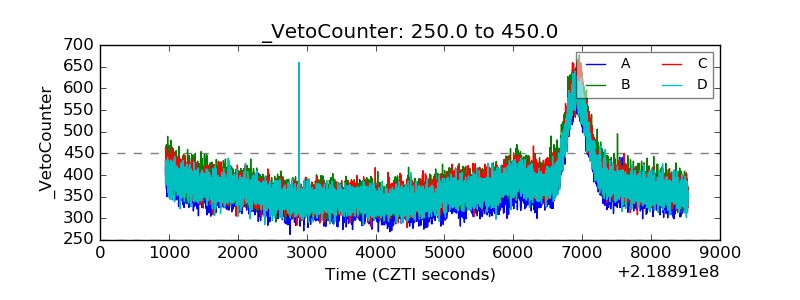 |