| Param | Original file | Final file |
|---|---|---|
| Filename | modeM0/AS1G06_139T02_9000000862_06475cztM0_level2.evt | modeM0/AS1G06_139T02_9000000862_06475cztM0_level2_quad_clean.evt |
| Size (bytes) | 484,084,800 | 93,127,680 |
| Size | 461.7 MB | 88.8 MB |
| Events in quadrant A | 3,678,127 | 586,603 |
| Events in quadrant B | 3,531,546 | 587,559 |
| Events in quadrant C | 3,290,909 | 580,521 |
| Events in quadrant D | 3,671,257 | 565,044 |
| Mode M9 | |||
|---|---|---|---|
| Quadrant | BADHDUFLAG | Total packets | Discarded packets |
| A | 0 | 1 | 0 |
| B | 0 | 1 | 0 |
| C | 0 | 1 | 0 |
| D | 0 | 1 | 0 |
| Mode M0 | |||
|---|---|---|---|
| Quadrant | BADHDUFLAG | Total packets | Discarded packets |
| A | 0 | 15899 | 2 |
| B | 0 | 15251 | 1 |
| C | 0 | 14899 | 3 |
| D | 0 | 15545 | 1 |
| Mode SS | |||
|---|---|---|---|
| Quadrant | BADHDUFLAG | Total packets | Discarded packets |
| A | 0 | 146 | 0 |
| B | 0 | 146 | 0 |
| C | 0 | 146 | 0 |
| D | 0 | 146 | 0 |
| Quadrant | Total seconds | Saturated seconds | Saturation percentage |
|---|---|---|---|
| A | 7188 | 213 | 2.963272% |
| B | 7188 | 206 | 2.865888% |
| C | 7187 | 91 | 1.266175% |
| D | 7188 | 115 | 1.599889% |
Noise dominated data is calculated using 1-second bins in cleaned event files. If a bin has >2000 counts, and if more than 50% of those come from <1% of pixels, then it is considered to be noise-dominated and hence unusable.
| Quadrant | # 1 sec bins | Bins with >0 counts | Bins with >2000 counts | High rate bins dominated by noise | Noise dominated (total time) | Noise dominated (detector-on time) | Marked lightcurve |
|---|---|---|---|---|---|---|---|
| A | 7283 | 7189 | 14 | 14 | 0.19% | 0.19% | 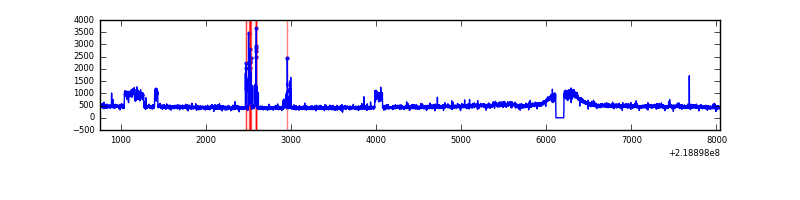 |
| B | 7283 | 7189 | 6 | 6 | 0.08% | 0.08% | 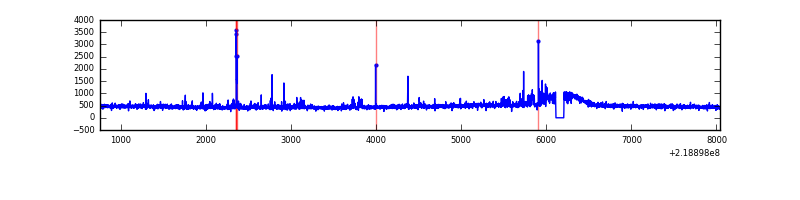 |
| C | 7283 | 7189 | 0 | 0 | 0.00% | 0.00% | 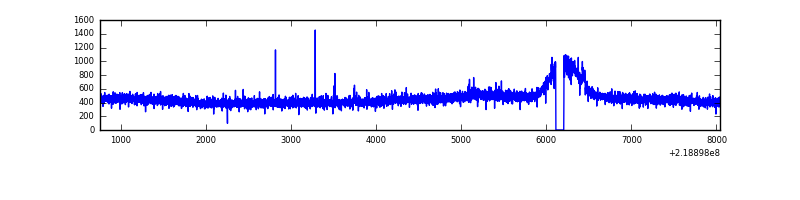 |
| D | 7283 | 7189 | 7 | 7 | 0.10% | 0.10% | 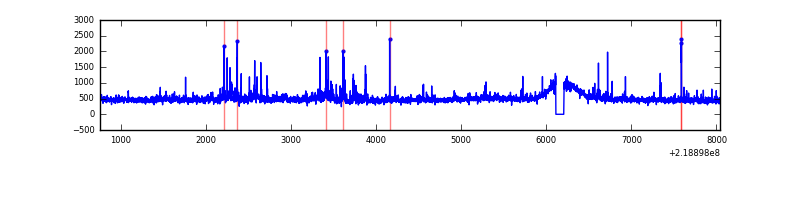 |
Top three noisy pixels from each quadrant. If the there are fewer than three noisy pixels in the level2.evt file, extra rows are filled as -1
| Pixel properties | Quadrant properties | ||||||
|---|---|---|---|---|---|---|---|
| Quadrant | DetID | PixID | Counts | Sigma | Mean | Median | Sigma |
| A | 15 | 236 | 228470 | 1279.81 | 863 | 845 | 177.9 |
| A | 15 | 174 | 104763 | 584.27 | 863 | 845 | 177.9 |
| A | 10 | 133 | 13973 | 73.81 | 863 | 845 | 177.9 |
| B | 0 | 228 | 52534 | 307.51 | 863 | 840 | 168.1 |
| B | 4 | 81 | 51245 | 299.84 | 863 | 840 | 168.1 |
| B | 0 | 214 | 36253 | 210.66 | 863 | 840 | 168.1 |
| C | 8 | 128 | 13371 | 64.04 | 833 | 835 | 195.8 |
| C | 12 | 4 | 7774 | 35.45 | 833 | 835 | 195.8 |
| C | 1 | 16 | 7096 | 31.98 | 833 | 835 | 195.8 |
| D | 8 | 195 | 134560 | 642.41 | 842 | 815 | 208.2 |
| D | 2 | 152 | 105929 | 504.89 | 842 | 815 | 208.2 |
| D | 13 | 172 | 53766 | 254.34 | 842 | 815 | 208.2 |
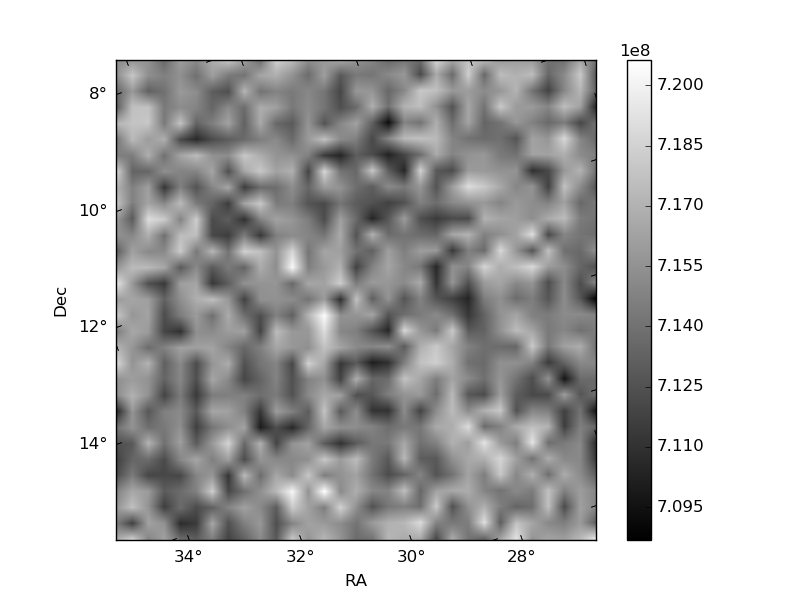
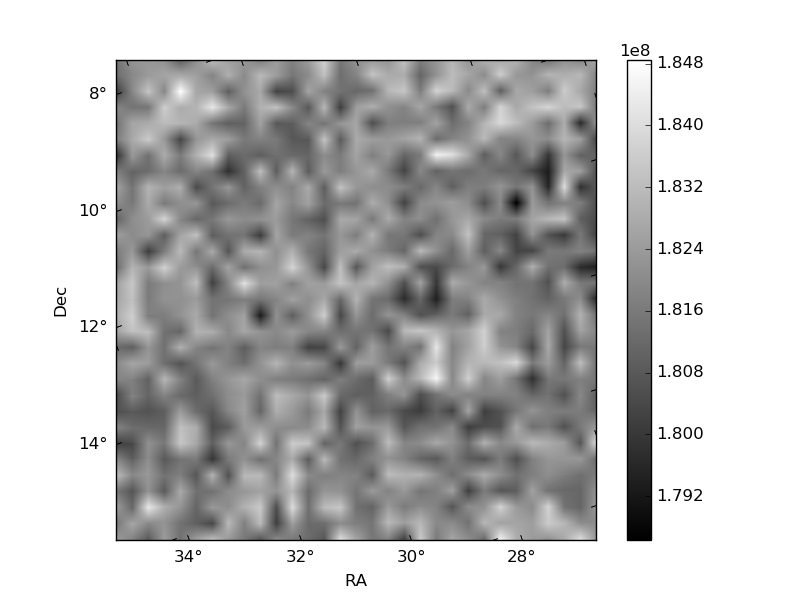
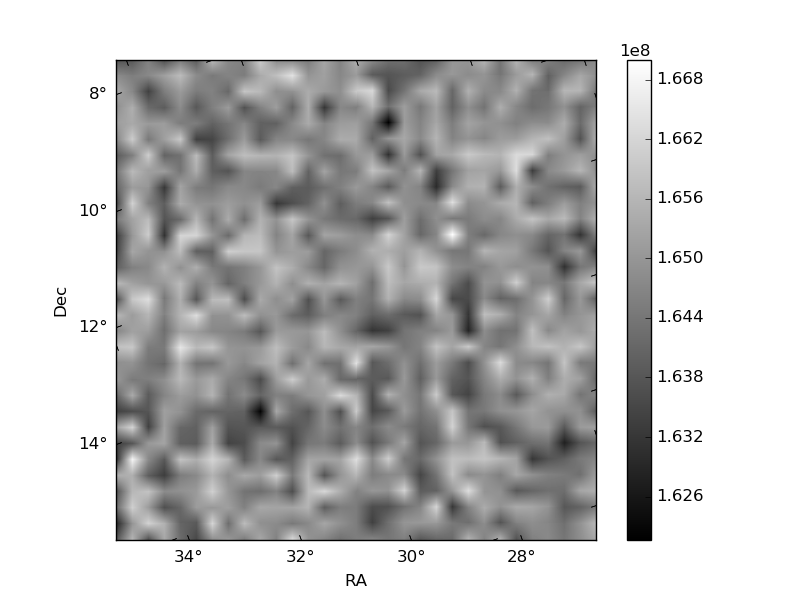
Histogram calculated using DETX and DETY for each event in the final _common_clean file
| Quadrant A | 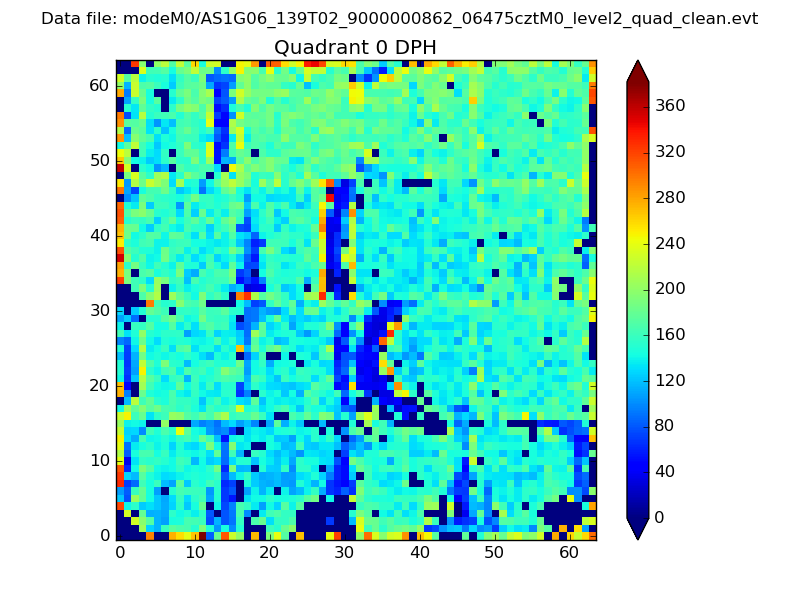 |
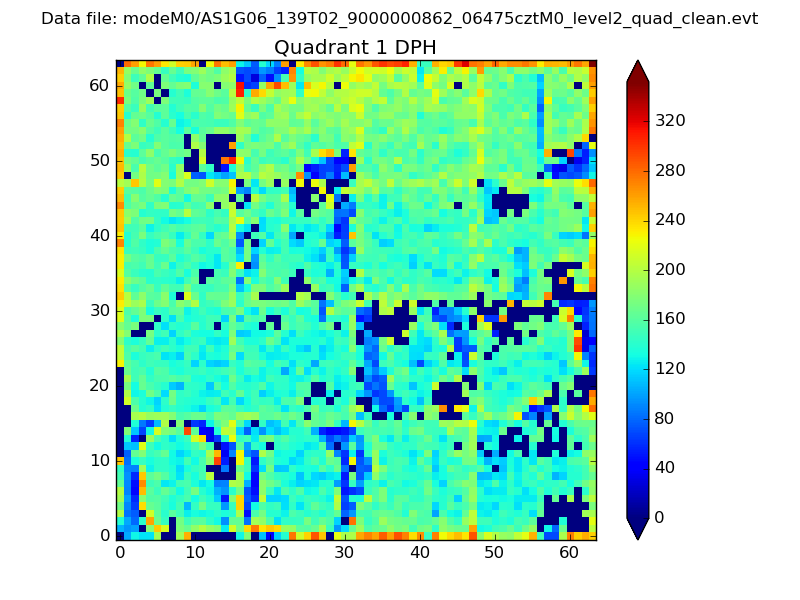 |
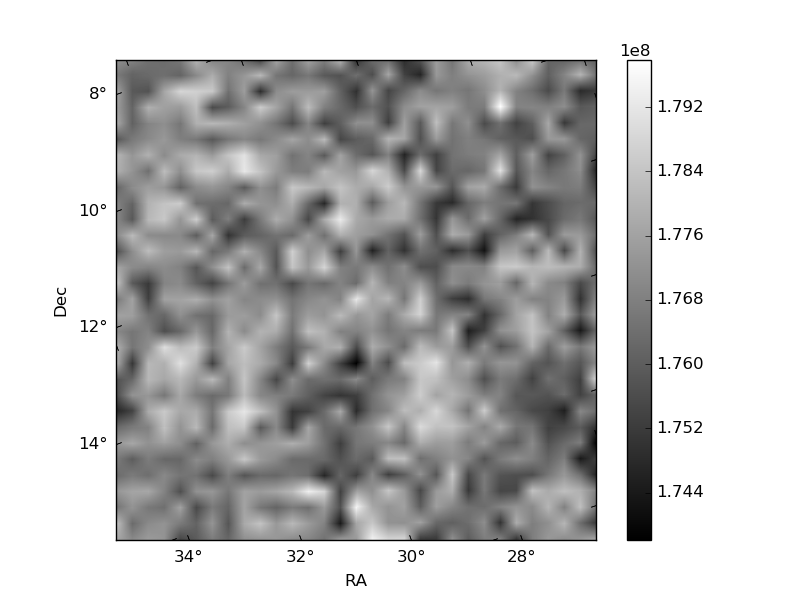
Quadrant B |
|---|---|---|---|
| Quadrant D | 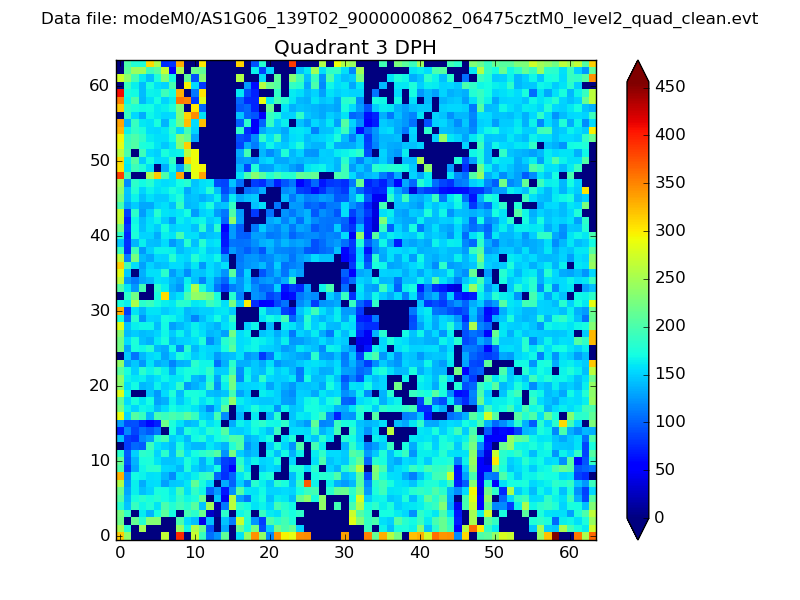 |
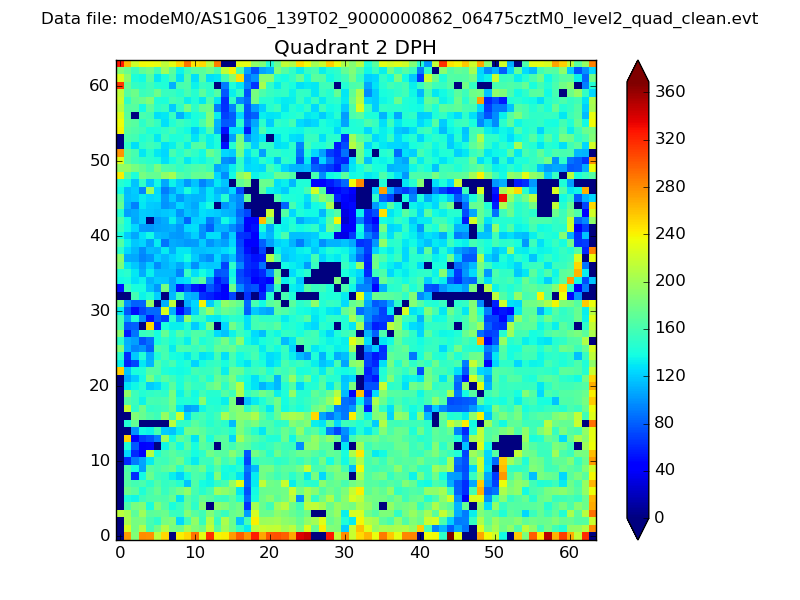 |
Quadrant C |
| Plot type | Count rate plots | Images |
|---|---|---|
| Comparison with Poisson distribution Blue bars denote a histogram of data divided into 1 sec bins. Red curve is a Poisson curve with rate = median count rate of data. |
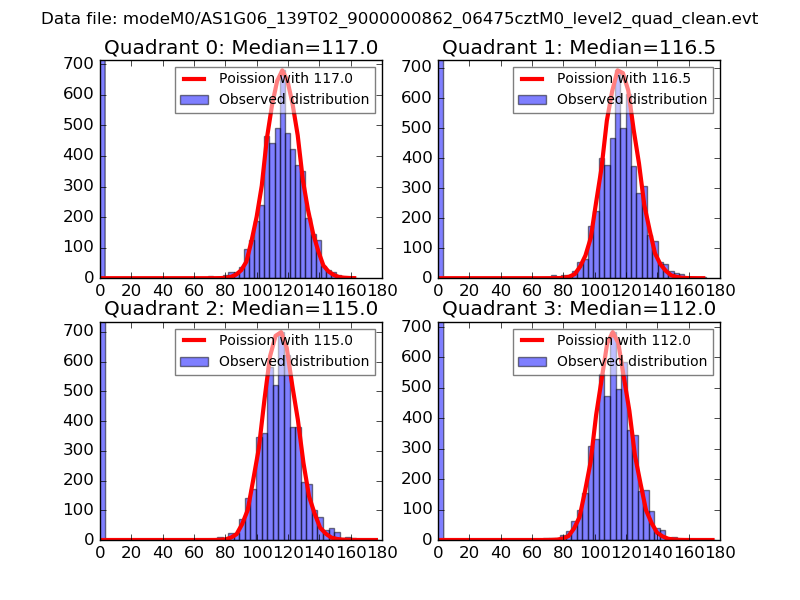 |
 |
| Quadrant-wise count rates Data is divided into 100 sec bins |
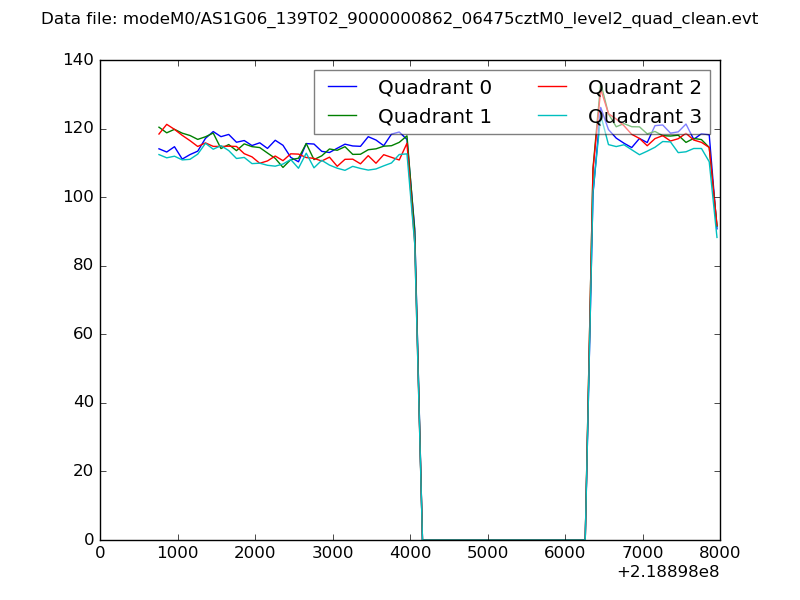 |
|
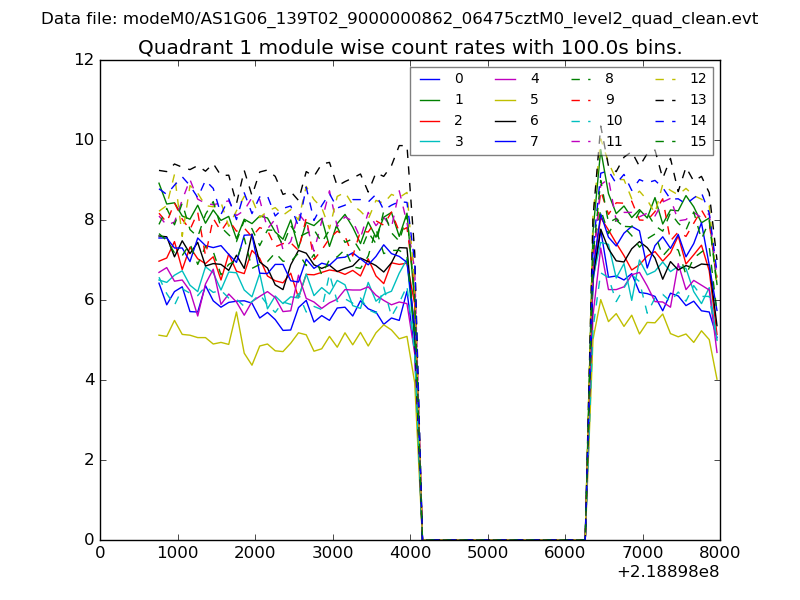
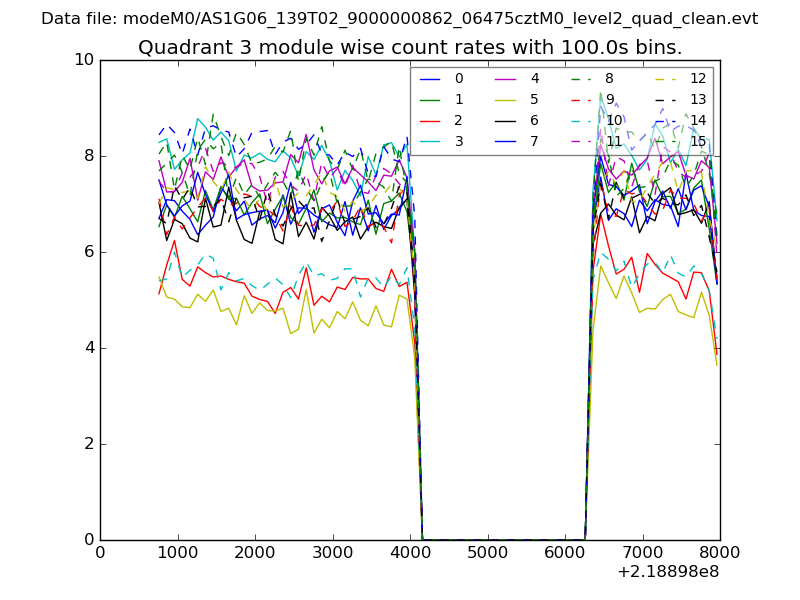
| Module-wise count rates for Quadrant A Data is divided into 100 sec bins |
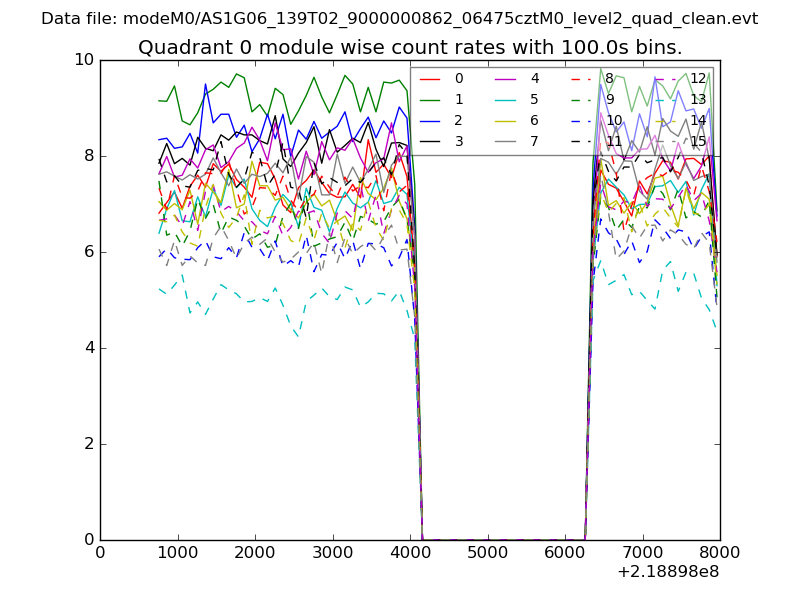 |
 |
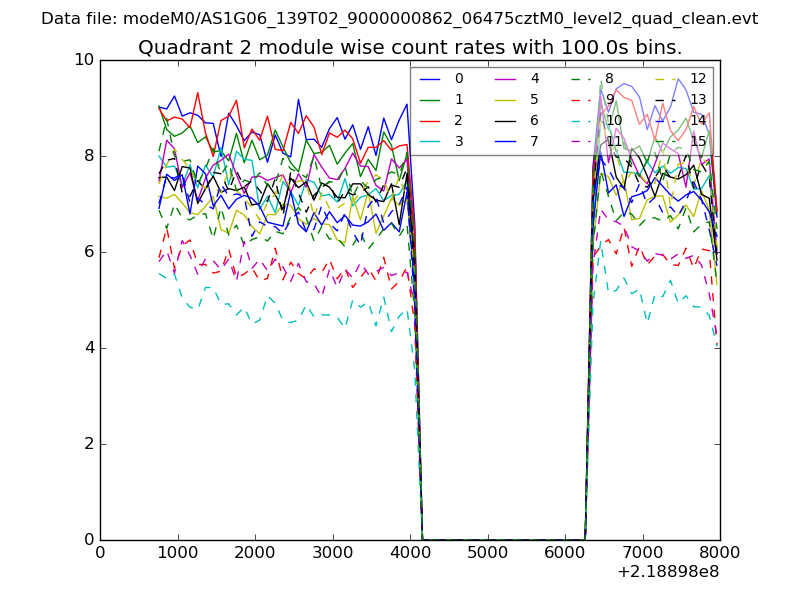
| Module-wise count rates for Quadrant B Data is divided into 100 sec bins |
 |
 |
| Module-wise count rates for Quadrant C Data is divided into 100 sec bins |
 |
 |
| Module-wise count rates for Quadrant D Data is divided into 100 sec bins |
 |
 |
| Parameter | Plot |
|---|---|
| CZT HV Monitor | 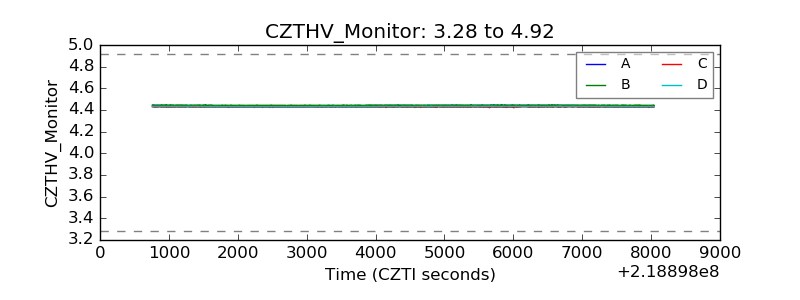 |
| D_VDD | 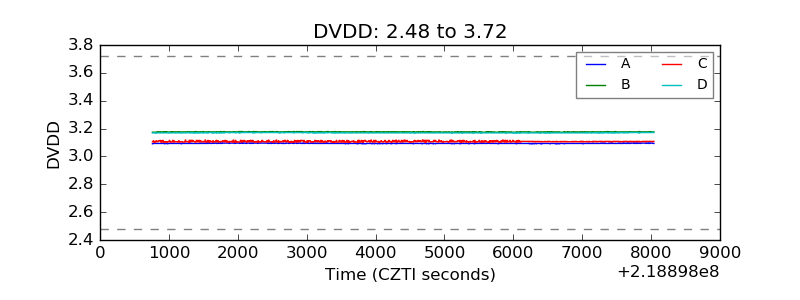 |
| Temperature 1 | 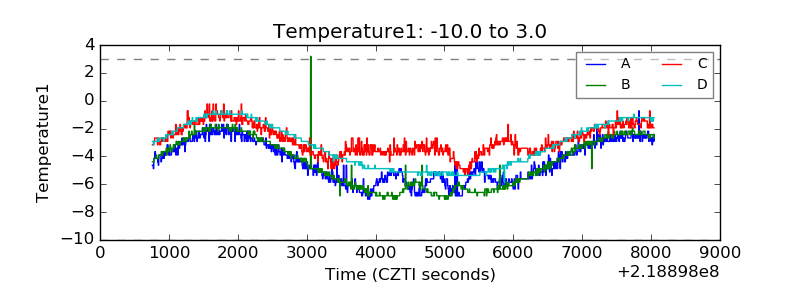 |
| Veto HV Monitor | 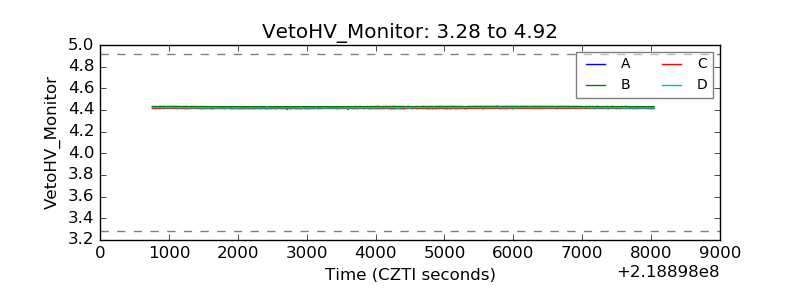 |
| Veto LLD | 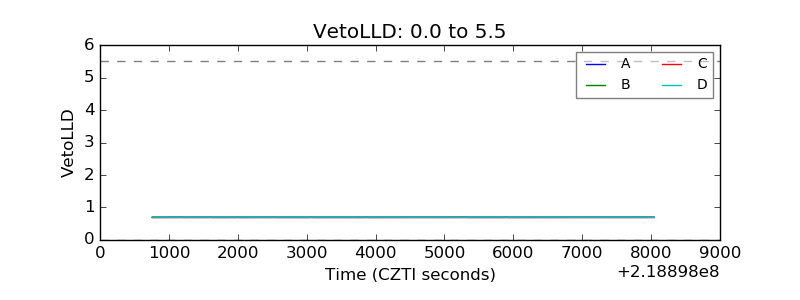 |
| Alpha Counter | 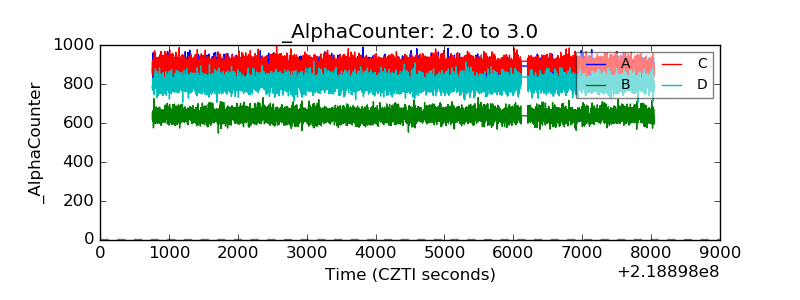 |
| _CPM_Rate | 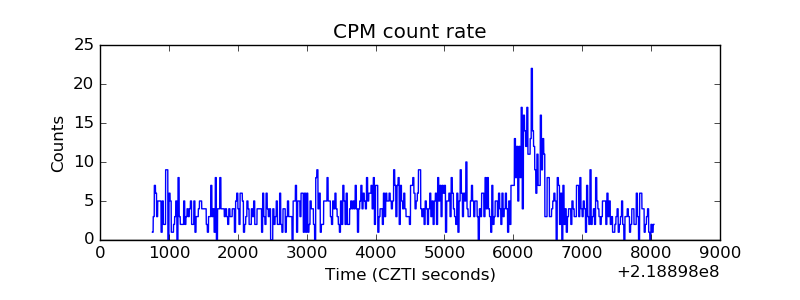 |
| CZT Counter | 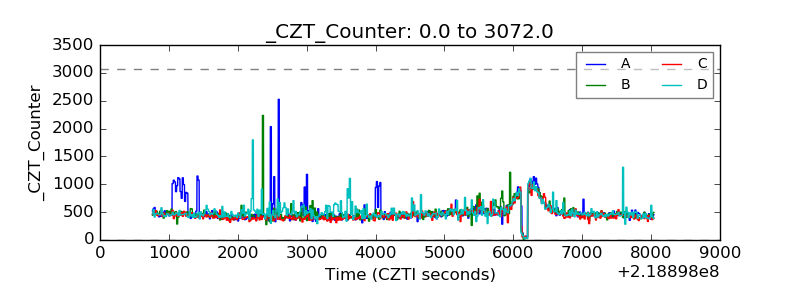 |
| +2.5 Volts monitor |  |
| +5 Volts monitor |  |
| _ROLL_ROT | 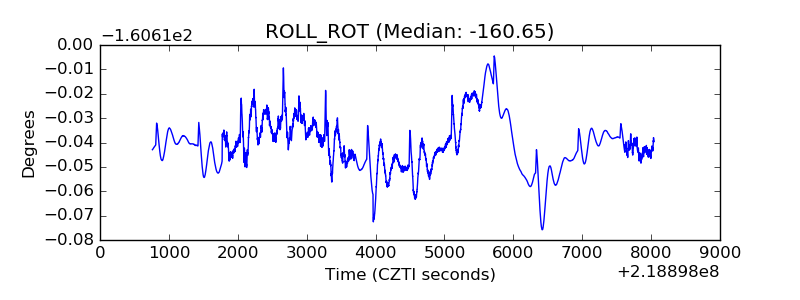 |
| _Roll_DEC | 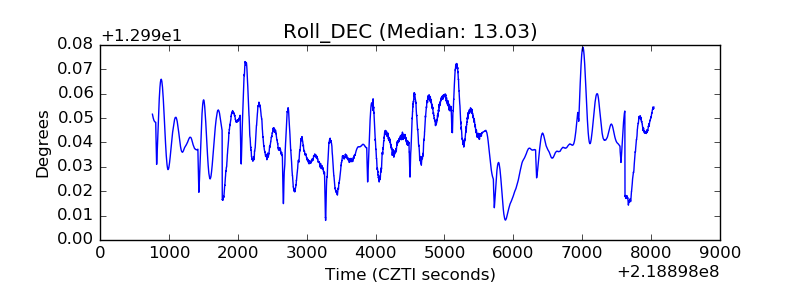 |
| _Roll_RA | 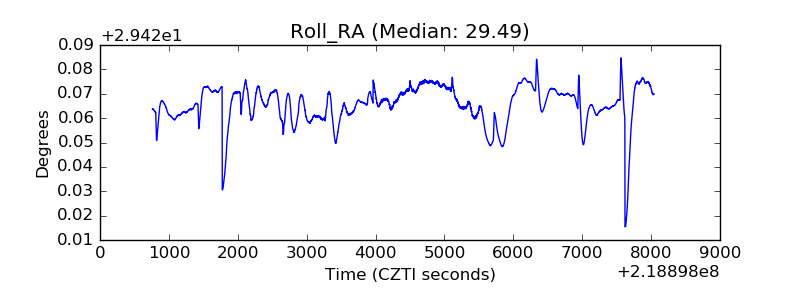 |
| Veto Counter | 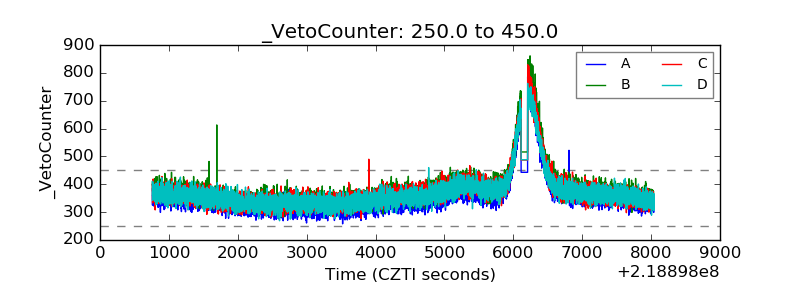 |