| Param | Original file | Final file |
|---|---|---|
| Filename | modeM0/AS1G06_139T02_9000000862_06478cztM0_level2.evt | modeM0/AS1G06_139T02_9000000862_06478cztM0_level2_quad_clean.evt |
| Size (bytes) | 237,260,160 | 63,074,880 |
| Size | 226.3 MB | 60.2 MB |
| Events in quadrant A | 1,664,916 | 416,918 |
| Events in quadrant B | 1,770,432 | 414,339 |
| Events in quadrant C | 1,617,270 | 408,973 |
| Events in quadrant D | 1,869,899 | 398,492 |
| Mode M0 | |||
|---|---|---|---|
| Quadrant | BADHDUFLAG | Total packets | Discarded packets |
| A | 0 | 7791 | 0 |
| B | 0 | 7930 | 0 |
| C | 0 | 7772 | 0 |
| D | 0 | 8306 | 0 |
| Mode SS | |||
|---|---|---|---|
| Quadrant | BADHDUFLAG | Total packets | Discarded packets |
| A | 0 | 76 | 0 |
| B | 0 | 76 | 0 |
| C | 0 | 76 | 0 |
| D | 0 | 76 | 0 |
| Quadrant | Total seconds | Saturated seconds | Saturation percentage |
|---|---|---|---|
| A | 3840 | 5 | 0.130208% |
| B | 3840 | 12 | 0.312500% |
| C | 3840 | 1 | 0.026042% |
| D | 3840 | 24 | 0.625000% |
Noise dominated data is calculated using 1-second bins in cleaned event files. If a bin has >2000 counts, and if more than 50% of those come from <1% of pixels, then it is considered to be noise-dominated and hence unusable.
| Quadrant | # 1 sec bins | Bins with >0 counts | Bins with >2000 counts | High rate bins dominated by noise | Noise dominated (total time) | Noise dominated (detector-on time) | Marked lightcurve |
|---|---|---|---|---|---|---|---|
| A | 3840 | 3840 | 0 | 0 | 0.00% | 0.00% | 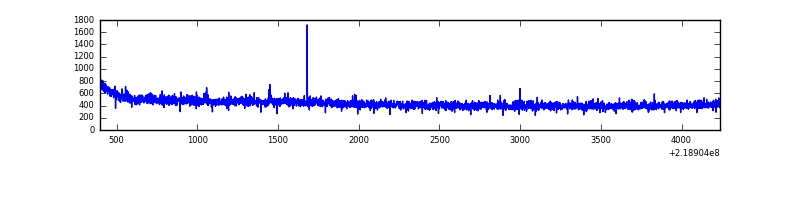 |
| B | 3840 | 3840 | 0 | 0 | 0.00% | 0.00% | 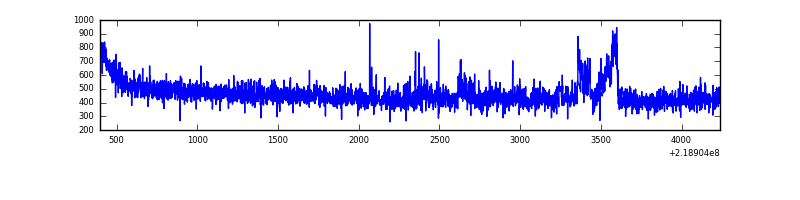 |
| C | 3840 | 3840 | 0 | 0 | 0.00% | 0.00% | 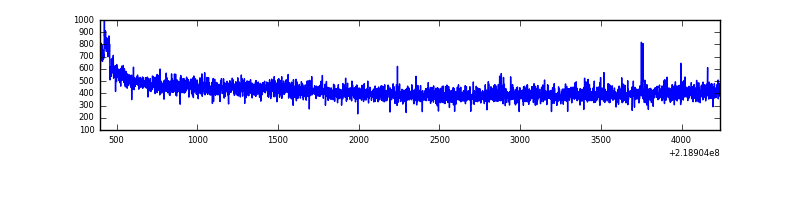 |
| D | 3840 | 3840 | 22 | 22 | 0.57% | 0.57% | 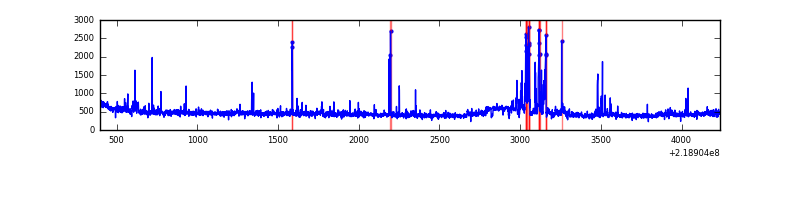 |
Top three noisy pixels from each quadrant. If the there are fewer than three noisy pixels in the level2.evt file, extra rows are filled as -1
| Pixel properties | Quadrant properties | ||||||
|---|---|---|---|---|---|---|---|
| Quadrant | DetID | PixID | Counts | Sigma | Mean | Median | Sigma |
| A | 10 | 133 | 5681 | 58.36 | 429 | 420 | 90.1 |
| A | 8 | 15 | 4812 | 48.72 | 429 | 420 | 90.1 |
| A | 12 | 194 | 4065 | 40.43 | 429 | 420 | 90.1 |
| B | 0 | 228 | 84243 | 993.04 | 428 | 417 | 84.4 |
| B | 15 | 204 | 10603 | 120.67 | 428 | 417 | 84.4 |
| B | 12 | 111 | 8266 | 92.98 | 428 | 417 | 84.4 |
| C | 1 | 16 | 6277 | 60.36 | 412 | 415 | 97.1 |
| C | 13 | 61 | 3262 | 29.31 | 412 | 415 | 97.1 |
| C | 9 | 54 | 2642 | 22.93 | 412 | 415 | 97.1 |
| D | 2 | 152 | 78483 | 754.82 | 416 | 403 | 103.4 |
| D | 2 | 14 | 68485 | 658.17 | 416 | 403 | 103.4 |
| D | 13 | 137 | 64152 | 616.28 | 416 | 403 | 103.4 |
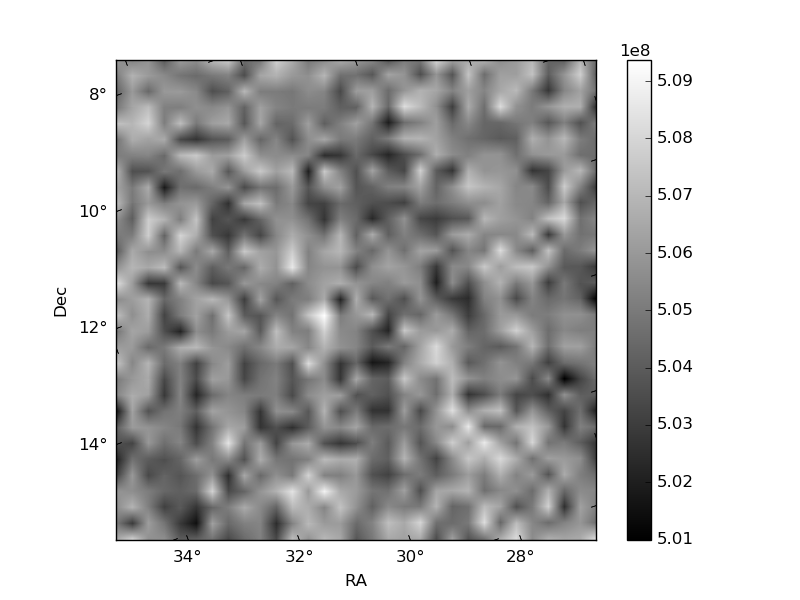
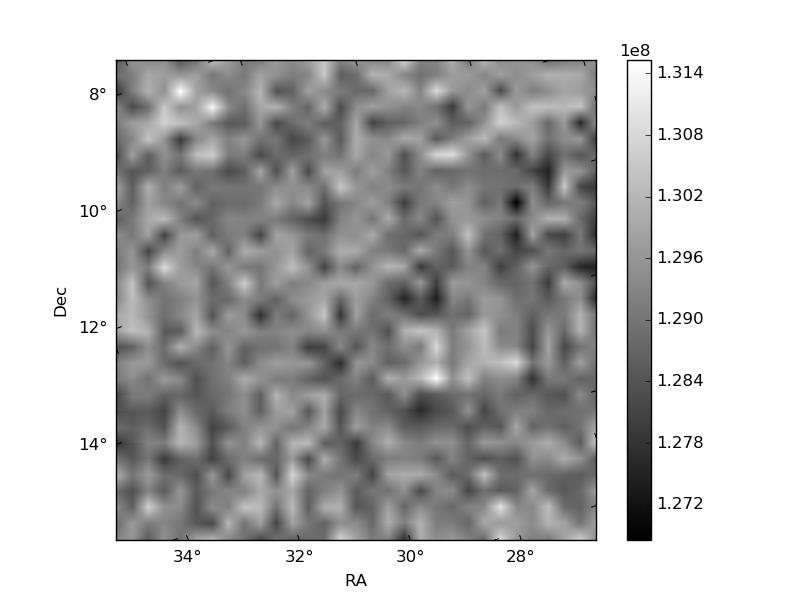
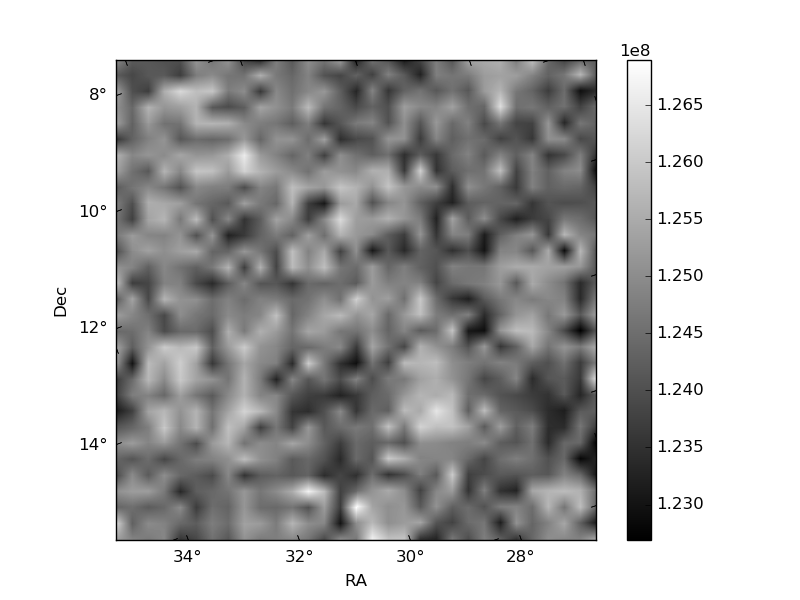
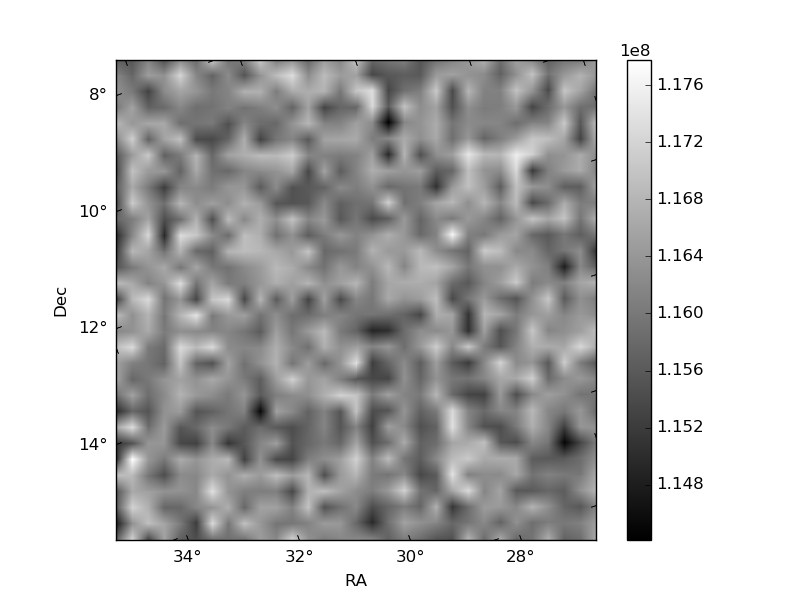
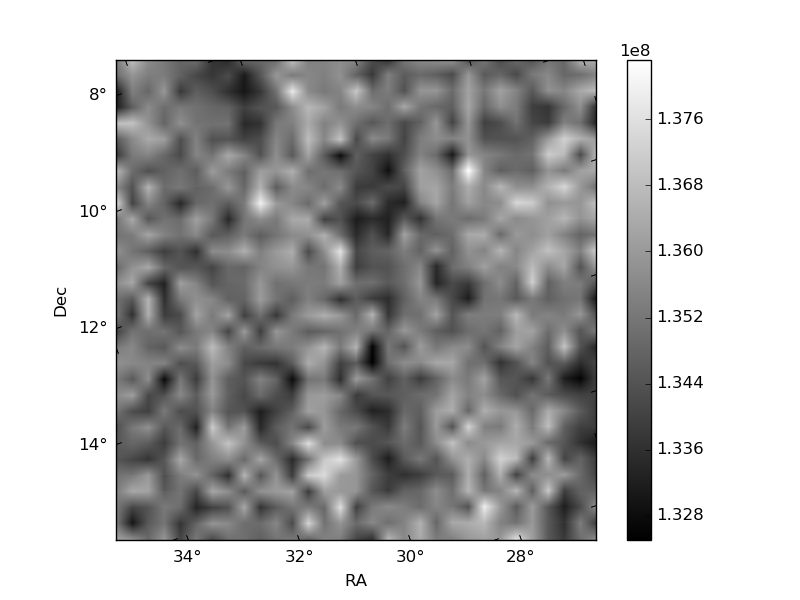
Histogram calculated using DETX and DETY for each event in the final _common_clean file
| Quadrant A | 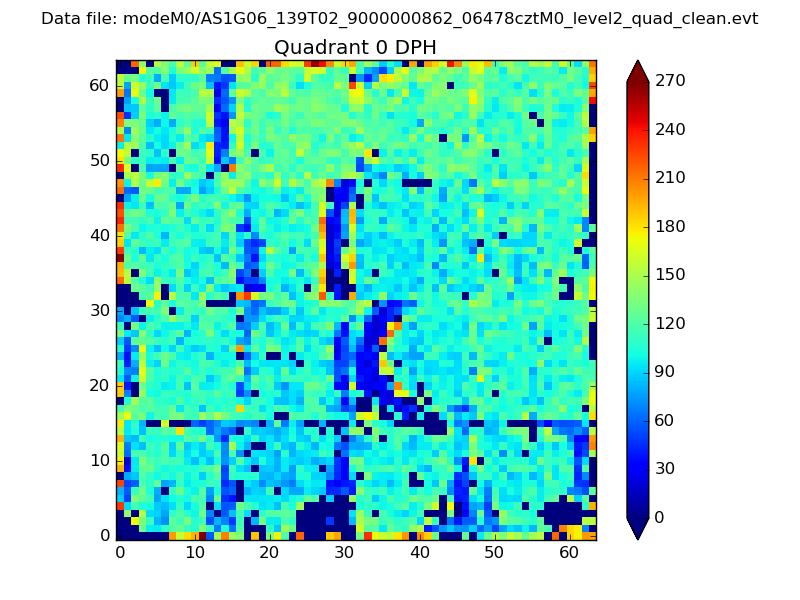 |
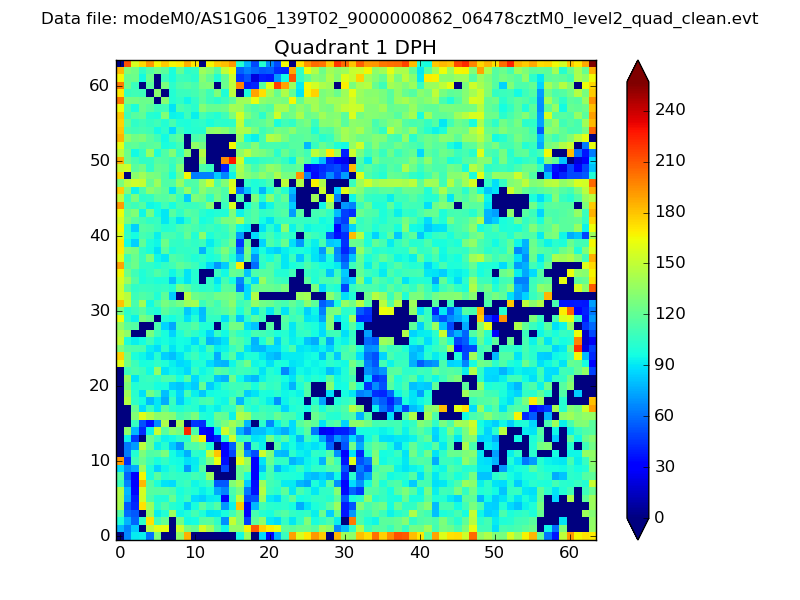 |
Quadrant B |
|---|---|---|---|
| Quadrant D | 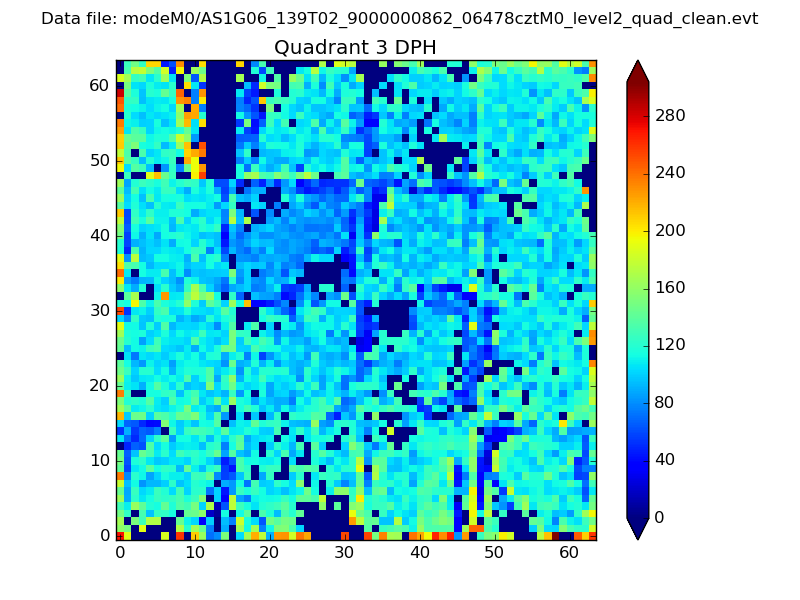 |
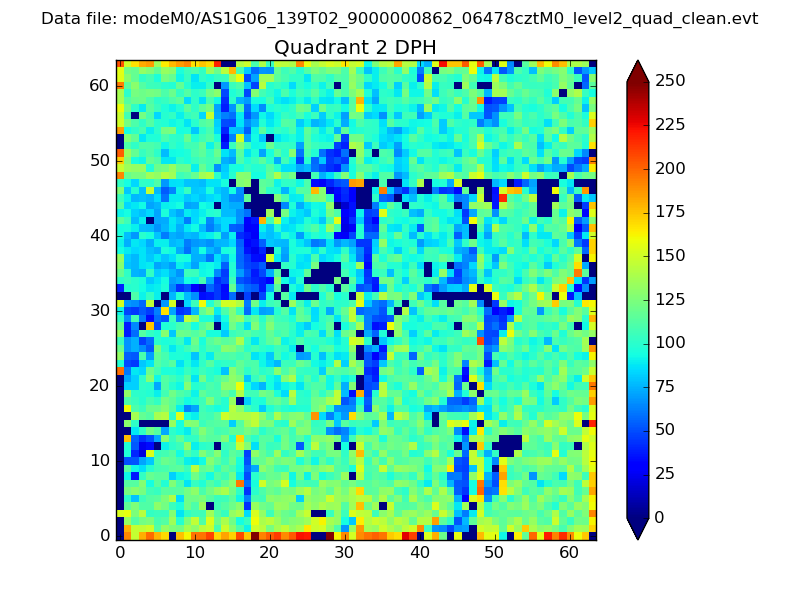 |
Quadrant C |
| Plot type | Count rate plots | Images |
|---|---|---|
| Comparison with Poisson distribution Blue bars denote a histogram of data divided into 1 sec bins. Red curve is a Poisson curve with rate = median count rate of data. |
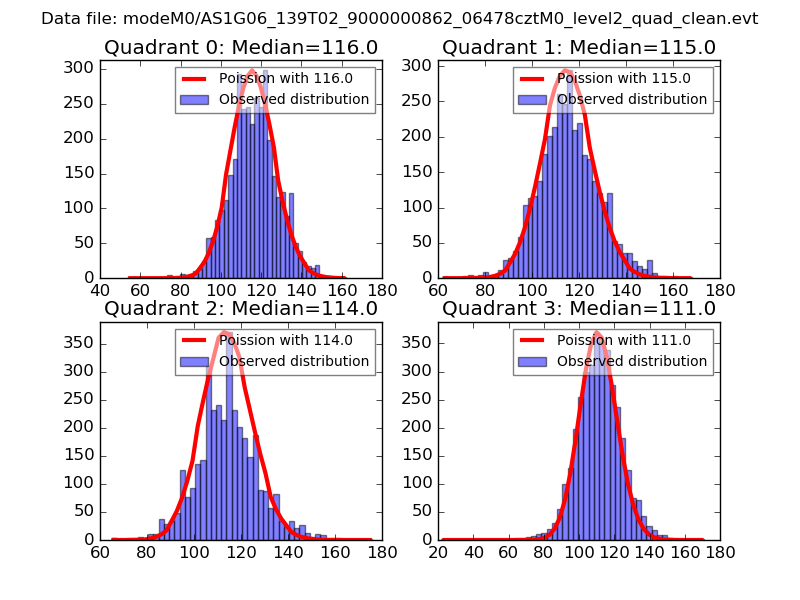 |
 |
| Quadrant-wise count rates Data is divided into 100 sec bins |
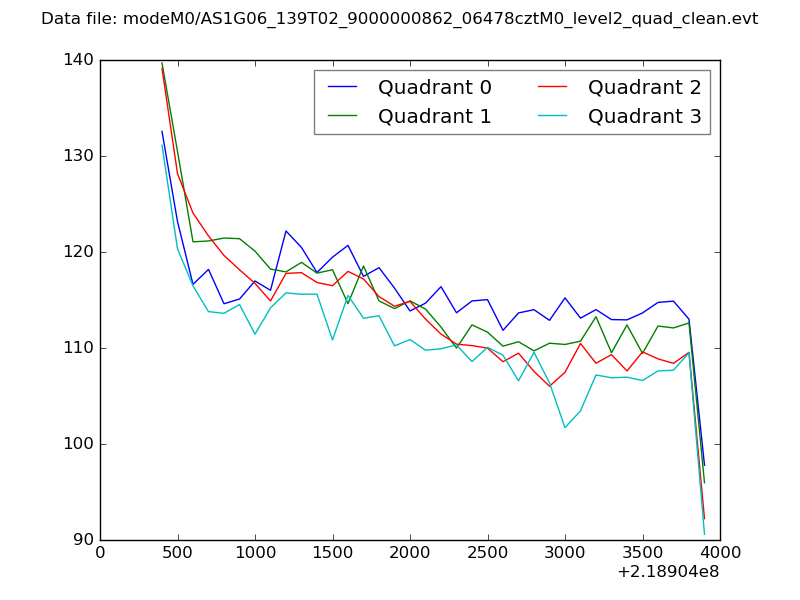 |
|
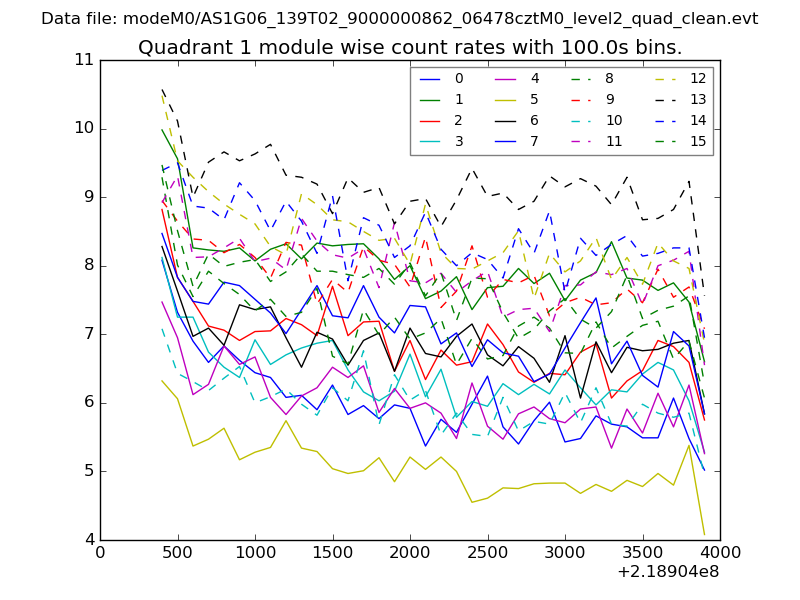
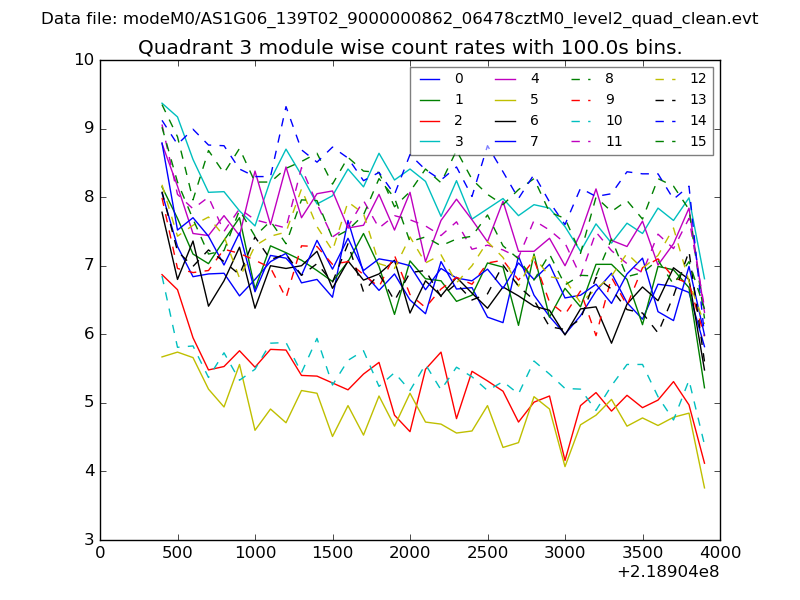
| Module-wise count rates for Quadrant A Data is divided into 100 sec bins |
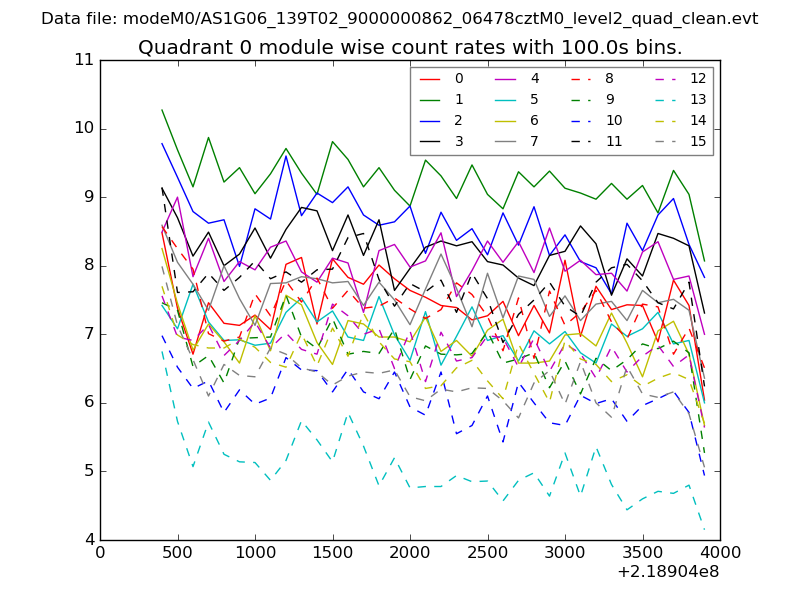 |
 |
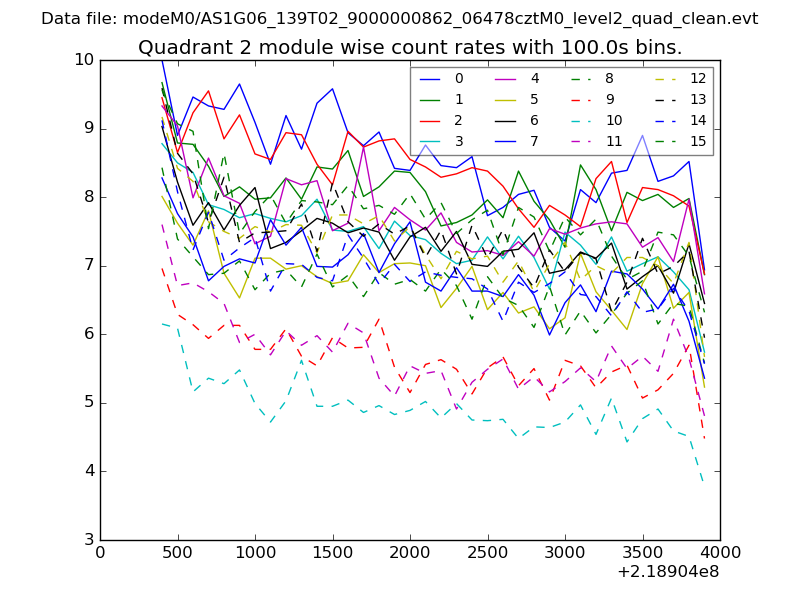
| Module-wise count rates for Quadrant B Data is divided into 100 sec bins |
 |
 |
| Module-wise count rates for Quadrant C Data is divided into 100 sec bins |
 |
 |
| Module-wise count rates for Quadrant D Data is divided into 100 sec bins |
 |
 |
| Parameter | Plot |
|---|---|
| CZT HV Monitor | 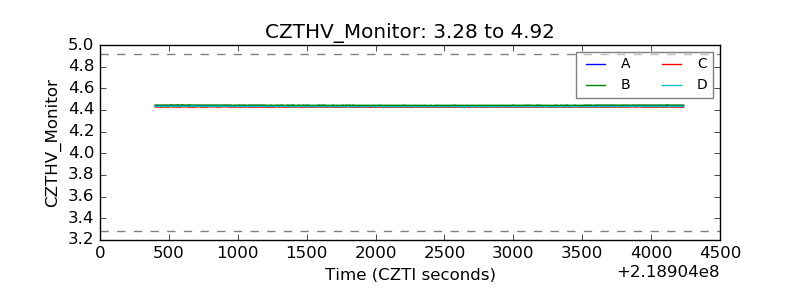 |
| D_VDD | 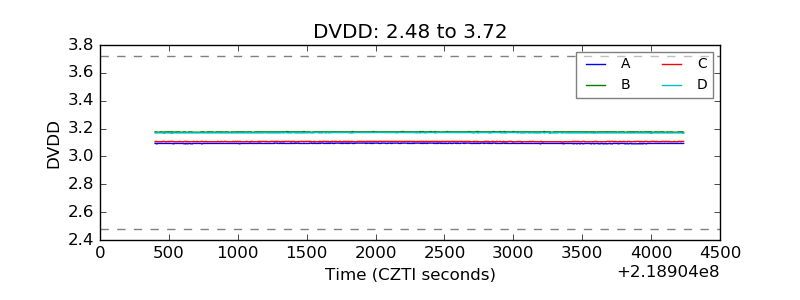 |
| Temperature 1 | 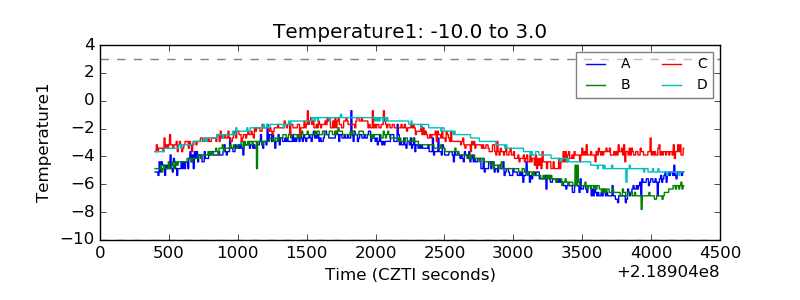 |
| Veto HV Monitor | 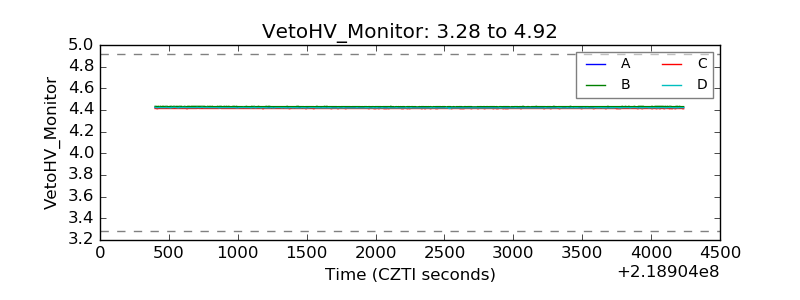 |
| Veto LLD | 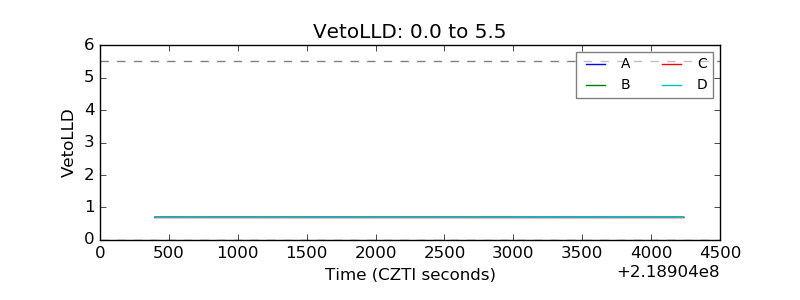 |
| Alpha Counter | 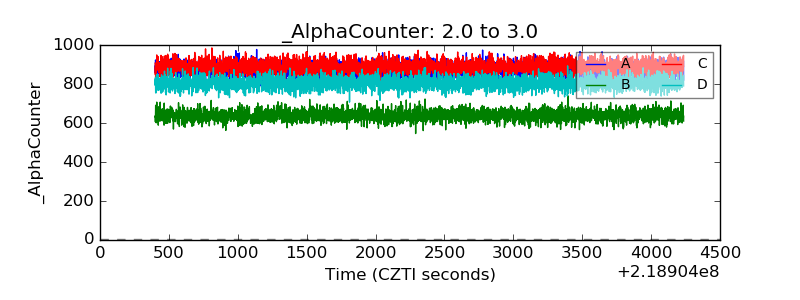 |
| _CPM_Rate | 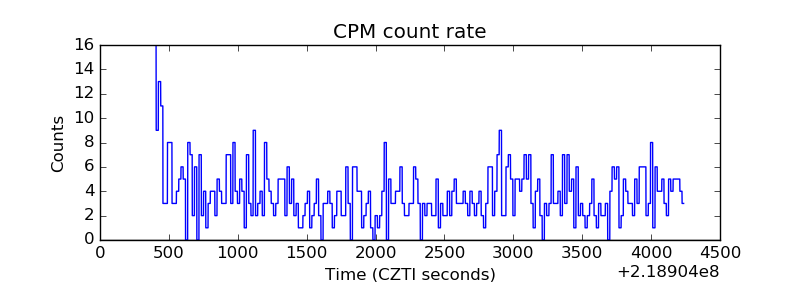 |
| CZT Counter | 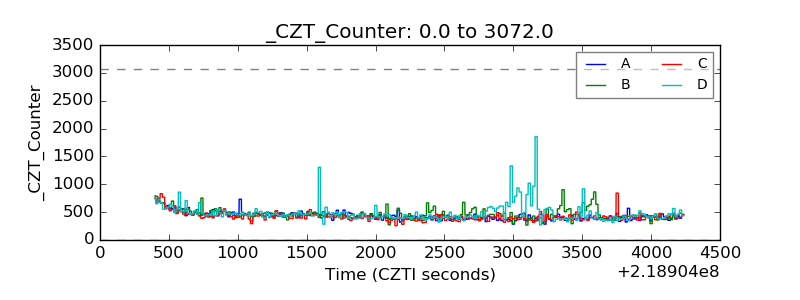 |
| +2.5 Volts monitor |  |
| +5 Volts monitor |  |
| _ROLL_ROT | 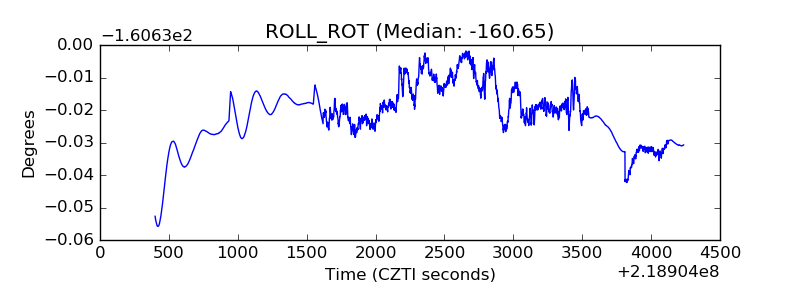 |
| _Roll_DEC | 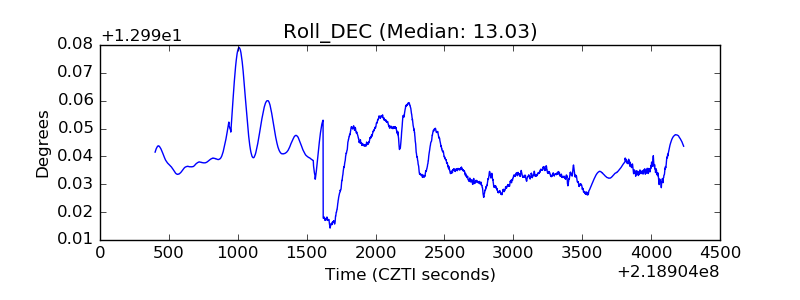 |
| _Roll_RA | 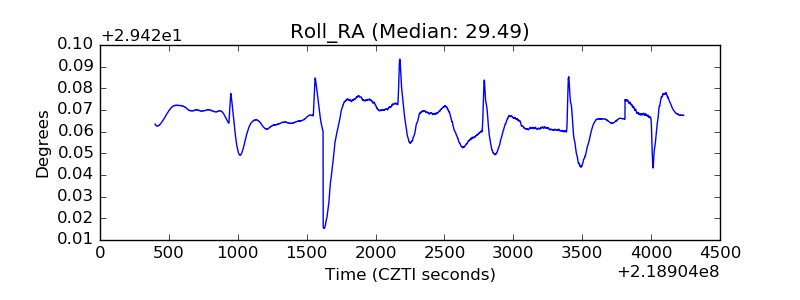 |
| Veto Counter | 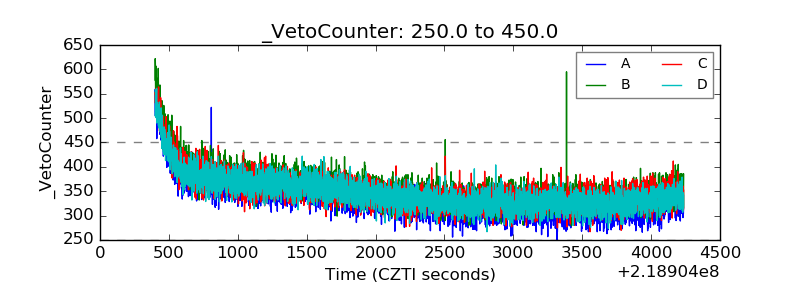 |