| Param | Original file | Final file |
|---|---|---|
| Filename | modeM0/AS1A02_046T01_9000000864cztM0_level2.fits | modeM0/AS1A02_046T01_9000000864cztM0_level2_quad_clean.evt |
| Size (bytes) | 476,015,040 | 524,600,640 |
| Size | 454.0 MB | 500.3 MB |
| Events in quadrant A | 2,859,036 | 3,220,948 |
| Events in quadrant B | 2,763,038 | 3,211,776 |
| Events in quadrant C | 2,797,700 | 3,046,325 |
| Events in quadrant D | 2,424,810 | 2,837,280 |
| Mode M0 | |||
|---|---|---|---|
| Quadrant | BADHDUFLAG | Total packets | Discarded packets |
| A | 0 | 108318 | 0 |
| B | 0 | 110633 | 0 |
| C | 0 | 106578 | 0 |
| D | 0 | 112470 | 0 |
| Mode SS | |||
|---|---|---|---|
| Quadrant | BADHDUFLAG | Total packets | Discarded packets |
| A | 0 | 1062 | 0 |
| B | 0 | 1062 | 0 |
| C | 0 | 1062 | 0 |
| D | 0 | 1062 | 0 |
| Mode M9 | |||
|---|---|---|---|
| Quadrant | BADHDUFLAG | Total packets | Discarded packets |
| A | 0 | 101 | 0 |
| B | 0 | 101 | 0 |
| C | 0 | 101 | 0 |
| D | 0 | 101 | 0 |
| Quadrant | Total seconds | Saturated seconds | Saturation percentage |
|---|---|---|---|
| A | 52053 | 458 | 0.879872% |
| B | 52053 | 534 | 1.025877% |
| C | 52053 | 219 | 0.420725% |
| D | 52053 | 407 | 0.781895% |
Noise dominated data is calculated using 1-second bins in cleaned event files. If a bin has >2000 counts, and if more than 50% of those come from <1% of pixels, then it is considered to be noise-dominated and hence unusable.
| Quadrant | # 1 sec bins | Bins with >0 counts | Bins with >2000 counts | High rate bins dominated by noise | Noise dominated (total time) | Noise dominated (detector-on time) | Marked lightcurve |
|---|---|---|---|---|---|---|---|
| A | 62178 | 52052 | 0 | 0 | 0.00% | 0.00% |  |
| B | 62178 | 52045 | 0 | 0 | 0.00% | 0.00% | 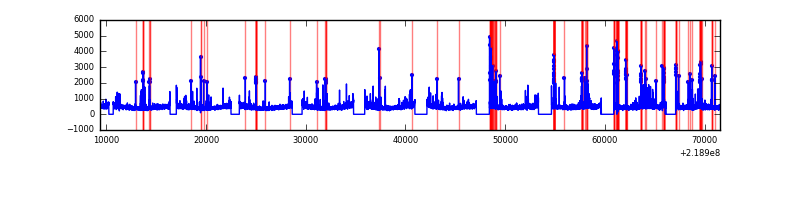 |
| C | 62178 | 52053 | 0 | 0 | 0.00% | 0.00% |  |
| D | 62178 | 52041 | 0 | 0 | 0.00% | 0.00% |  |
Top three noisy pixels from each quadrant. If the there are fewer than three noisy pixels in the level2.evt file, extra rows are filled as -1
| Pixel properties | Quadrant properties | ||||||
|---|---|---|---|---|---|---|---|
| Quadrant | DetID | PixID | Counts | Sigma | Mean | Median | Sigma |
| A | 14 | 188 | 2837 | 11.4 | 743 | 697 | 187.7 |
| A | 0 | 29 | 2728 | 10.82 | 743 | 697 | 187.7 |
| A | 7 | 110 | 2494 | 9.57 | 743 | 697 | 187.7 |
| B | 2 | 9 | 2423 | 11.93 | 729 | 698 | 144.6 |
| B | 14 | 254 | 1880 | 8.17 | 729 | 698 | 144.6 |
| B | 3 | 17 | 1865 | 8.07 | 729 | 698 | 144.6 |
| C | 1 | 81 | 2122 | 7.25 | 739 | 686 | 198.0 |
| C | 1 | 80 | 2110 | 7.19 | 739 | 686 | 198.0 |
| C | 12 | 241 | 1987 | 6.57 | 739 | 686 | 198.0 |
| D | 6 | 231 | 1826 | 6.41 | 691 | 629 | 186.5 |
| D | 11 | 82 | 1816 | 6.36 | 691 | 629 | 186.5 |
| D | 3 | 14 | 1810 | 6.33 | 691 | 629 | 186.5 |
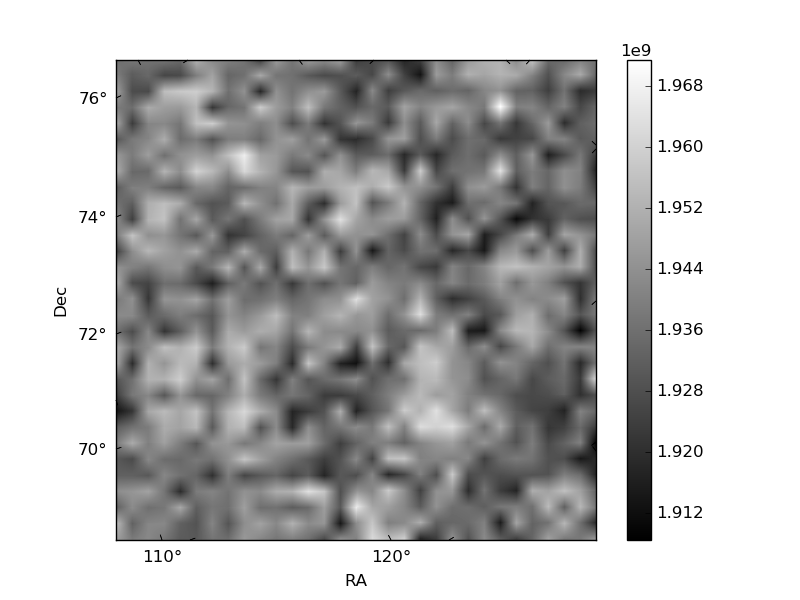
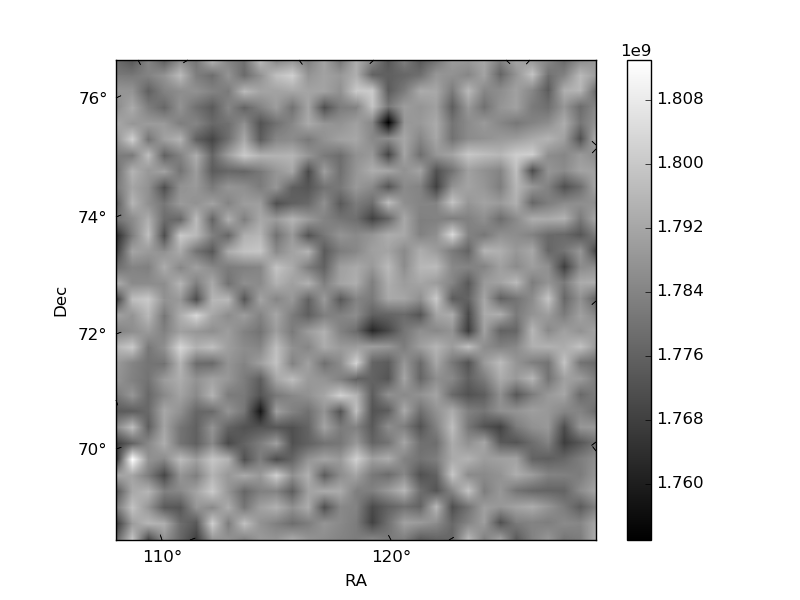
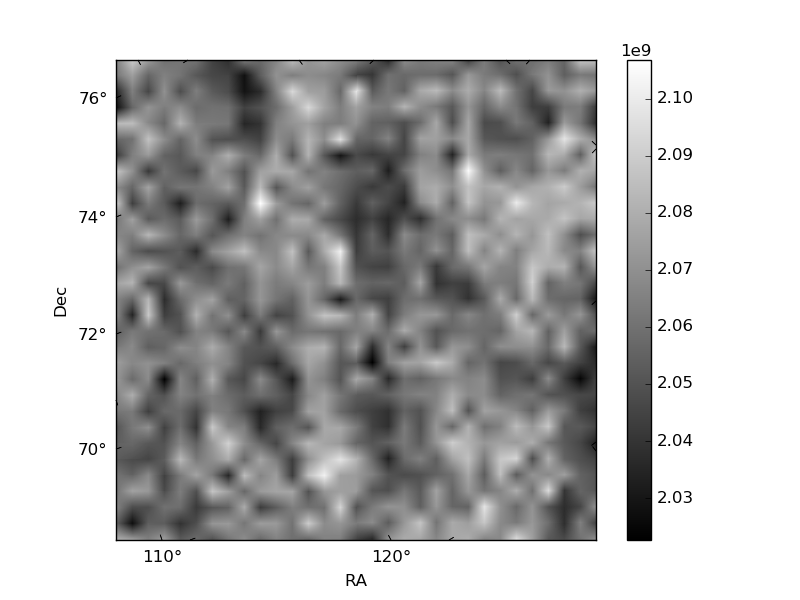
Histogram calculated using DETX and DETY for each event in the final _common_clean file
| Quadrant A |  |
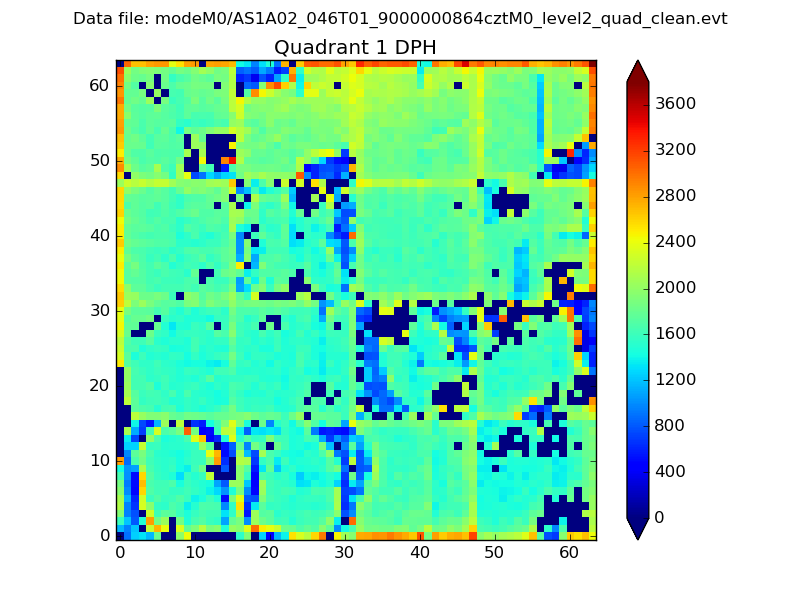 |
Quadrant B |
|---|---|---|---|
| Quadrant D | 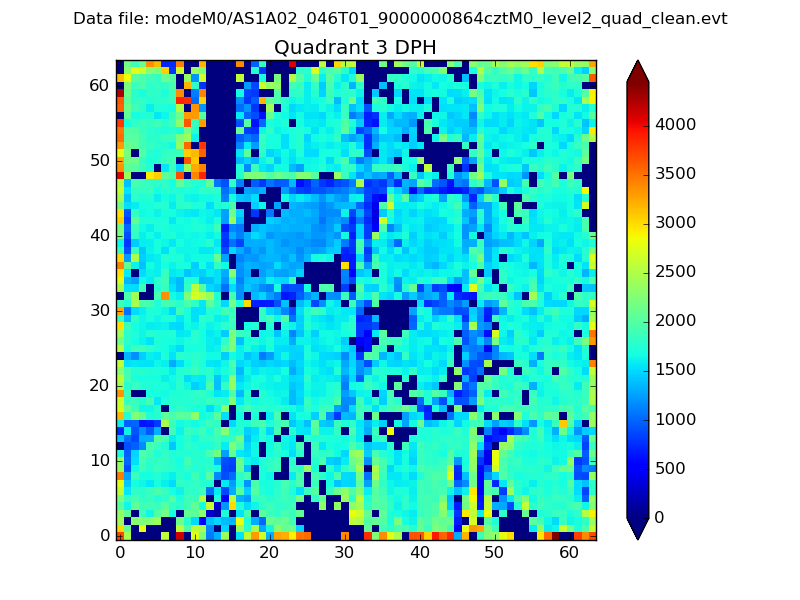 |
 |
Quadrant C |
| Plot type | Count rate plots | Images |
|---|---|---|
| Comparison with Poisson distribution Blue bars denote a histogram of data divided into 1 sec bins. Red curve is a Poisson curve with rate = median count rate of data. |
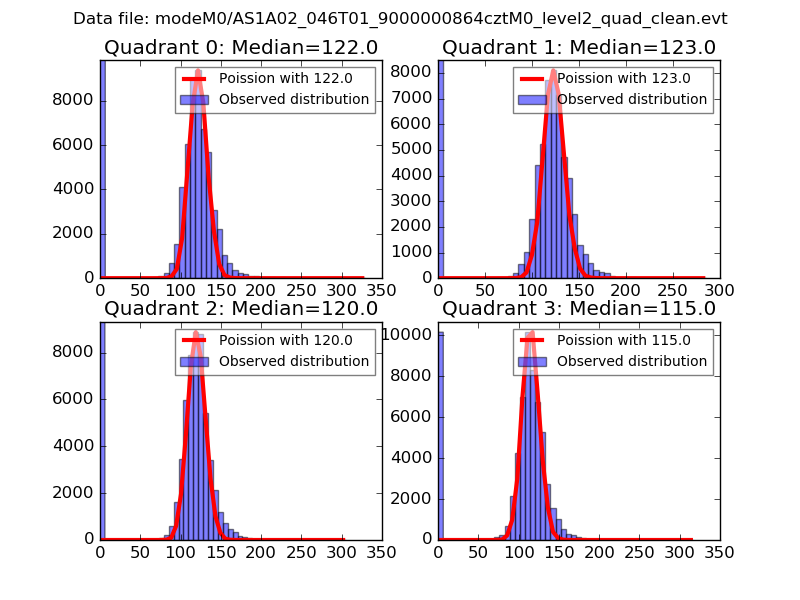 |
 |
| Quadrant-wise count rates Data is divided into 100 sec bins |
 |
|
| Module-wise count rates for Quadrant A Data is divided into 100 sec bins |
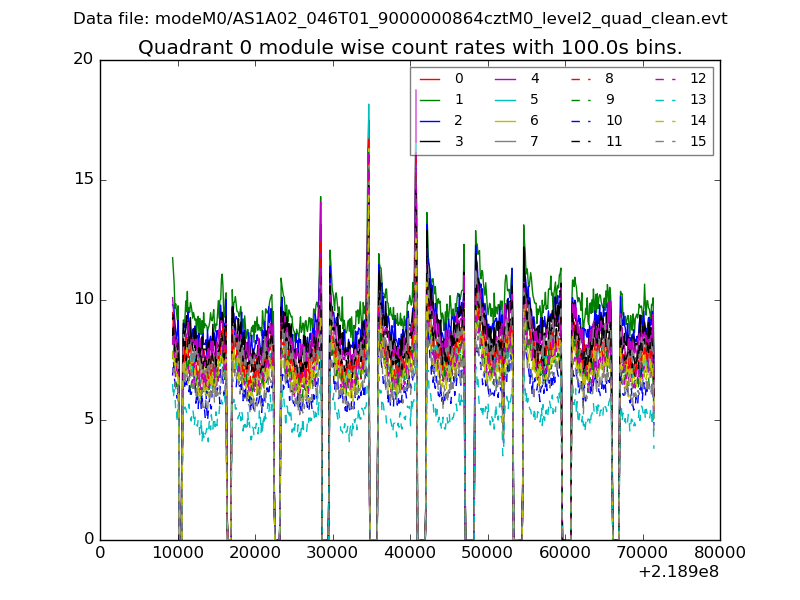 |
 |
| Module-wise count rates for Quadrant B Data is divided into 100 sec bins |
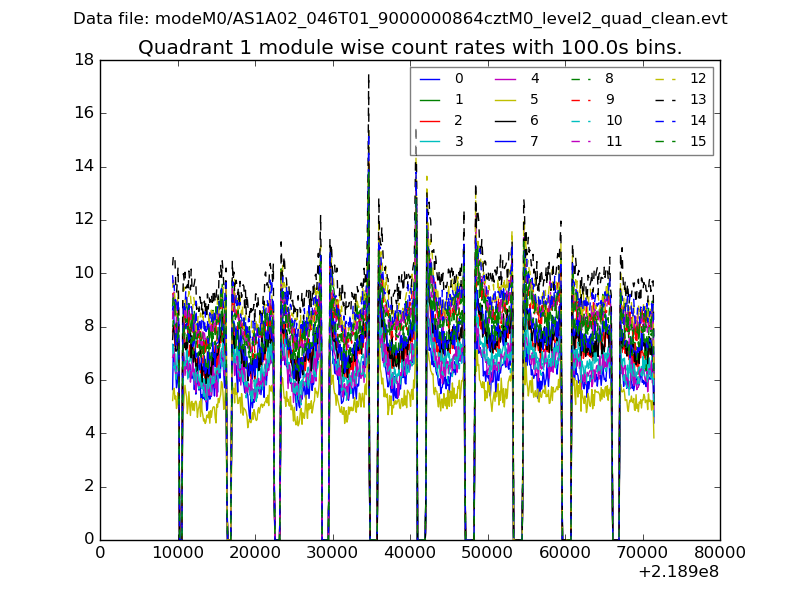 |
 |
| Module-wise count rates for Quadrant C Data is divided into 100 sec bins |
 |
 |
| Module-wise count rates for Quadrant D Data is divided into 100 sec bins |
 |
 |
| Parameter | Plot |
|---|---|
| CZT HV Monitor |  |
| D_VDD |  |
| Temperature 1 |  |
| Veto HV Monitor |  |
| Veto LLD |  |
| Alpha Counter |  |
| _CPM_Rate |  |
| CZT Counter |  |
| +2.5 Volts monitor |  |
| +5 Volts monitor |  |
| _ROLL_ROT | 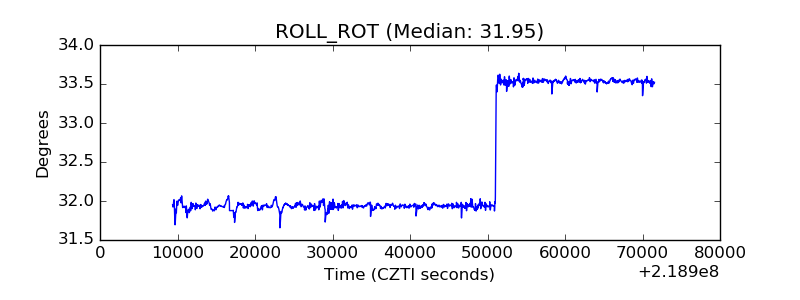 |
| _Roll_DEC | 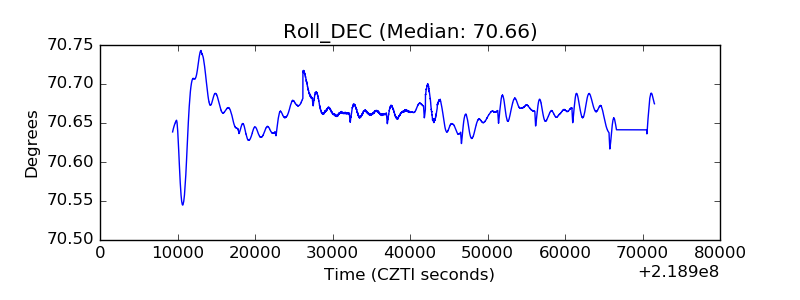 |
| _Roll_RA | 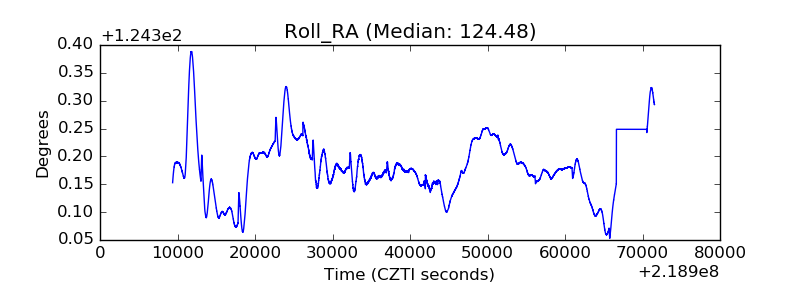 |
| Veto Counter |  |