| Param | Original file | Final file |
|---|---|---|
| Filename | modeM0/AS1A02_046T01_9000000864_06478cztM0_level2.evt | modeM0/AS1A02_046T01_9000000864_06478cztM0_level2_quad_clean.evt |
| Size (bytes) | 540,561,600 | 150,799,680 |
| Size | 515.5 MB | 143.8 MB |
| Events in quadrant A | 3,886,167 | 1,011,278 |
| Events in quadrant B | 3,972,816 | 1,011,183 |
| Events in quadrant C | 3,742,553 | 990,865 |
| Events in quadrant D | 4,192,608 | 964,457 |
| Mode M0 | |||
|---|---|---|---|
| Quadrant | BADHDUFLAG | Total packets | Discarded packets |
| A | 0 | 17409 | 3 |
| B | 0 | 17600 | 2 |
| C | 0 | 17234 | 2 |
| D | 0 | 18241 | 2 |
| Mode SS | |||
|---|---|---|---|
| Quadrant | BADHDUFLAG | Total packets | Discarded packets |
| A | 0 | 174 | 0 |
| B | 0 | 174 | 0 |
| C | 0 | 174 | 0 |
| D | 0 | 174 | 0 |
| Mode M9 | |||
|---|---|---|---|
| Quadrant | BADHDUFLAG | Total packets | Discarded packets |
| A | 0 | 11 | 0 |
| B | 0 | 11 | 0 |
| C | 0 | 11 | 0 |
| D | 0 | 11 | 0 |
| Quadrant | Total seconds | Saturated seconds | Saturation percentage |
|---|---|---|---|
| A | 8494 | 44 | 0.518013% |
| B | 8494 | 59 | 0.694608% |
| C | 8494 | 38 | 0.447375% |
| D | 8494 | 86 | 1.012479% |
Noise dominated data is calculated using 1-second bins in cleaned event files. If a bin has >2000 counts, and if more than 50% of those come from <1% of pixels, then it is considered to be noise-dominated and hence unusable.
| Quadrant | # 1 sec bins | Bins with >0 counts | Bins with >2000 counts | High rate bins dominated by noise | Noise dominated (total time) | Noise dominated (detector-on time) | Marked lightcurve |
|---|---|---|---|---|---|---|---|
| A | 9574 | 8496 | 0 | 0 | 0.00% | 0.00% | 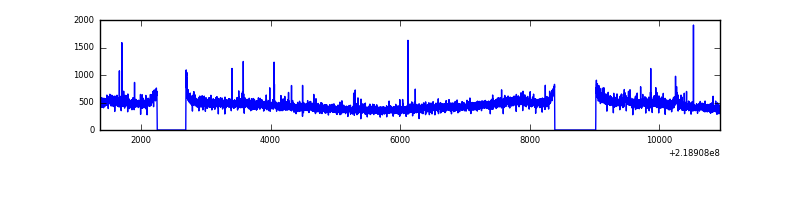 |
| B | 9574 | 8496 | 9 | 9 | 0.09% | 0.11% | 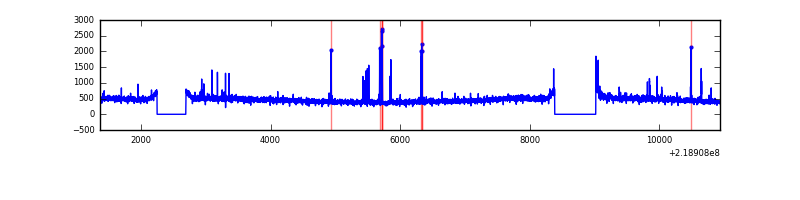 |
| C | 9574 | 8496 | 0 | 0 | 0.00% | 0.00% | 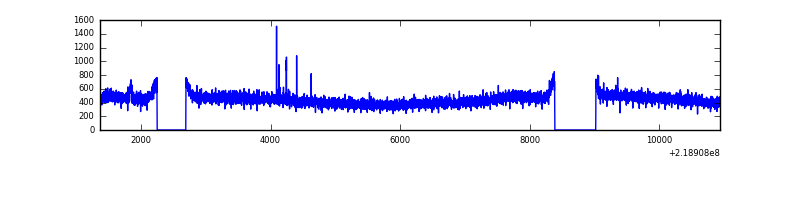 |
| D | 9574 | 8496 | 18 | 18 | 0.19% | 0.21% | 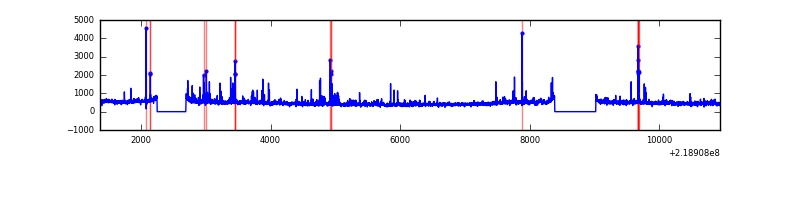 |
Top three noisy pixels from each quadrant. If the there are fewer than three noisy pixels in the level2.evt file, extra rows are filled as -1
| Pixel properties | Quadrant properties | ||||||
|---|---|---|---|---|---|---|---|
| Quadrant | DetID | PixID | Counts | Sigma | Mean | Median | Sigma |
| A | 8 | 15 | 56606 | 274.55 | 985 | 963 | 202.7 |
| A | 15 | 234 | 12953 | 59.16 | 985 | 963 | 202.7 |
| A | 15 | 236 | 9832 | 43.76 | 985 | 963 | 202.7 |
| B | 0 | 219 | 45165 | 233.96 | 988 | 960 | 188.9 |
| B | 0 | 245 | 23455 | 119.06 | 988 | 960 | 188.9 |
| B | 12 | 111 | 18674 | 93.75 | 988 | 960 | 188.9 |
| C | 12 | 4 | 11872 | 49.19 | 953 | 954 | 221.9 |
| C | 1 | 16 | 9556 | 38.76 | 953 | 954 | 221.9 |
| C | 13 | 61 | 7528 | 29.62 | 953 | 954 | 221.9 |
| D | 2 | 152 | 173709 | 739.35 | 959 | 927 | 233.7 |
| D | 7 | 55 | 76544 | 323.57 | 959 | 927 | 233.7 |
| D | 13 | 137 | 72297 | 305.4 | 959 | 927 | 233.7 |
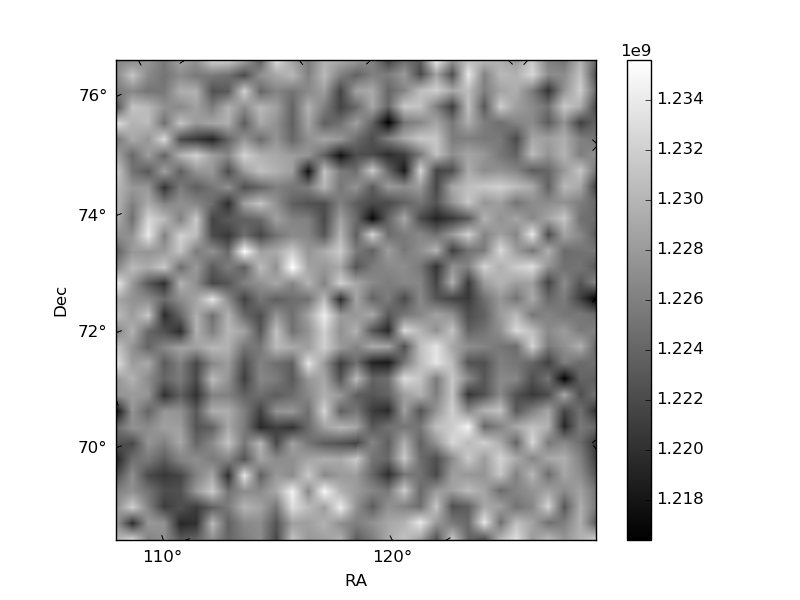
Histogram calculated using DETX and DETY for each event in the final _common_clean file
| Quadrant A | 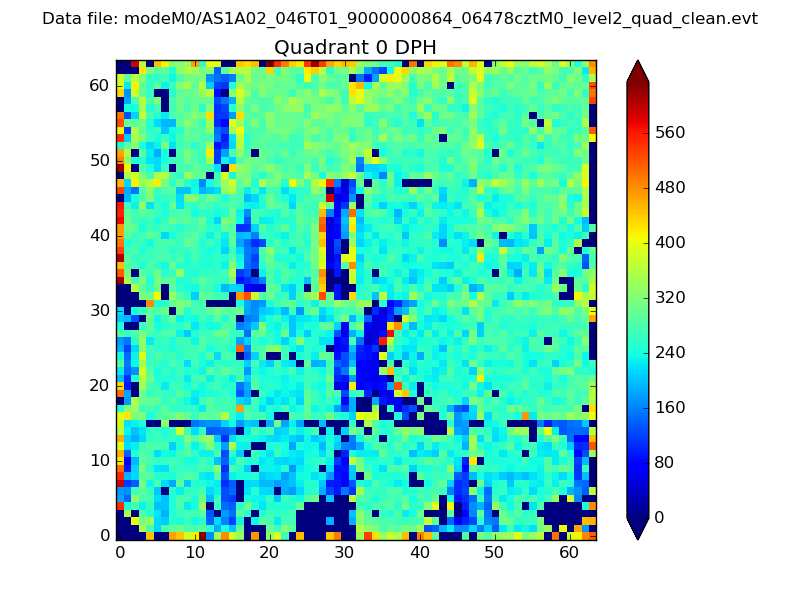 |
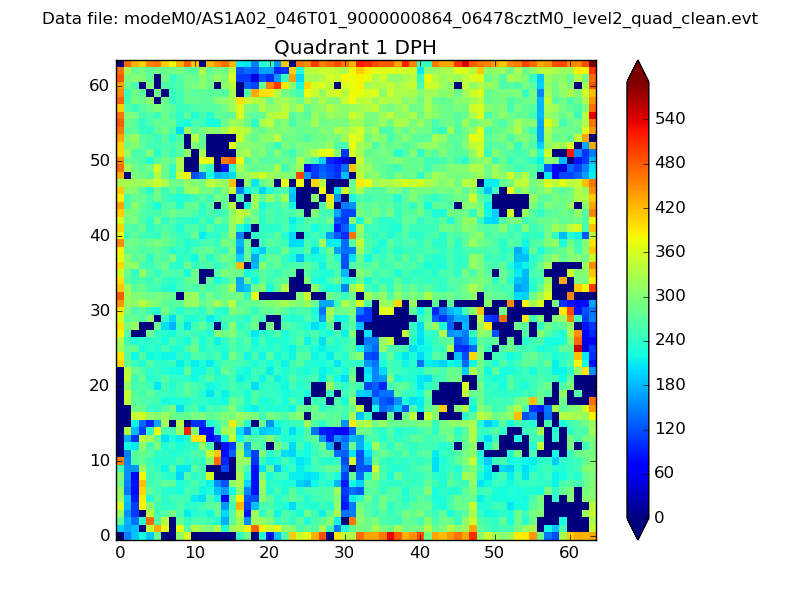 |
Quadrant B |
|---|---|---|---|
| Quadrant D | 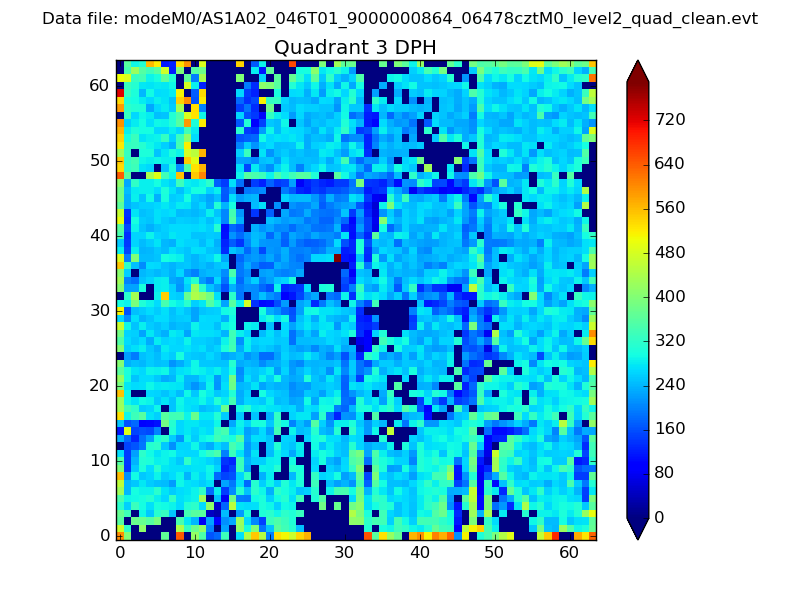 |
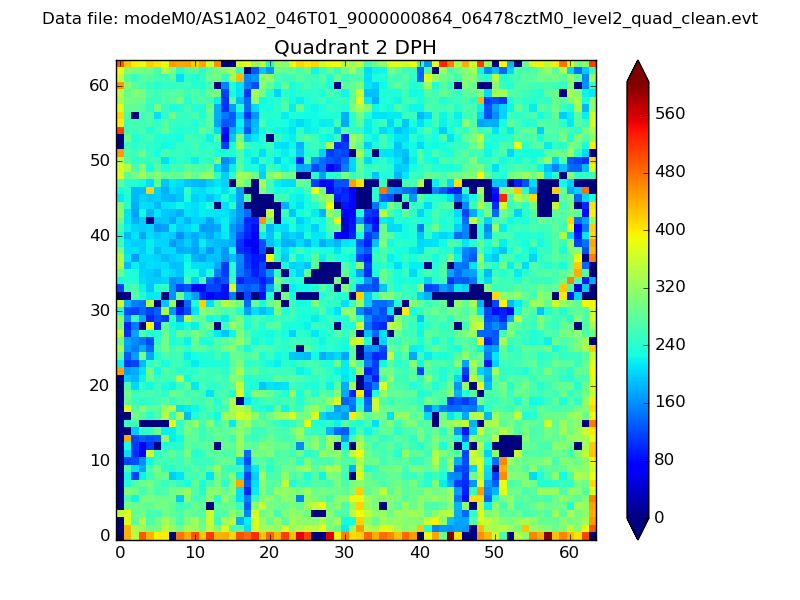 |
Quadrant C |
| Plot type | Count rate plots | Images |
|---|---|---|
| Comparison with Poisson distribution Blue bars denote a histogram of data divided into 1 sec bins. Red curve is a Poisson curve with rate = median count rate of data. |
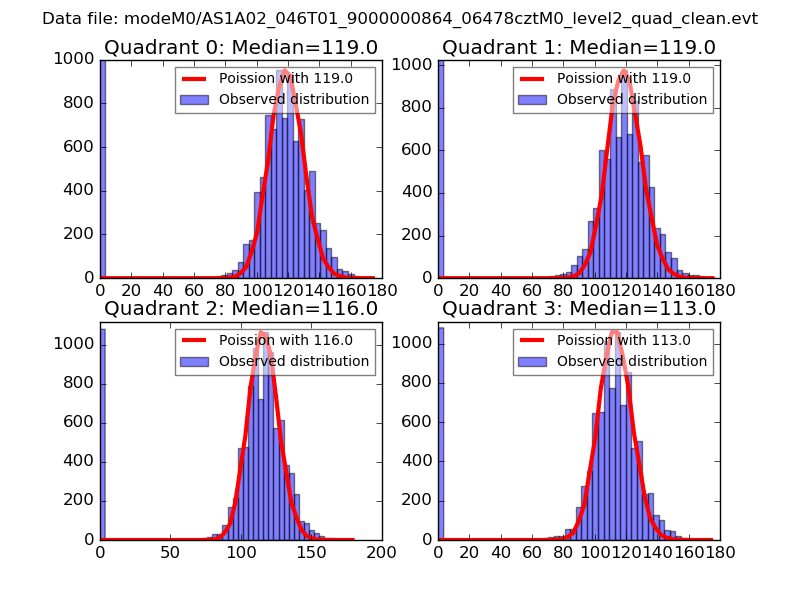 |
 |
| Quadrant-wise count rates Data is divided into 100 sec bins |
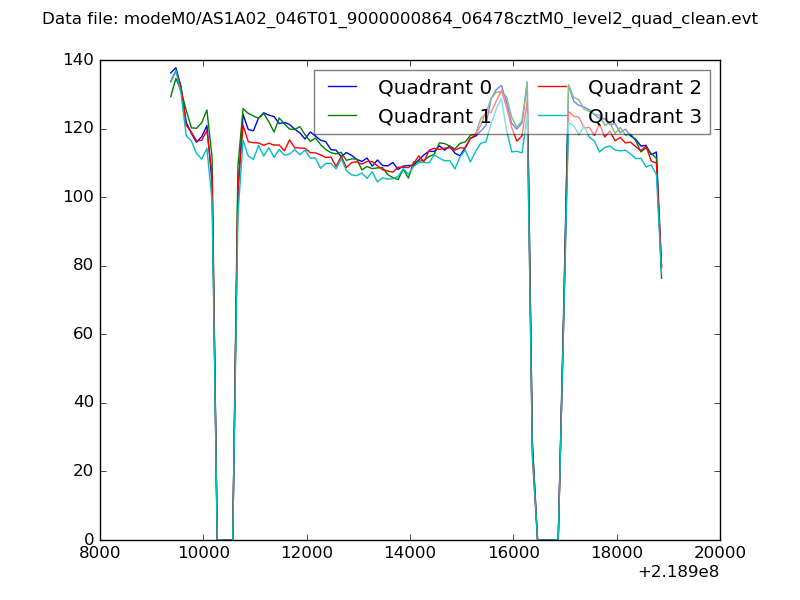 |
|
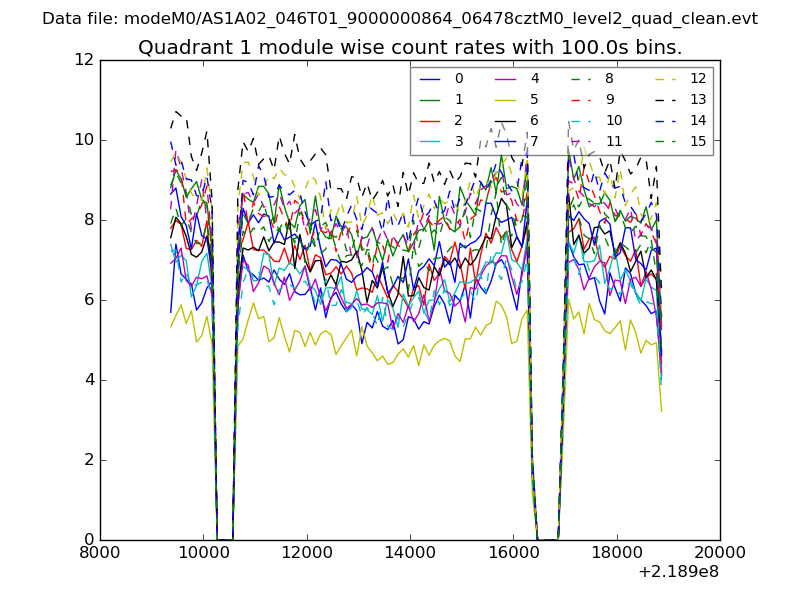
| Module-wise count rates for Quadrant A Data is divided into 100 sec bins |
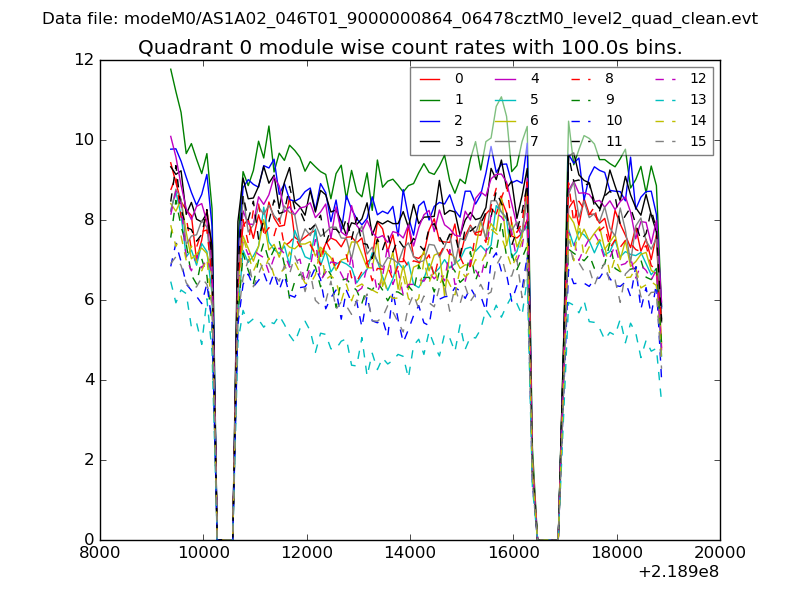 |
 |
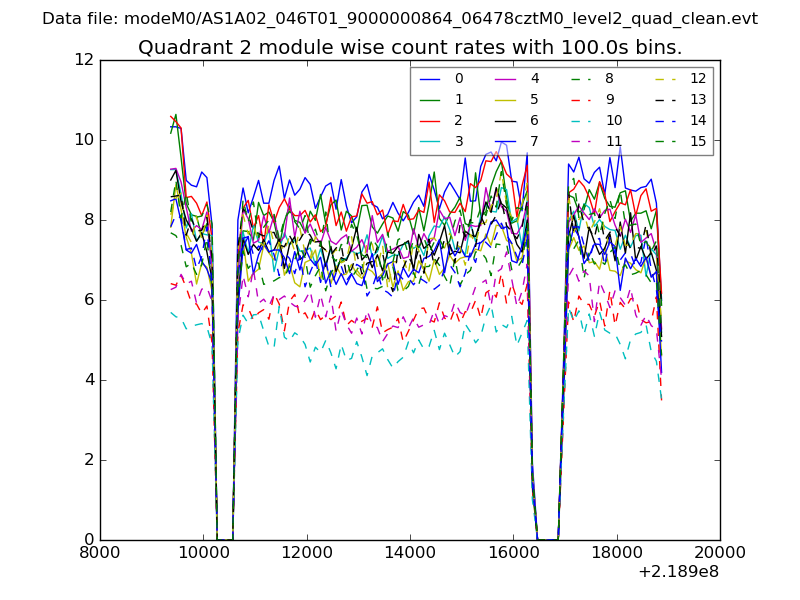
| Module-wise count rates for Quadrant B Data is divided into 100 sec bins |
 |
 |
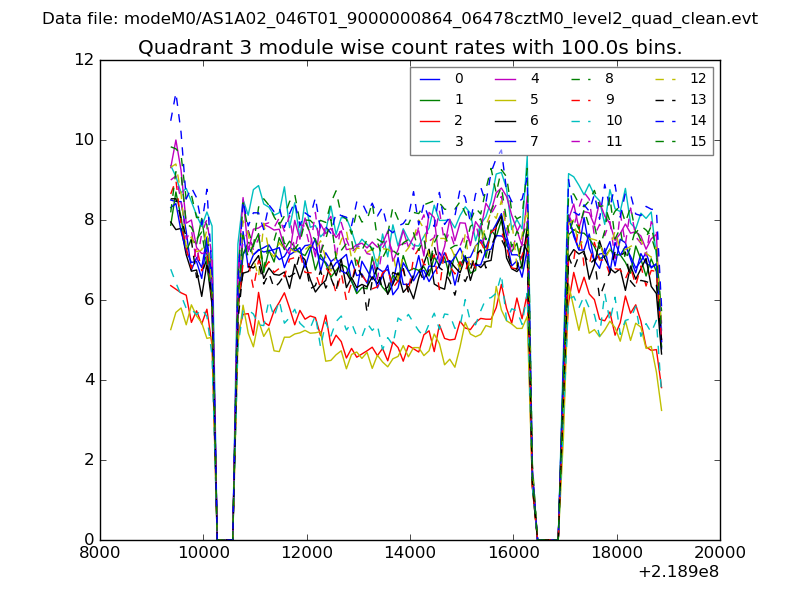
| Module-wise count rates for Quadrant C Data is divided into 100 sec bins |
 |
 |
| Module-wise count rates for Quadrant D Data is divided into 100 sec bins |
 |
 |
| Parameter | Plot |
|---|---|
| CZT HV Monitor | 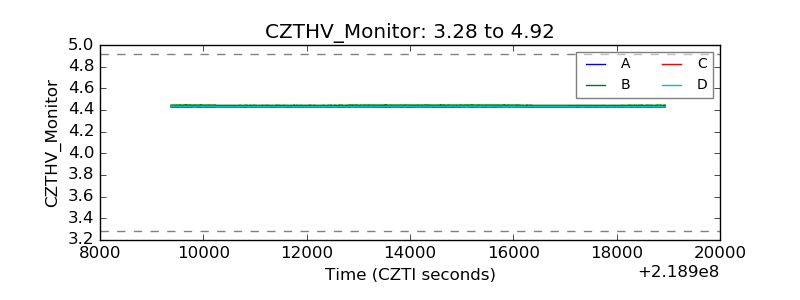 |
| D_VDD | 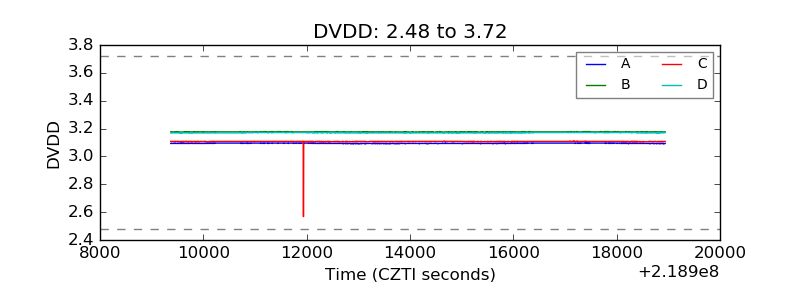 |
| Temperature 1 | 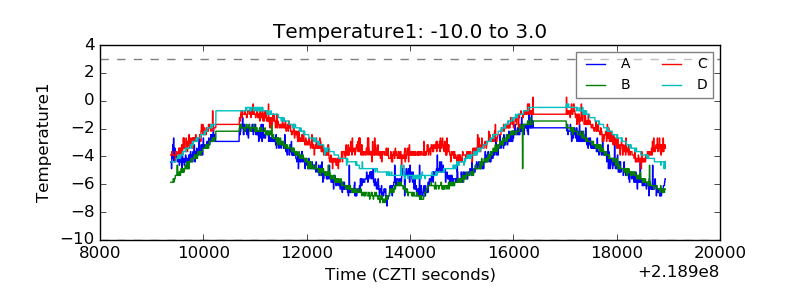 |
| Veto HV Monitor | 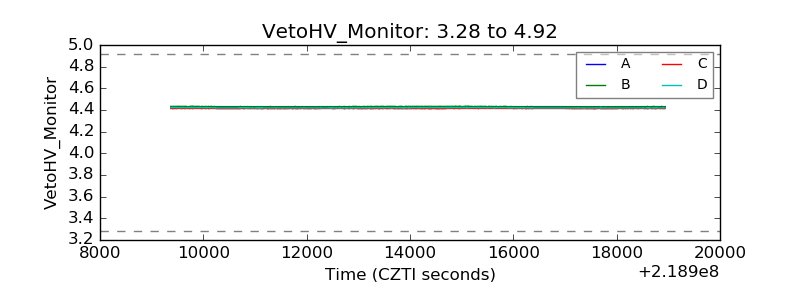 |
| Veto LLD | 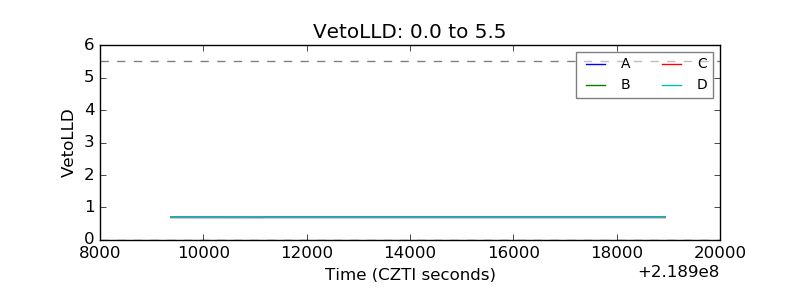 |
| Alpha Counter | 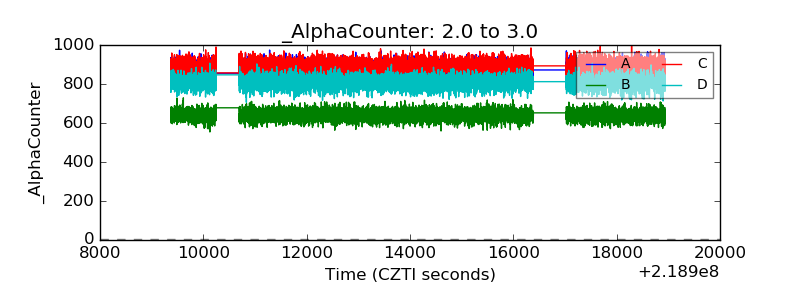 |
| _CPM_Rate | 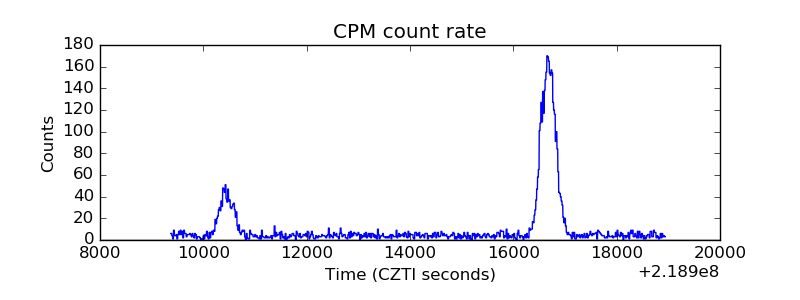 |
| CZT Counter | 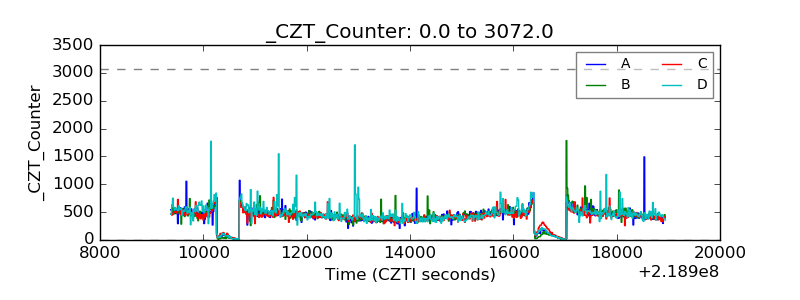 |
| +2.5 Volts monitor |  |
| +5 Volts monitor | 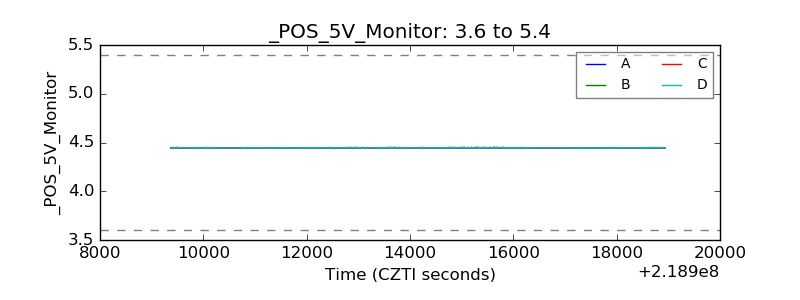 |
| _ROLL_ROT | 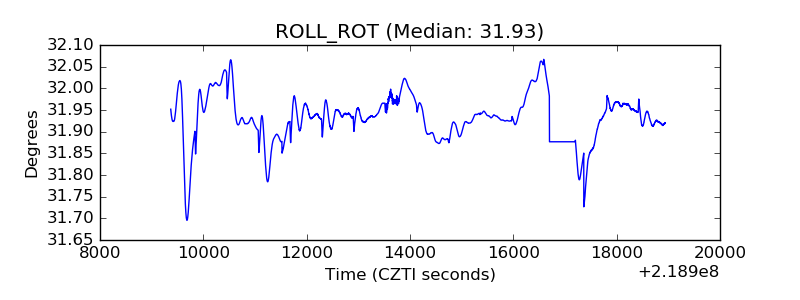 |
| _Roll_DEC | 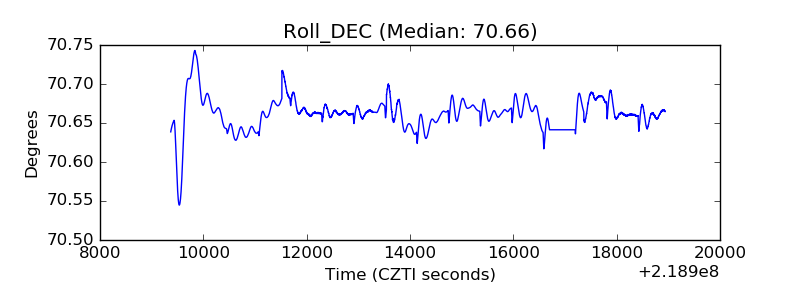 |
| _Roll_RA | 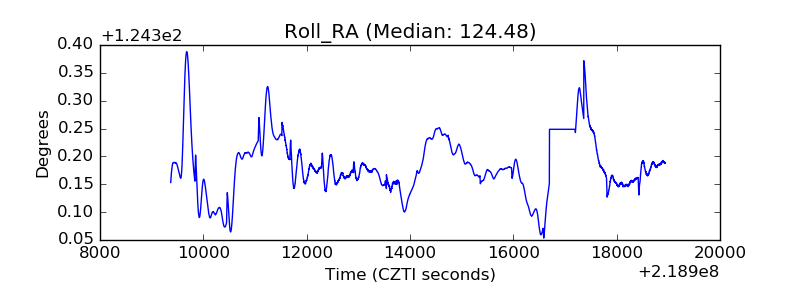 |
| Veto Counter | 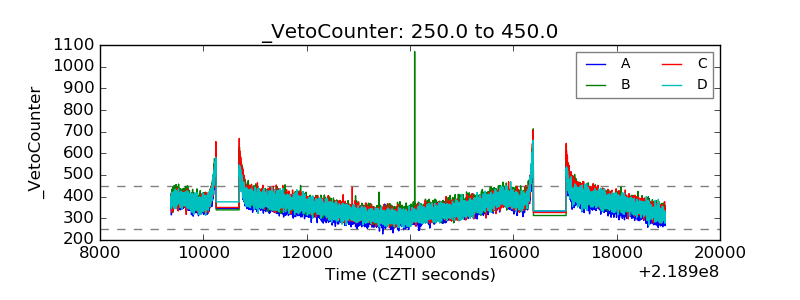 |