| Param | Original file | Final file |
|---|---|---|
| Filename | modeM0/AS1A02_046T01_9000000864_06481cztM0_level2.evt | modeM0/AS1A02_046T01_9000000864_06481cztM0_level2_quad_clean.evt |
| Size (bytes) | 416,036,160 | 120,522,240 |
| Size | 396.8 MB | 114.9 MB |
| Events in quadrant A | 2,900,548 | 811,155 |
| Events in quadrant B | 3,097,839 | 810,986 |
| Events in quadrant C | 2,830,953 | 803,049 |
| Events in quadrant D | 3,332,883 | 776,737 |
| Mode M0 | |||
|---|---|---|---|
| Quadrant | BADHDUFLAG | Total packets | Discarded packets |
| A | 0 | 13289 | 3 |
| B | 0 | 13705 | 2 |
| C | 0 | 13197 | 2 |
| D | 0 | 14656 | 2 |
| Mode SS | |||
|---|---|---|---|
| Quadrant | BADHDUFLAG | Total packets | Discarded packets |
| A | 0 | 128 | 0 |
| B | 0 | 128 | 0 |
| C | 0 | 128 | 0 |
| D | 0 | 128 | 0 |
| Mode M9 | |||
|---|---|---|---|
| Quadrant | BADHDUFLAG | Total packets | Discarded packets |
| A | 0 | 16 | 0 |
| B | 0 | 16 | 0 |
| C | 0 | 16 | 0 |
| D | 0 | 17 | 0 |
| Quadrant | Total seconds | Saturated seconds | Saturation percentage |
|---|---|---|---|
| A | 6437 | 24 | 0.372844% |
| B | 6437 | 39 | 0.605872% |
| C | 6437 | 20 | 0.310704% |
| D | 6437 | 45 | 0.699083% |
Noise dominated data is calculated using 1-second bins in cleaned event files. If a bin has >2000 counts, and if more than 50% of those come from <1% of pixels, then it is considered to be noise-dominated and hence unusable.
| Quadrant | # 1 sec bins | Bins with >0 counts | Bins with >2000 counts | High rate bins dominated by noise | Noise dominated (total time) | Noise dominated (detector-on time) | Marked lightcurve |
|---|---|---|---|---|---|---|---|
| A | 7562 | 6438 | 2 | 2 | 0.03% | 0.03% | 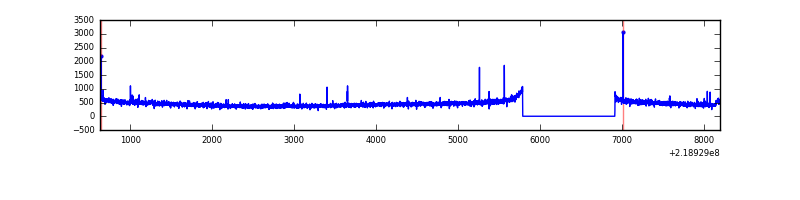 |
| B | 7562 | 6438 | 5 | 5 | 0.07% | 0.08% | 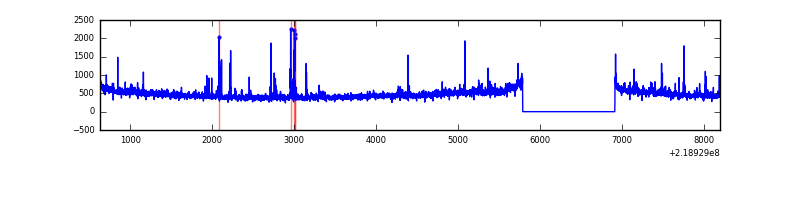 |
| C | 7562 | 6438 | 0 | 0 | 0.00% | 0.00% | 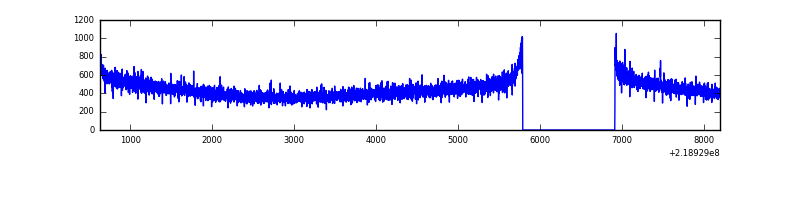 |
| D | 7562 | 6438 | 18 | 18 | 0.24% | 0.28% | 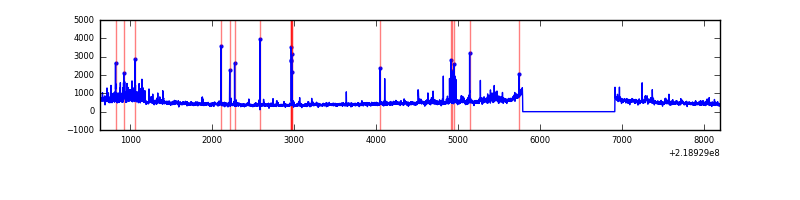 |
Top three noisy pixels from each quadrant. If the there are fewer than three noisy pixels in the level2.evt file, extra rows are filled as -1
| Pixel properties | Quadrant properties | ||||||
|---|---|---|---|---|---|---|---|
| Quadrant | DetID | PixID | Counts | Sigma | Mean | Median | Sigma |
| A | 8 | 15 | 18800 | 120.98 | 740 | 725 | 149.4 |
| A | 15 | 174 | 12097 | 76.11 | 740 | 725 | 149.4 |
| A | 15 | 236 | 9173 | 56.54 | 740 | 725 | 149.4 |
| B | 0 | 219 | 54297 | 377.41 | 747 | 728 | 141.9 |
| B | 15 | 204 | 46994 | 325.96 | 747 | 728 | 141.9 |
| B | 4 | 172 | 31511 | 216.88 | 747 | 728 | 141.9 |
| C | 12 | 4 | 5821 | 30.45 | 723 | 726 | 167.3 |
| C | 13 | 61 | 5515 | 28.62 | 723 | 726 | 167.3 |
| C | 1 | 16 | 3254 | 15.11 | 723 | 726 | 167.3 |
| D | 8 | 195 | 242878 | 1387.73 | 718 | 696 | 174.5 |
| D | 2 | 152 | 236140 | 1349.12 | 718 | 696 | 174.5 |
| D | 2 | 14 | 39897 | 224.63 | 718 | 696 | 174.5 |
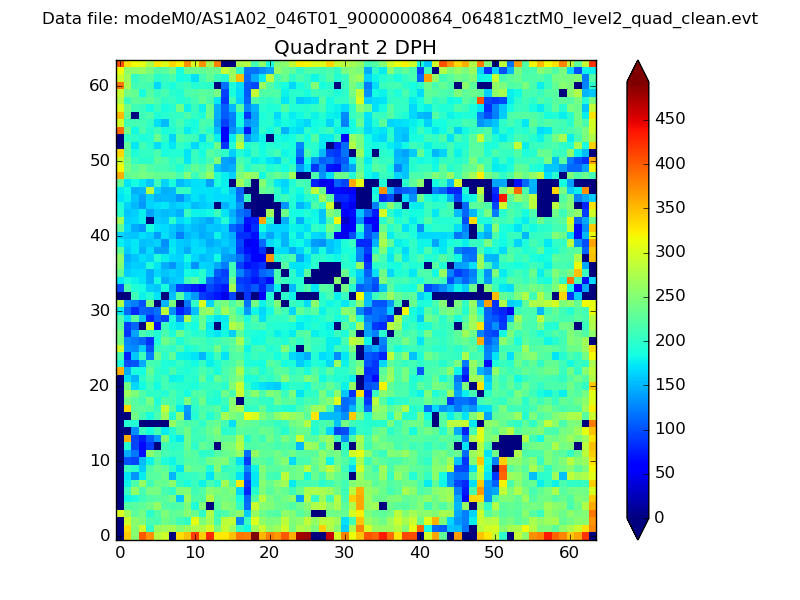
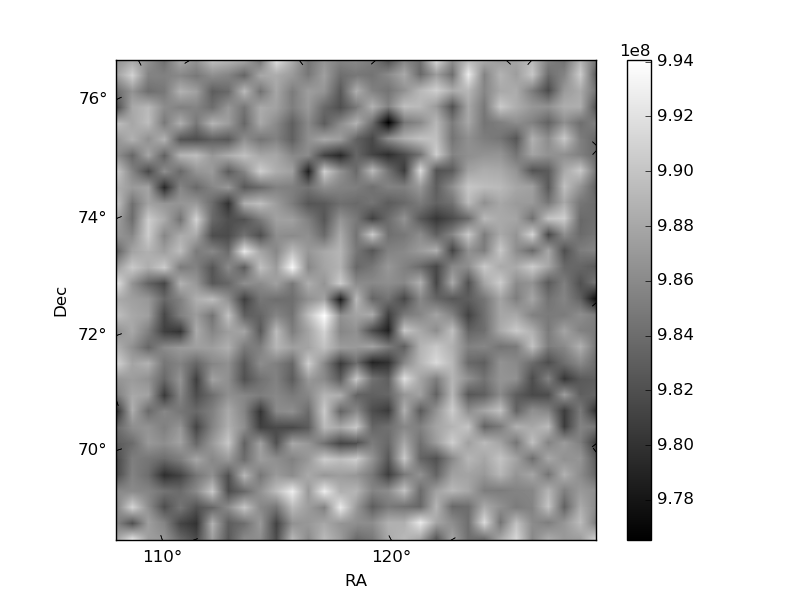
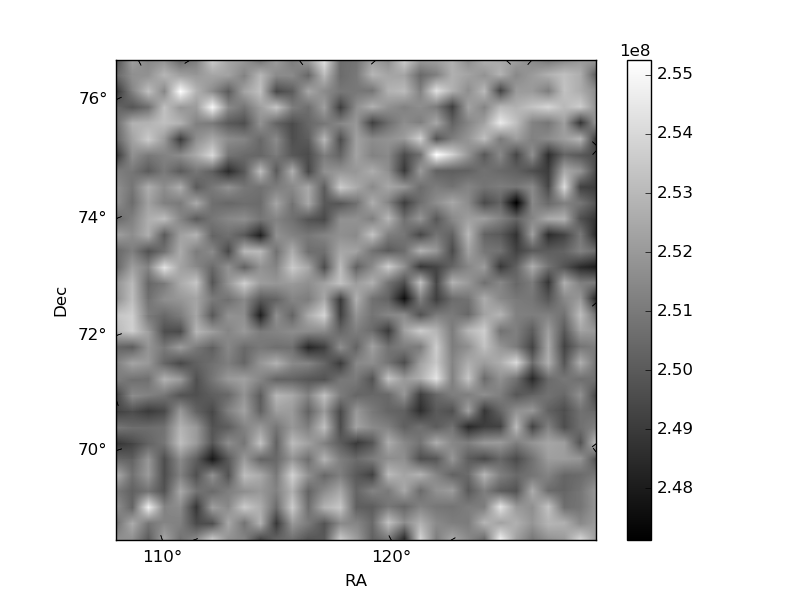
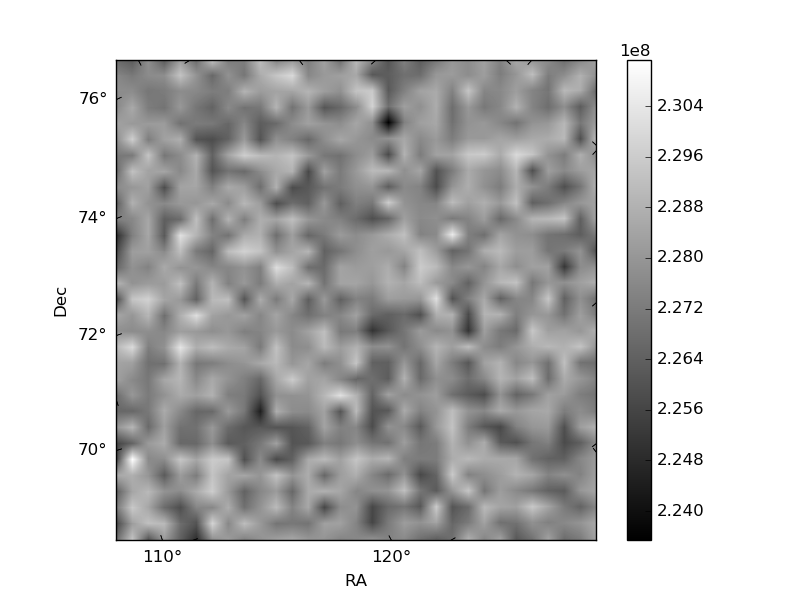
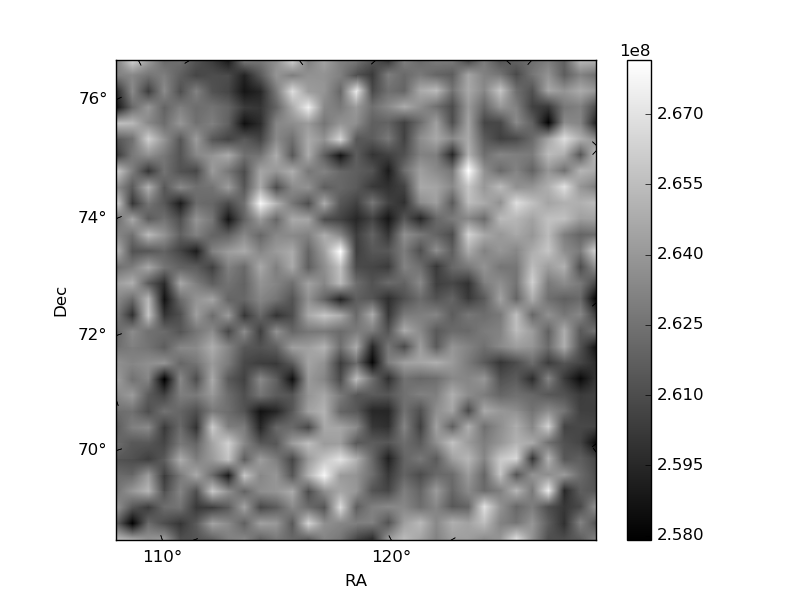
Histogram calculated using DETX and DETY for each event in the final _common_clean file
| Quadrant A | 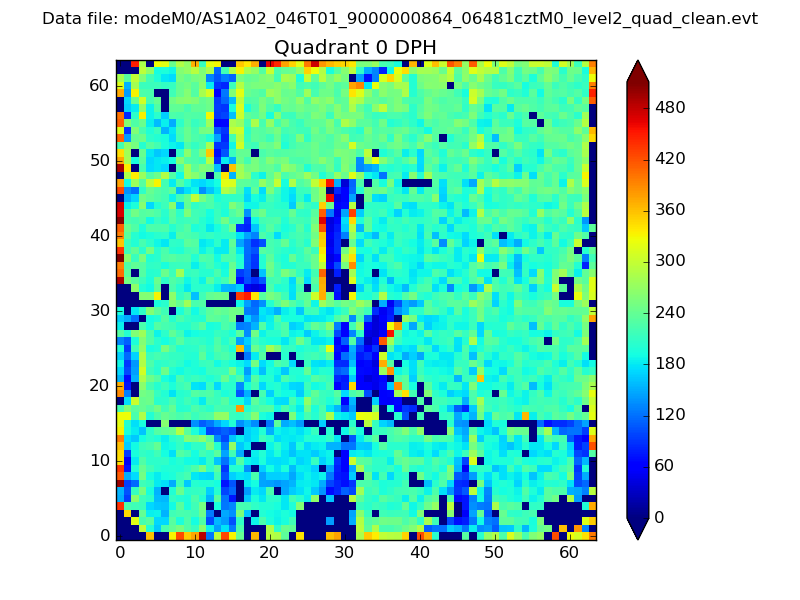 |
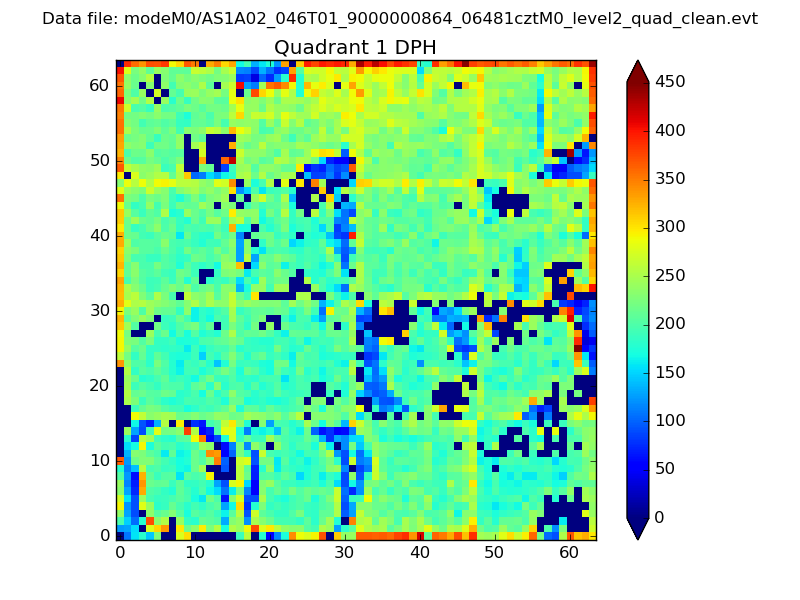 |
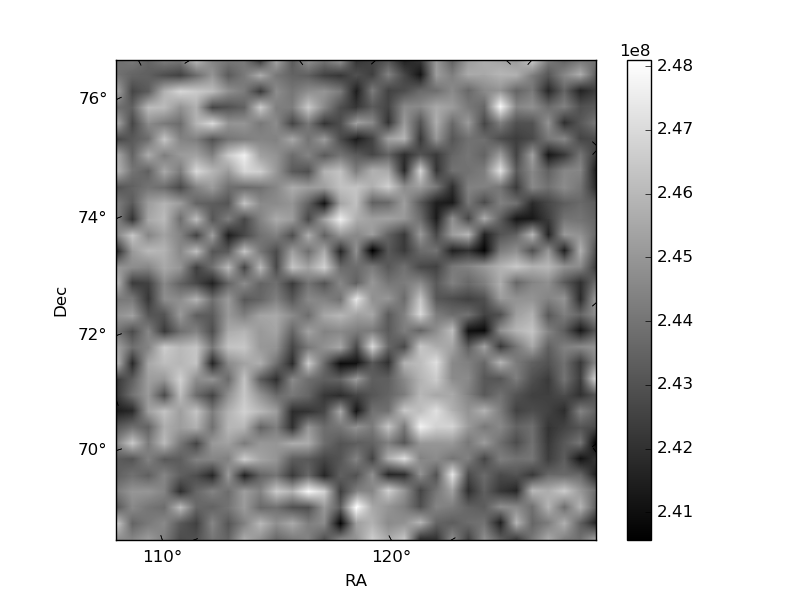
Quadrant B |
|---|---|---|---|
| Quadrant D | 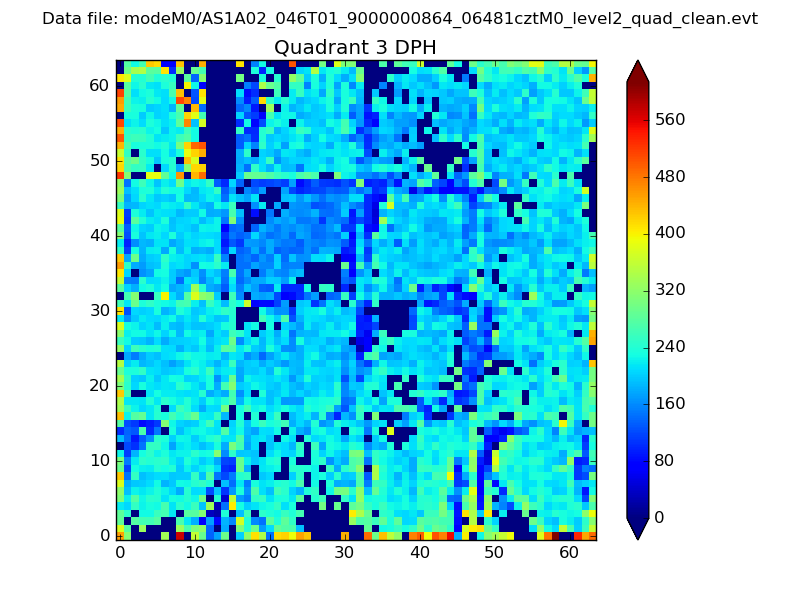 |
 |
Quadrant C |
| Plot type | Count rate plots | Images |
|---|---|---|
| Comparison with Poisson distribution Blue bars denote a histogram of data divided into 1 sec bins. Red curve is a Poisson curve with rate = median count rate of data. |
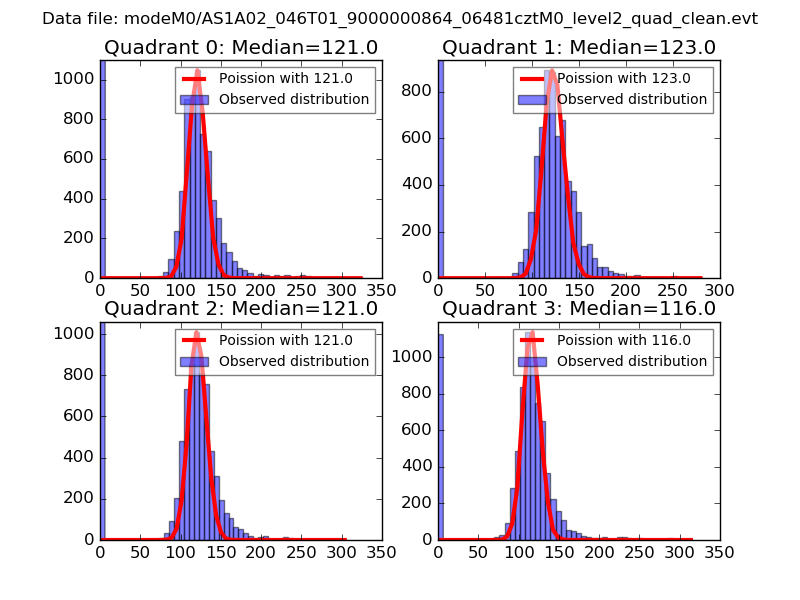 |
 |
| Quadrant-wise count rates Data is divided into 100 sec bins |
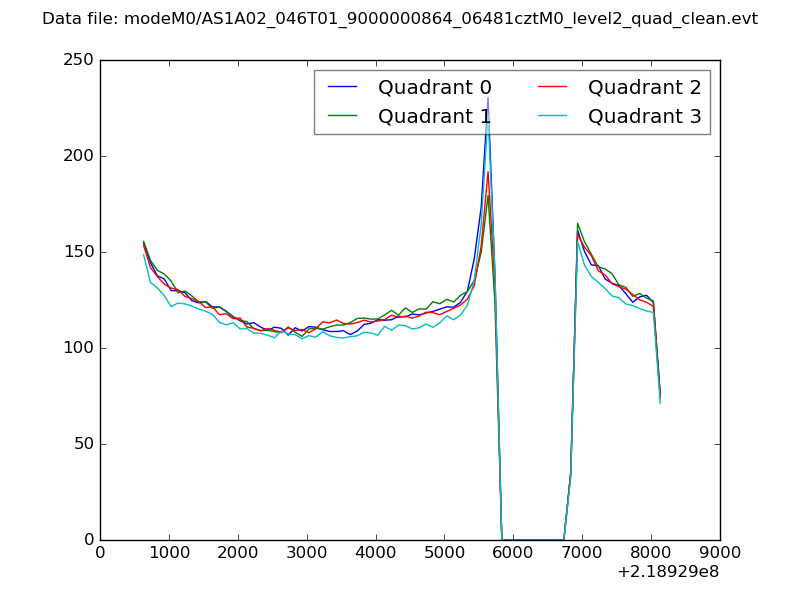 |
|
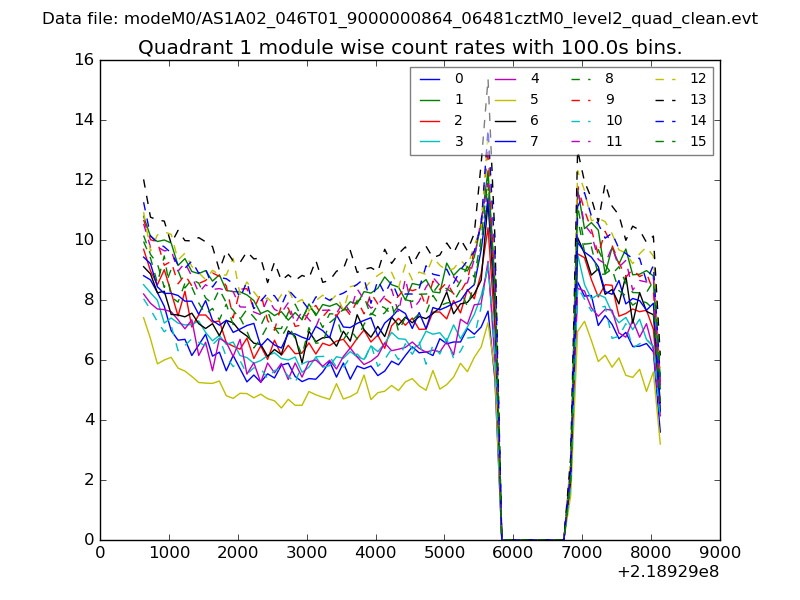
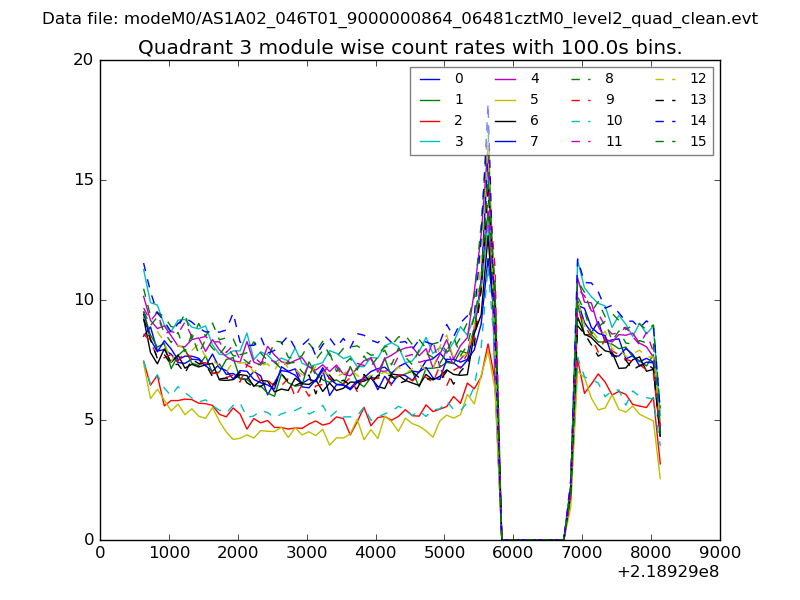
| Module-wise count rates for Quadrant A Data is divided into 100 sec bins |
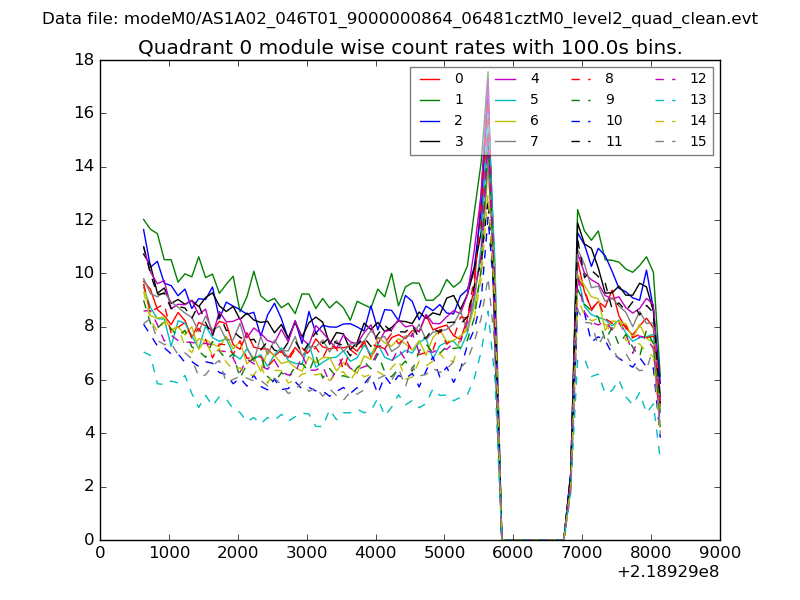 |
 |
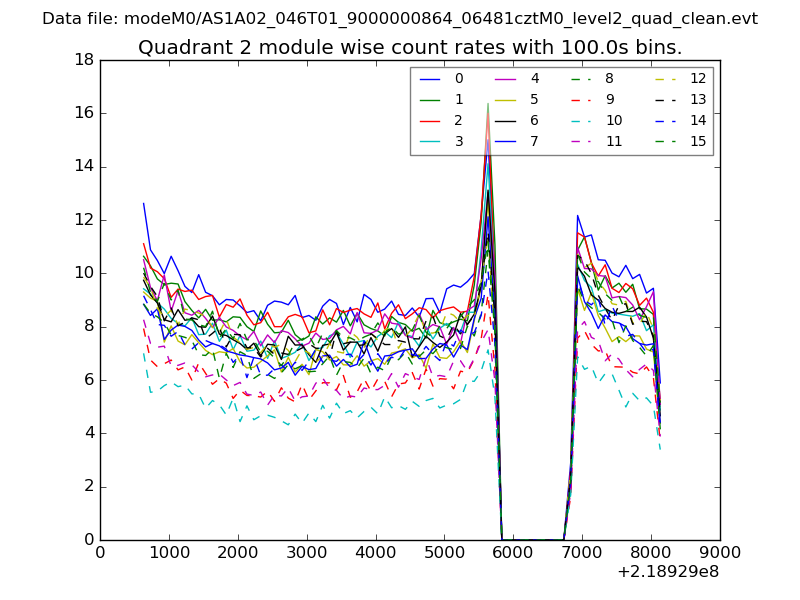
| Module-wise count rates for Quadrant B Data is divided into 100 sec bins |
 |
 |
| Module-wise count rates for Quadrant C Data is divided into 100 sec bins |
 |
 |
| Module-wise count rates for Quadrant D Data is divided into 100 sec bins |
 |
 |
| Parameter | Plot |
|---|---|
| CZT HV Monitor | 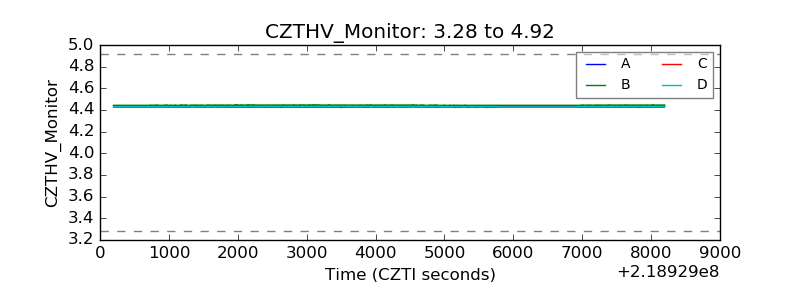 |
| D_VDD | 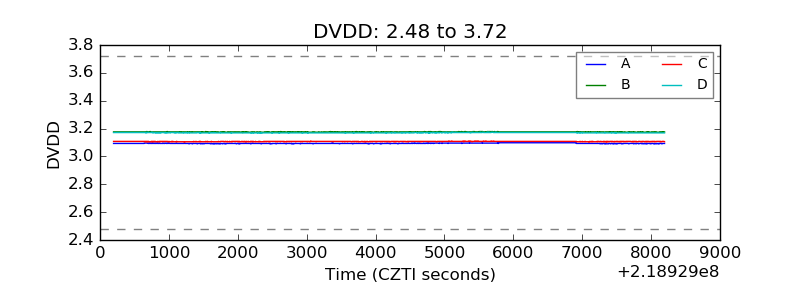 |
| Temperature 1 | 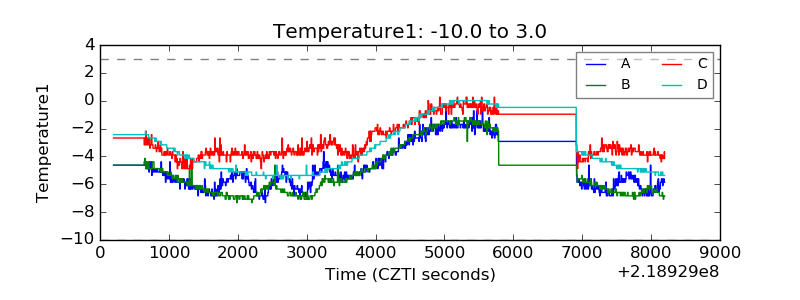 |
| Veto HV Monitor | 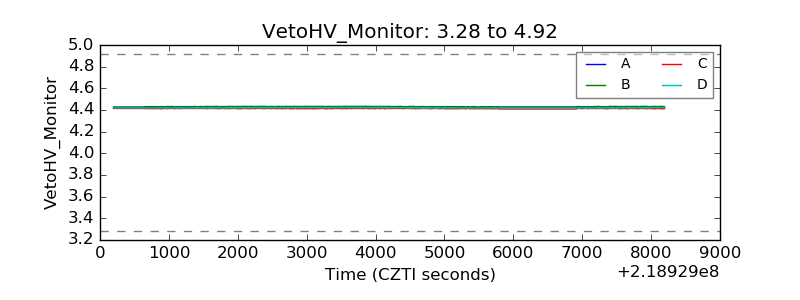 |
| Veto LLD | 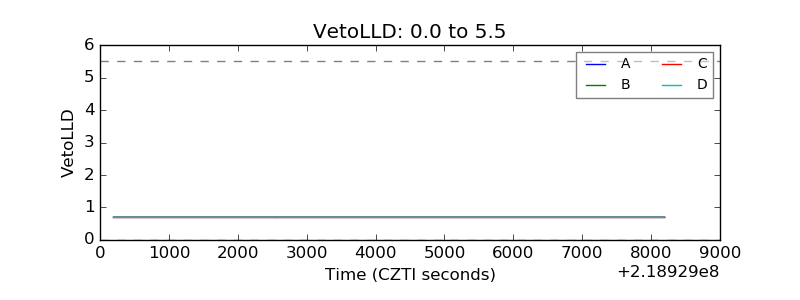 |
| Alpha Counter | 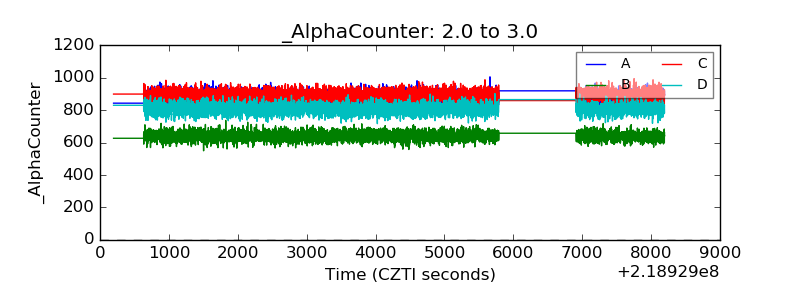 |
| _CPM_Rate | 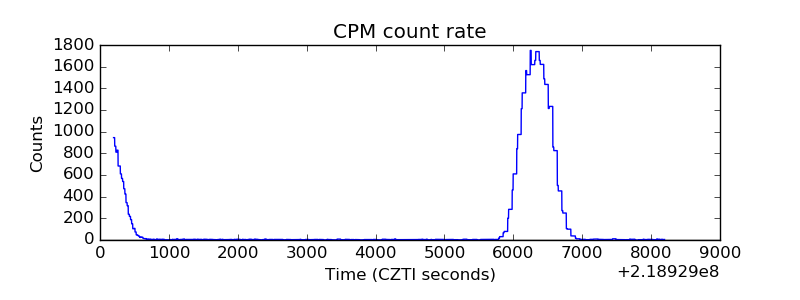 |
| CZT Counter | 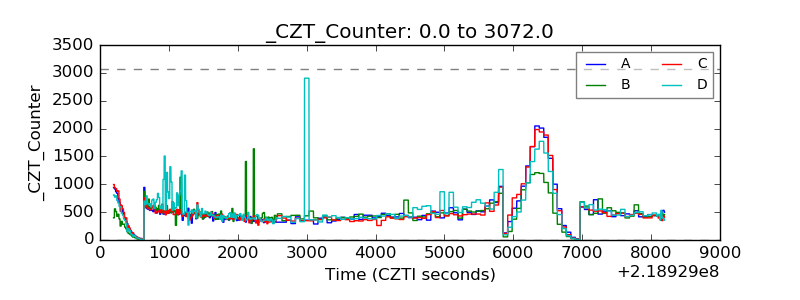 |
| +2.5 Volts monitor |  |
| +5 Volts monitor |  |
| _ROLL_ROT | 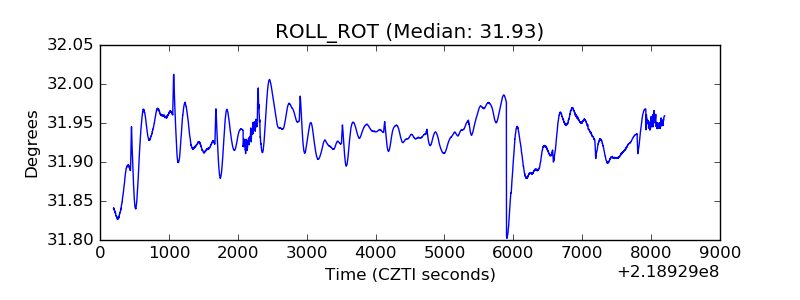 |
| _Roll_DEC | 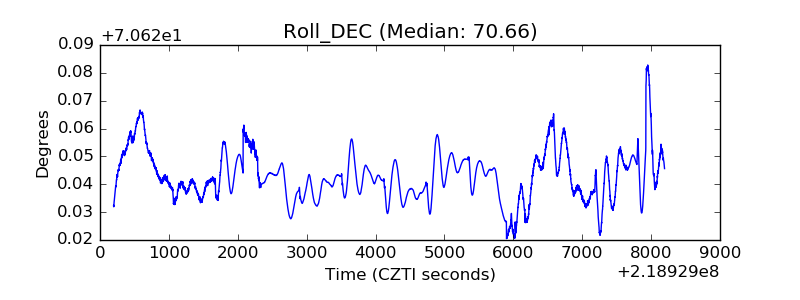 |
| _Roll_RA | 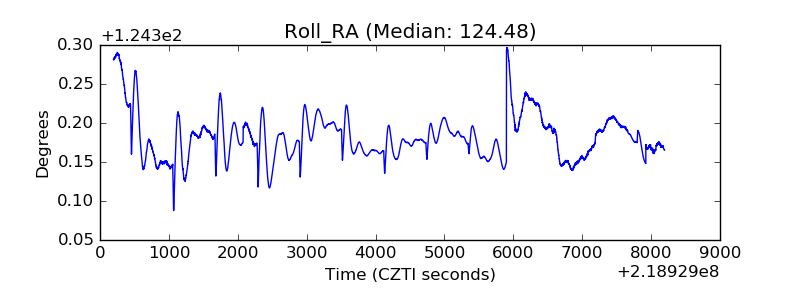 |
| Veto Counter | 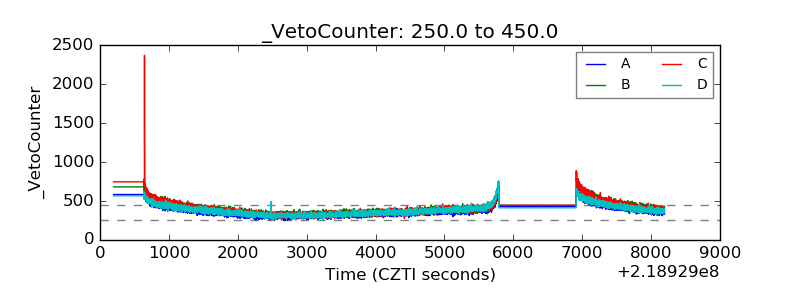 |