| Param | Original file | Final file |
|---|---|---|
| Filename | modeM0/AS1A02_046T01_9000000864_06482cztM0_level2.evt | modeM0/AS1A02_046T01_9000000864_06482cztM0_level2_quad_clean.evt |
| Size (bytes) | 435,790,080 | 127,753,920 |
| Size | 415.6 MB | 121.8 MB |
| Events in quadrant A | 3,048,692 | 864,753 |
| Events in quadrant B | 3,252,747 | 869,561 |
| Events in quadrant C | 3,225,835 | 851,709 |
| Events in quadrant D | 3,219,874 | 821,372 |
| Mode M0 | |||
|---|---|---|---|
| Quadrant | BADHDUFLAG | Total packets | Discarded packets |
| A | 0 | 13719 | 3 |
| B | 0 | 14251 | 2 |
| C | 0 | 14488 | 2 |
| D | 0 | 14345 | 2 |
| Mode SS | |||
|---|---|---|---|
| Quadrant | BADHDUFLAG | Total packets | Discarded packets |
| A | 0 | 134 | 0 |
| B | 0 | 134 | 0 |
| C | 0 | 134 | 0 |
| D | 0 | 134 | 0 |
| Mode M9 | |||
|---|---|---|---|
| Quadrant | BADHDUFLAG | Total packets | Discarded packets |
| A | 0 | 16 | 0 |
| B | 0 | 16 | 0 |
| C | 0 | 16 | 0 |
| D | 0 | 17 | 0 |
| Quadrant | Total seconds | Saturated seconds | Saturation percentage |
|---|---|---|---|
| A | 6631 | 23 | 0.346856% |
| B | 6631 | 27 | 0.407178% |
| C | 6631 | 58 | 0.874680% |
| D | 6631 | 33 | 0.497662% |
Noise dominated data is calculated using 1-second bins in cleaned event files. If a bin has >2000 counts, and if more than 50% of those come from <1% of pixels, then it is considered to be noise-dominated and hence unusable.
| Quadrant | # 1 sec bins | Bins with >0 counts | Bins with >2000 counts | High rate bins dominated by noise | Noise dominated (total time) | Noise dominated (detector-on time) | Marked lightcurve |
|---|---|---|---|---|---|---|---|
| A | 7846 | 6632 | 1 | 1 | 0.01% | 0.02% | 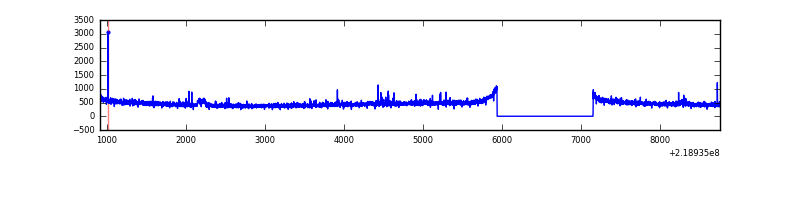 |
| B | 7846 | 6632 | 4 | 4 | 0.05% | 0.06% | 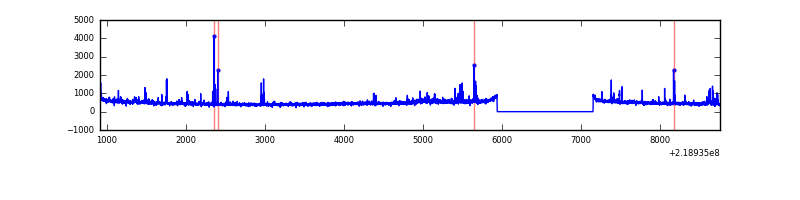 |
| C | 7846 | 6632 | 25 | 25 | 0.32% | 0.38% | 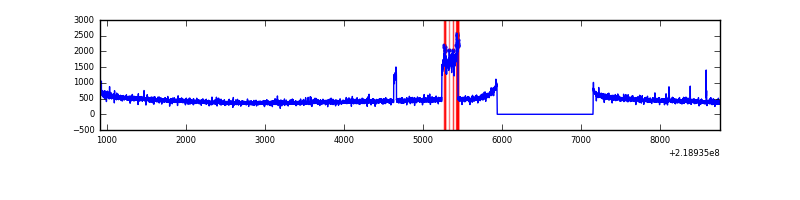 |
| D | 7846 | 6632 | 15 | 15 | 0.19% | 0.23% | 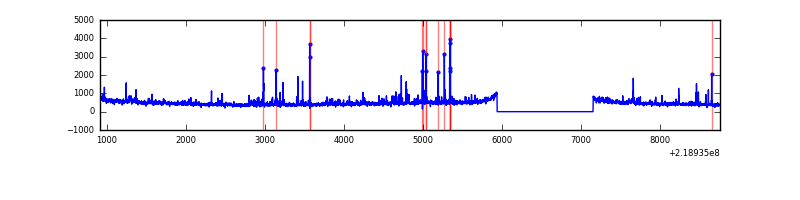 |
Top three noisy pixels from each quadrant. If the there are fewer than three noisy pixels in the level2.evt file, extra rows are filled as -1
| Pixel properties | Quadrant properties | ||||||
|---|---|---|---|---|---|---|---|
| Quadrant | DetID | PixID | Counts | Sigma | Mean | Median | Sigma |
| A | 8 | 15 | 30692 | 190.96 | 771 | 755 | 156.8 |
| A | 15 | 236 | 25248 | 156.23 | 771 | 755 | 156.8 |
| A | 10 | 133 | 9932 | 58.53 | 771 | 755 | 156.8 |
| B | 0 | 219 | 70028 | 473.82 | 777 | 761 | 146.2 |
| B | 15 | 204 | 46735 | 314.49 | 777 | 761 | 146.2 |
| B | 0 | 245 | 34117 | 228.17 | 777 | 761 | 146.2 |
| C | 1 | 16 | 299275 | 1743.43 | 746 | 749 | 171.2 |
| C | 12 | 4 | 7252 | 37.98 | 746 | 749 | 171.2 |
| C | 9 | 54 | 7116 | 37.18 | 746 | 749 | 171.2 |
| D | 2 | 152 | 168061 | 923.6 | 742 | 718 | 181.2 |
| D | 8 | 195 | 110304 | 604.83 | 742 | 718 | 181.2 |
| D | 2 | 14 | 62113 | 338.85 | 742 | 718 | 181.2 |
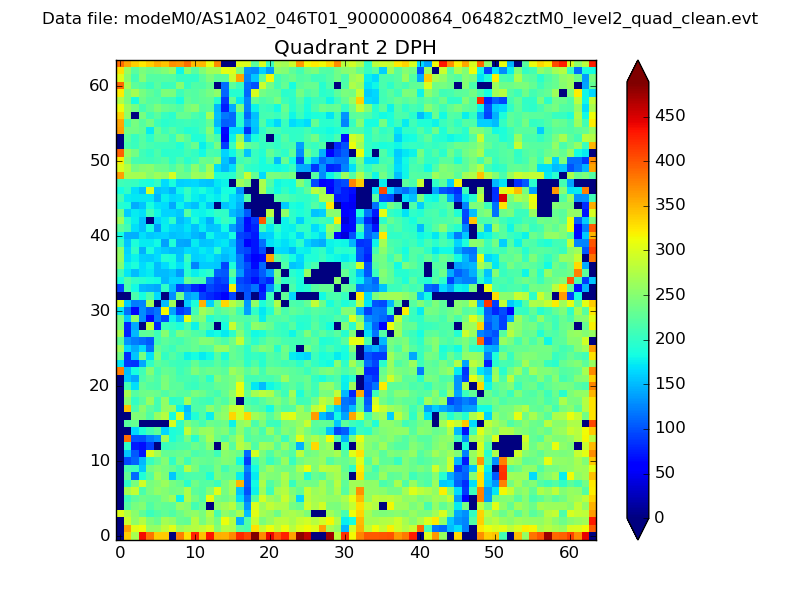
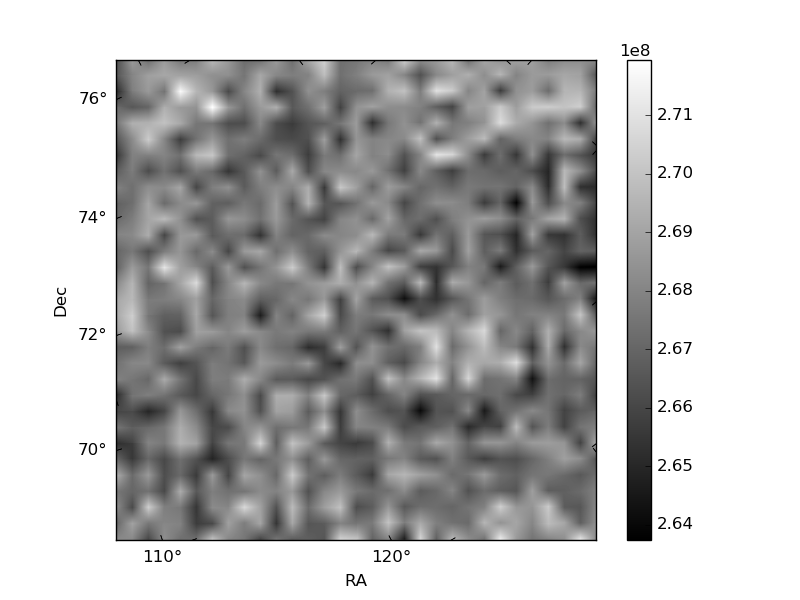
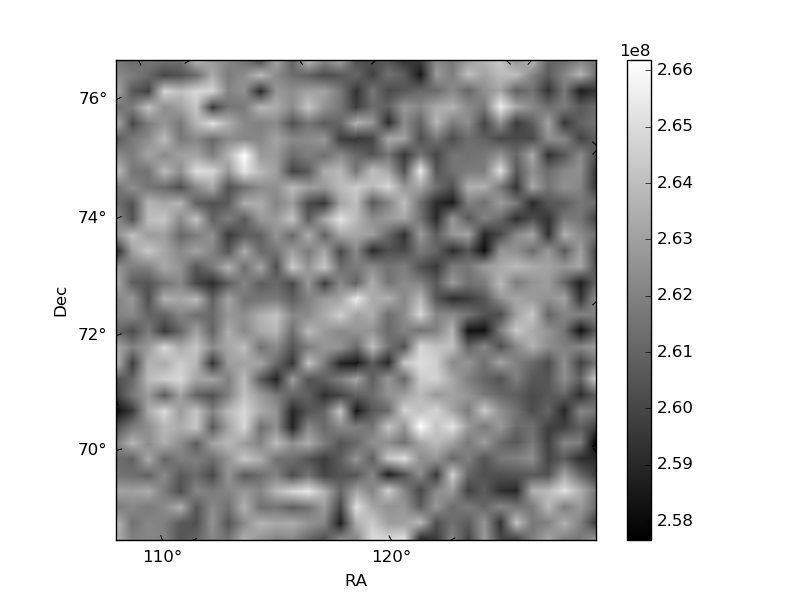
Histogram calculated using DETX and DETY for each event in the final _common_clean file
| Quadrant A | 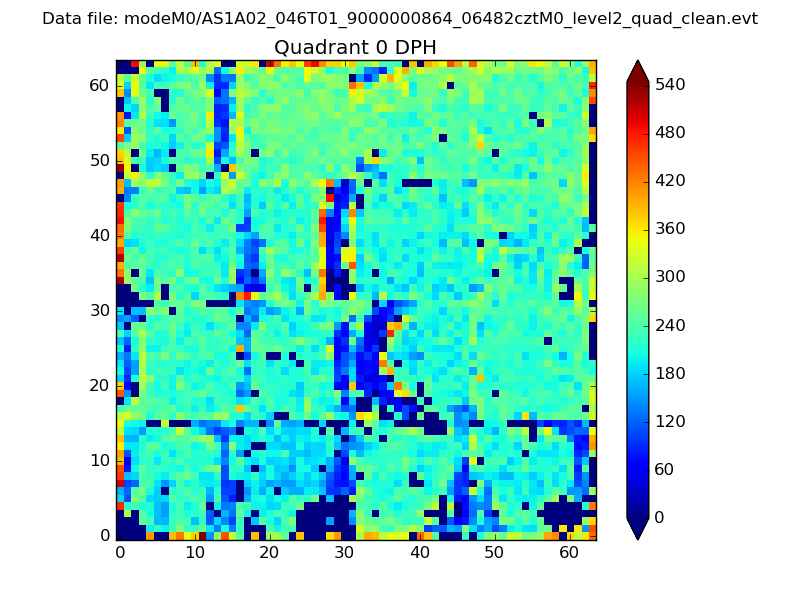 |
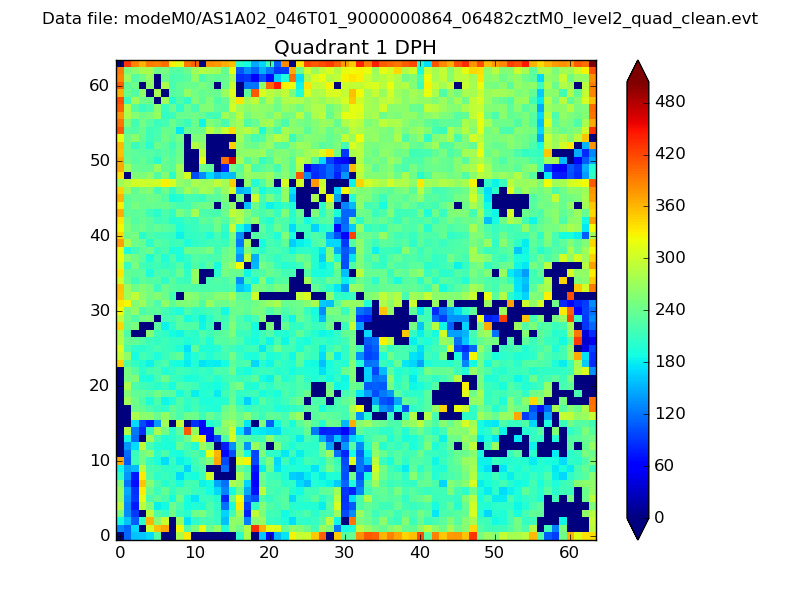 |
Quadrant B |
|---|---|---|---|
| Quadrant D | 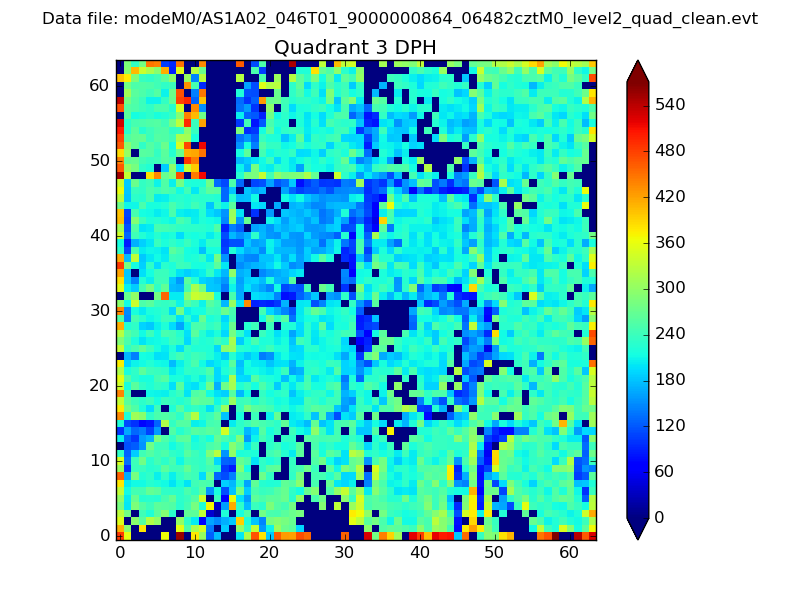 |
 |
Quadrant C |
| Plot type | Count rate plots | Images |
|---|---|---|
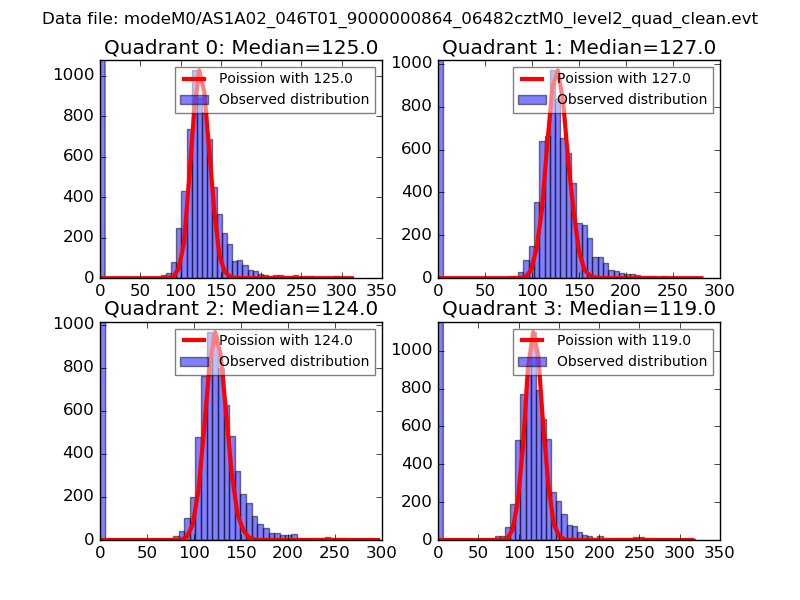
| Comparison with Poisson distribution Blue bars denote a histogram of data divided into 1 sec bins. Red curve is a Poisson curve with rate = median count rate of data. |
 |
 |
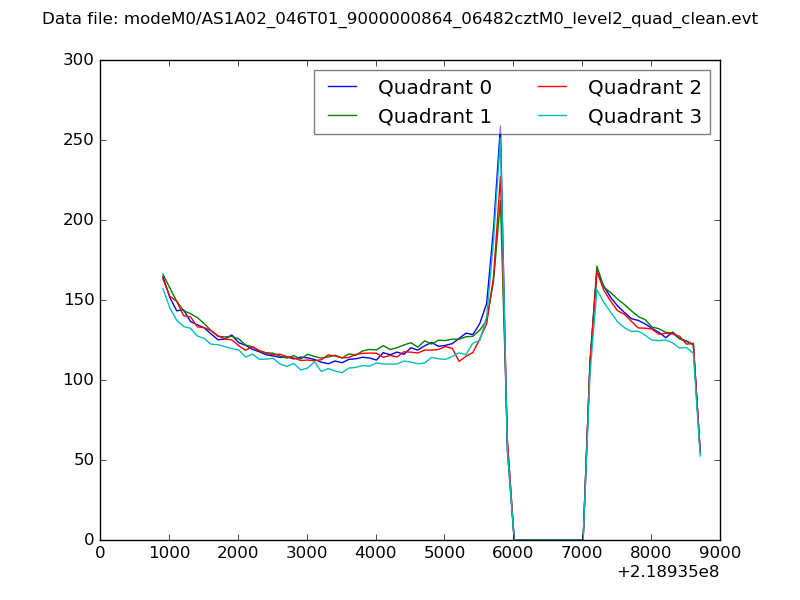
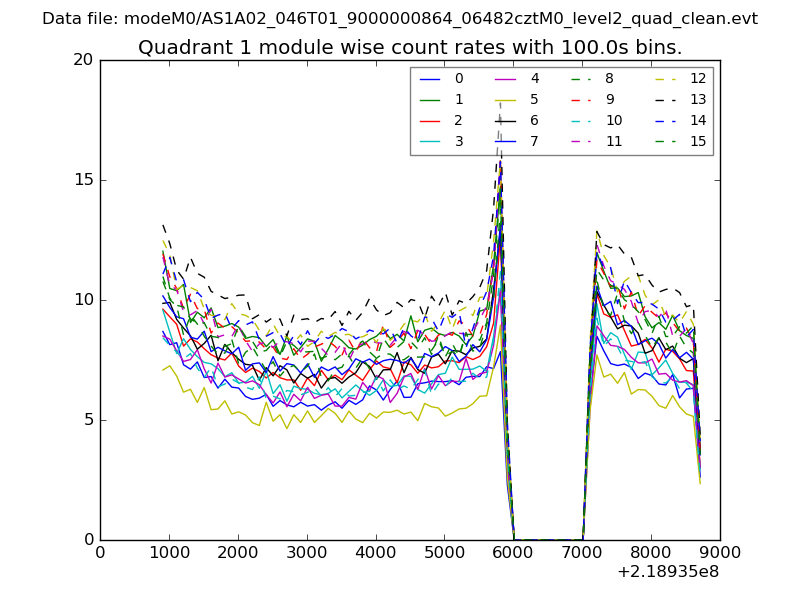
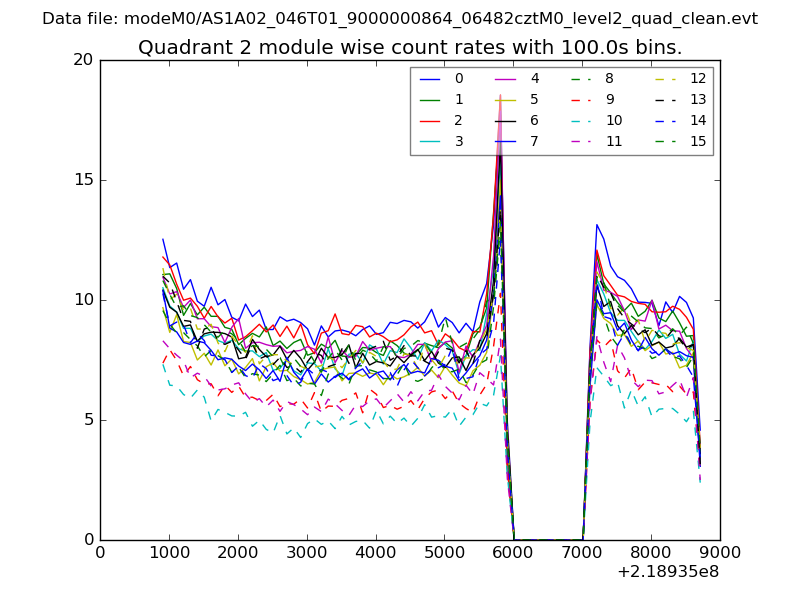
| Quadrant-wise count rates Data is divided into 100 sec bins |
 |
|
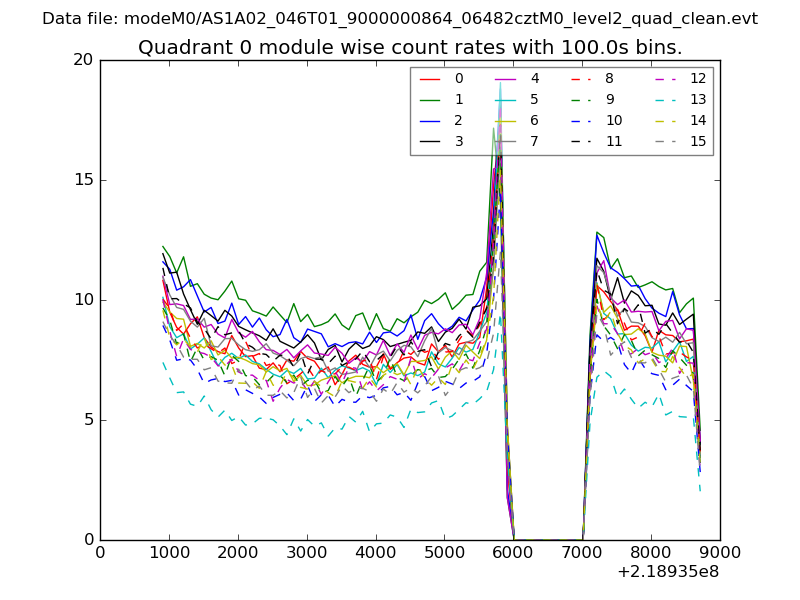
| Module-wise count rates for Quadrant A Data is divided into 100 sec bins |
 |
 |
| Module-wise count rates for Quadrant B Data is divided into 100 sec bins |
 |
 |
| Module-wise count rates for Quadrant C Data is divided into 100 sec bins |
 |
 |
| Module-wise count rates for Quadrant D Data is divided into 100 sec bins |
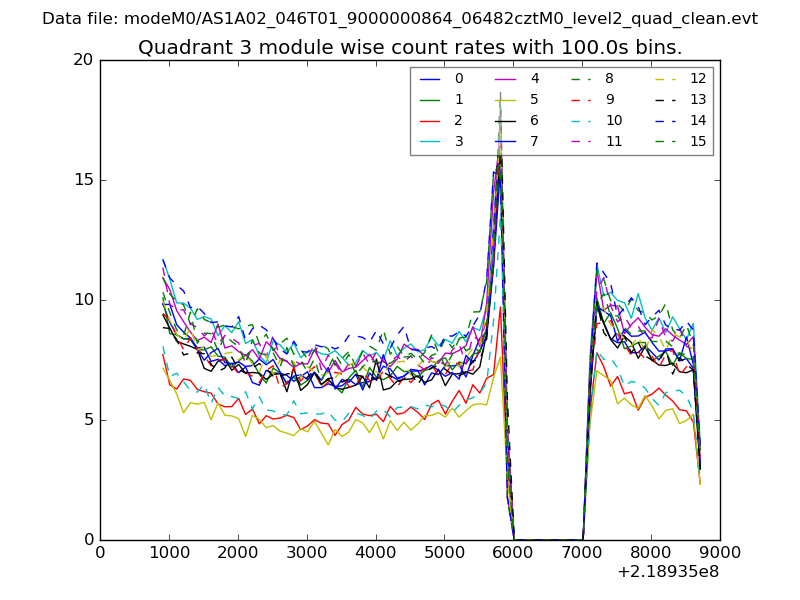 |
 |
| Parameter | Plot |
|---|---|
| CZT HV Monitor | 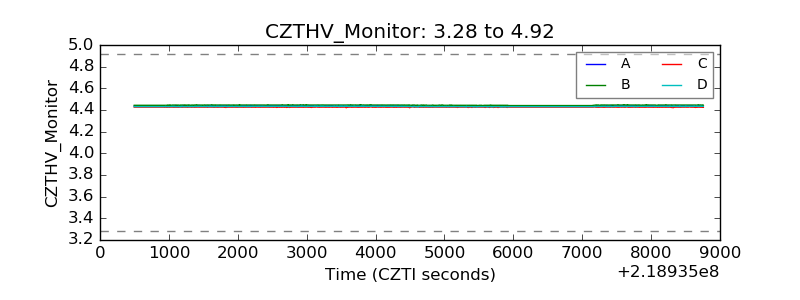 |
| D_VDD | 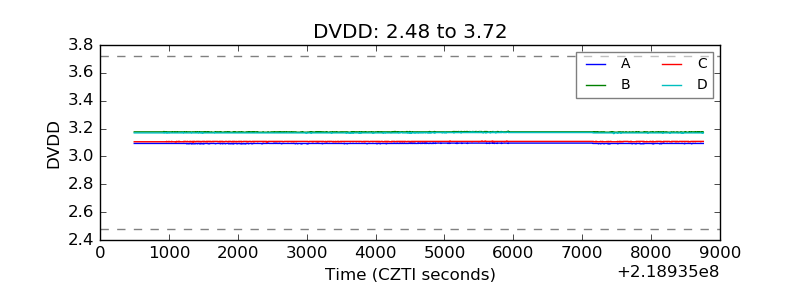 |
| Temperature 1 | 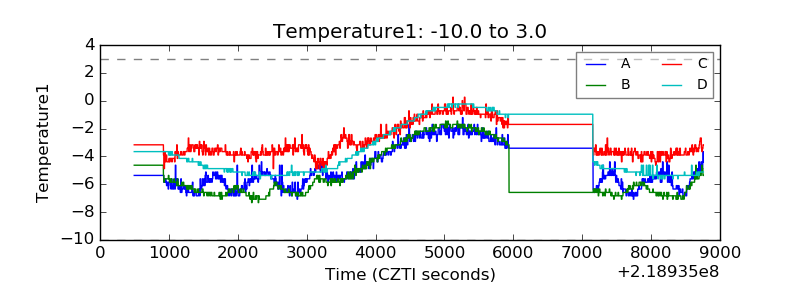 |
| Veto HV Monitor | 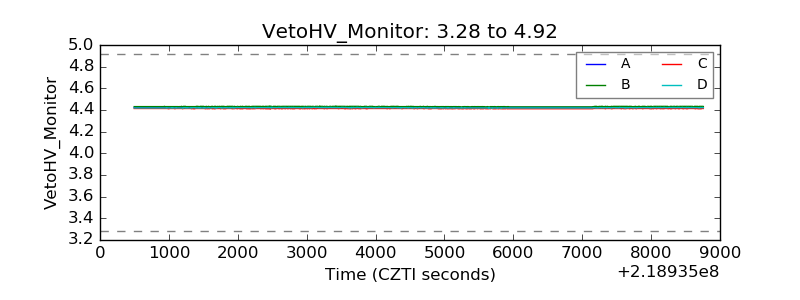 |
| Veto LLD | 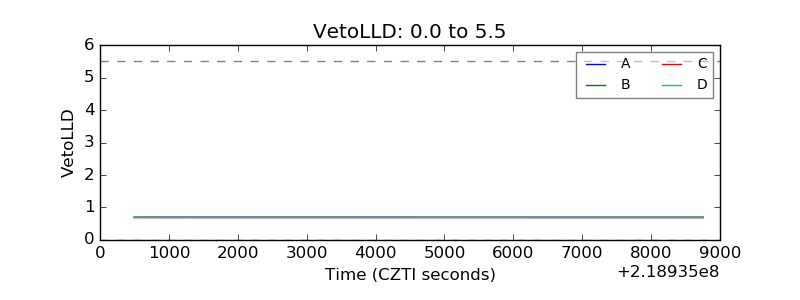 |
| Alpha Counter | 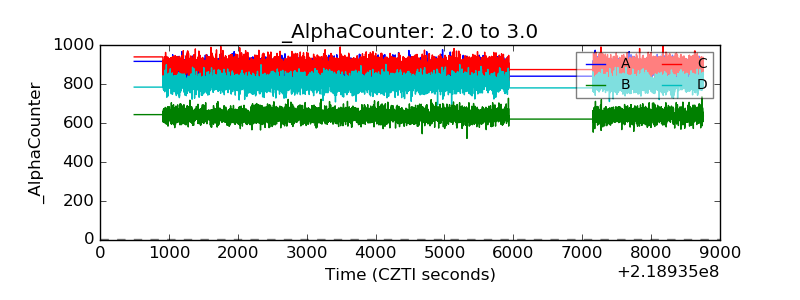 |
| _CPM_Rate | 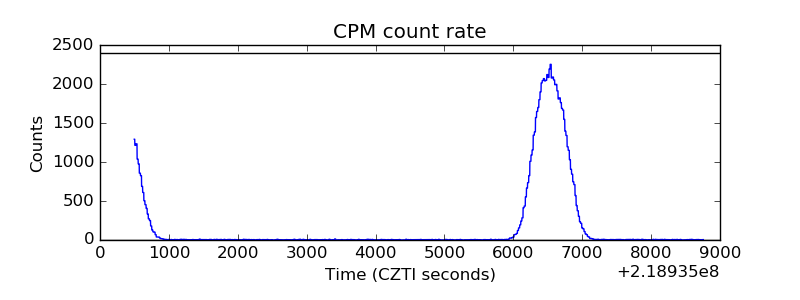 |
| CZT Counter | 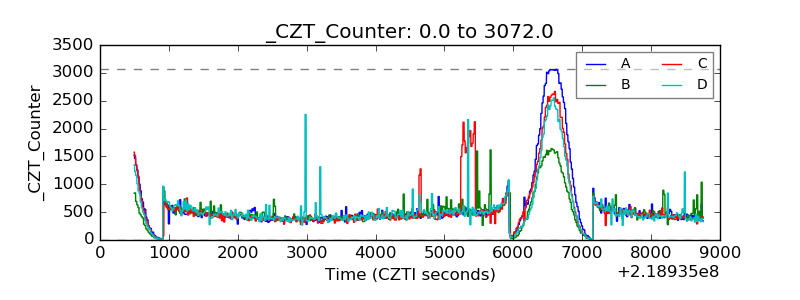 |
| +2.5 Volts monitor |  |
| +5 Volts monitor |  |
| _ROLL_ROT | 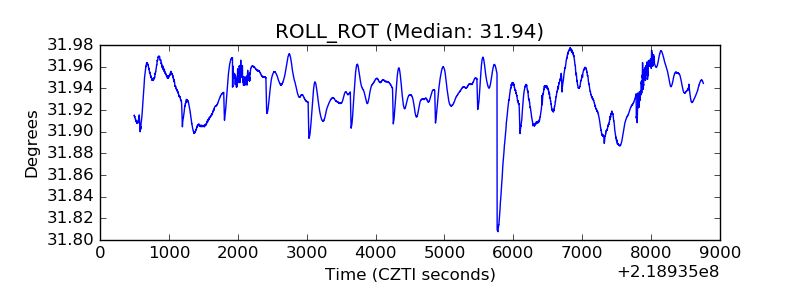 |
| _Roll_DEC | 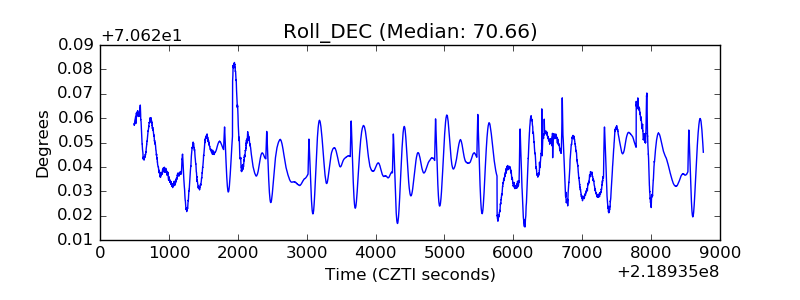 |
| _Roll_RA | 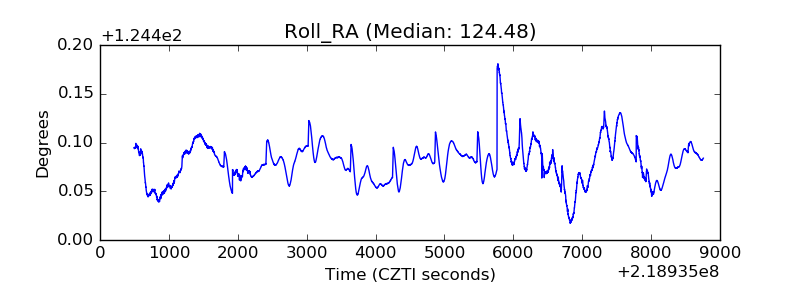 |
| Veto Counter | 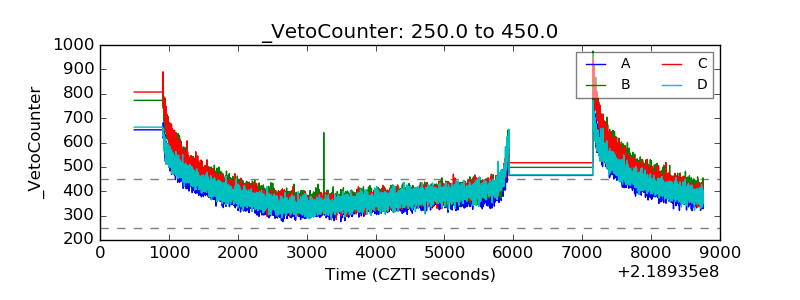 |