| Param | Original file | Final file |
|---|---|---|
| Filename | modeM0/AS1A02_046T01_9000000864_06485cztM0_level2.evt | modeM0/AS1A02_046T01_9000000864_06485cztM0_level2_quad_clean.evt |
| Size (bytes) | 693,054,720 | 201,058,560 |
| Size | 660.9 MB | 191.7 MB |
| Events in quadrant A | 5,259,031 | 1,358,657 |
| Events in quadrant B | 5,235,011 | 1,382,785 |
| Events in quadrant C | 4,632,988 | 1,329,873 |
| Events in quadrant D | 5,140,149 | 1,281,613 |
| Mode M0 | |||
|---|---|---|---|
| Quadrant | BADHDUFLAG | Total packets | Discarded packets |
| A | 0 | 22909 | 3 |
| B | 0 | 22750 | 2 |
| C | 0 | 21573 | 2 |
| D | 0 | 22710 | 2 |
| Mode SS | |||
|---|---|---|---|
| Quadrant | BADHDUFLAG | Total packets | Discarded packets |
| A | 0 | 218 | 0 |
| B | 0 | 218 | 0 |
| C | 0 | 218 | 0 |
| D | 0 | 218 | 0 |
| Mode M9 | |||
|---|---|---|---|
| Quadrant | BADHDUFLAG | Total packets | Discarded packets |
| A | 0 | 25 | 0 |
| B | 0 | 25 | 0 |
| C | 0 | 25 | 0 |
| D | 0 | 25 | 0 |
| Quadrant | Total seconds | Saturated seconds | Saturation percentage |
|---|---|---|---|
| A | 10641 | 201 | 1.888920% |
| B | 10641 | 151 | 1.419040% |
| C | 10641 | 19 | 0.178555% |
| D | 10641 | 77 | 0.723616% |
Noise dominated data is calculated using 1-second bins in cleaned event files. If a bin has >2000 counts, and if more than 50% of those come from <1% of pixels, then it is considered to be noise-dominated and hence unusable.
| Quadrant | # 1 sec bins | Bins with >0 counts | Bins with >2000 counts | High rate bins dominated by noise | Noise dominated (total time) | Noise dominated (detector-on time) | Marked lightcurve |
|---|---|---|---|---|---|---|---|
| A | 13211 | 10644 | 114 | 114 | 0.86% | 1.07% | 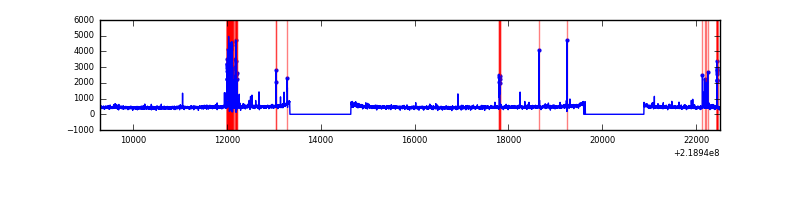 |
| B | 13211 | 10644 | 61 | 61 | 0.46% | 0.57% | 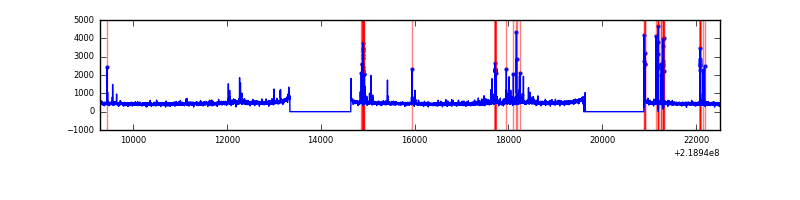 |
| C | 13211 | 10644 | 0 | 0 | 0.00% | 0.00% | 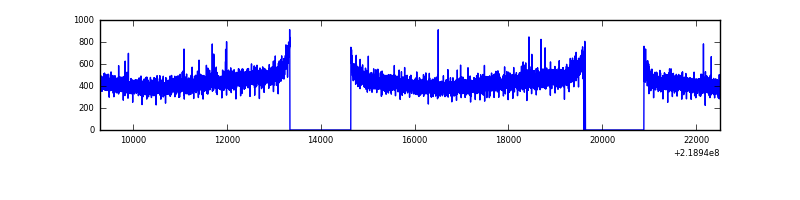 |
| D | 13211 | 10644 | 28 | 28 | 0.21% | 0.26% | 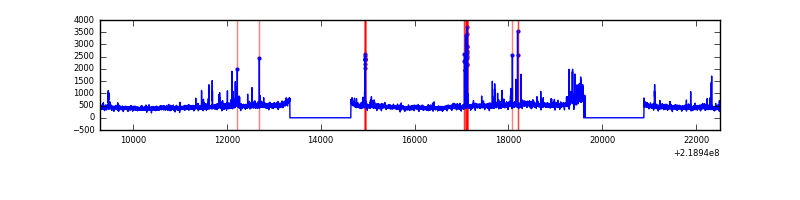 |
Top three noisy pixels from each quadrant. If the there are fewer than three noisy pixels in the level2.evt file, extra rows are filled as -1
| Pixel properties | Quadrant properties | ||||||
|---|---|---|---|---|---|---|---|
| Quadrant | DetID | PixID | Counts | Sigma | Mean | Median | Sigma |
| A | 15 | 234 | 266325 | 1076.64 | 1231 | 1208 | 246.2 |
| A | 15 | 236 | 96632 | 387.52 | 1231 | 1208 | 246.2 |
| A | 15 | 174 | 91989 | 368.66 | 1231 | 1208 | 246.2 |
| B | 0 | 219 | 176040 | 762.74 | 1238 | 1210 | 229.2 |
| B | 0 | 198 | 108138 | 466.5 | 1238 | 1210 | 229.2 |
| B | 0 | 197 | 55315 | 236.05 | 1238 | 1210 | 229.2 |
| C | 1 | 16 | 19528 | 68.28 | 1178 | 1183 | 268.7 |
| C | 12 | 4 | 9974 | 32.72 | 1178 | 1183 | 268.7 |
| C | 13 | 61 | 9289 | 30.17 | 1178 | 1183 | 268.7 |
| D | 2 | 152 | 204007 | 709.87 | 1185 | 1147 | 285.8 |
| D | 13 | 137 | 146377 | 508.2 | 1185 | 1147 | 285.8 |
| D | 8 | 195 | 129893 | 450.52 | 1185 | 1147 | 285.8 |
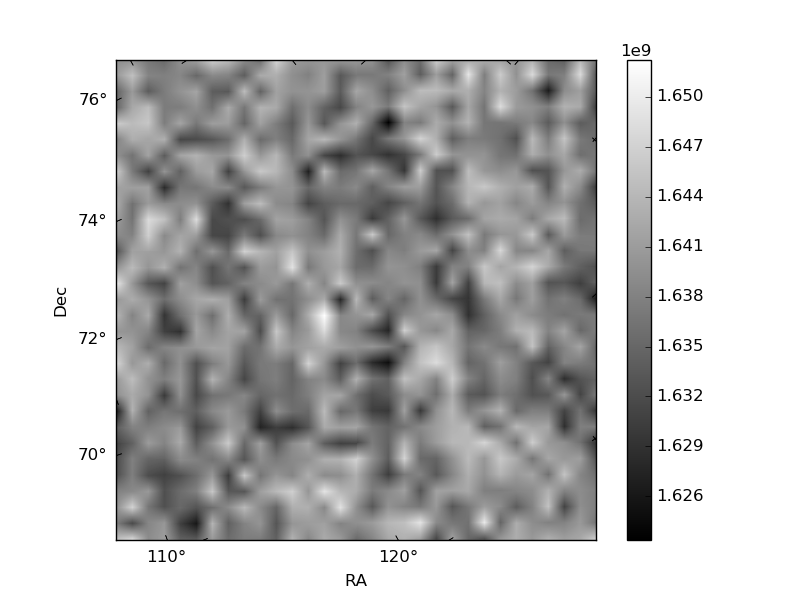
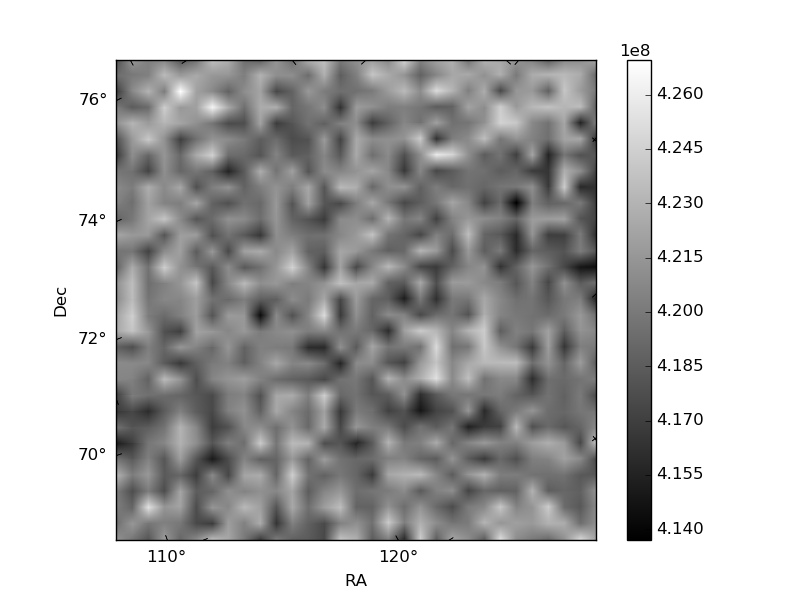
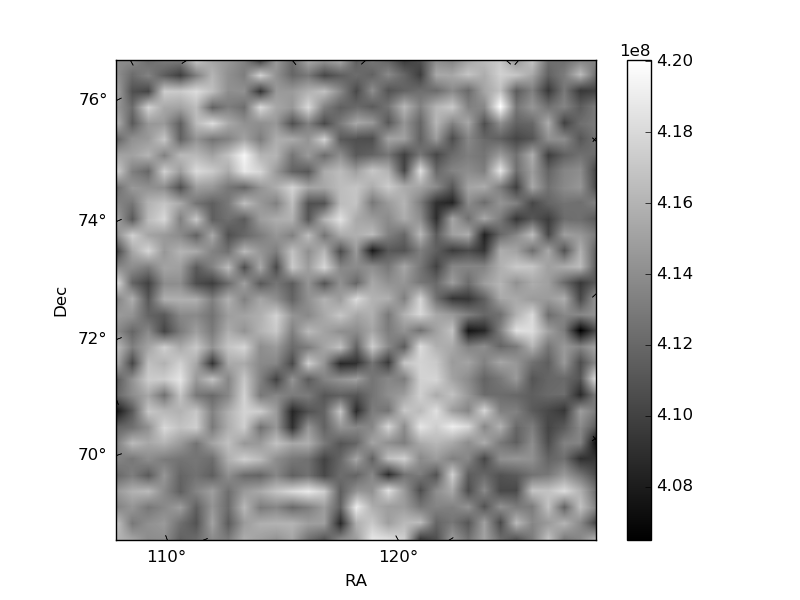
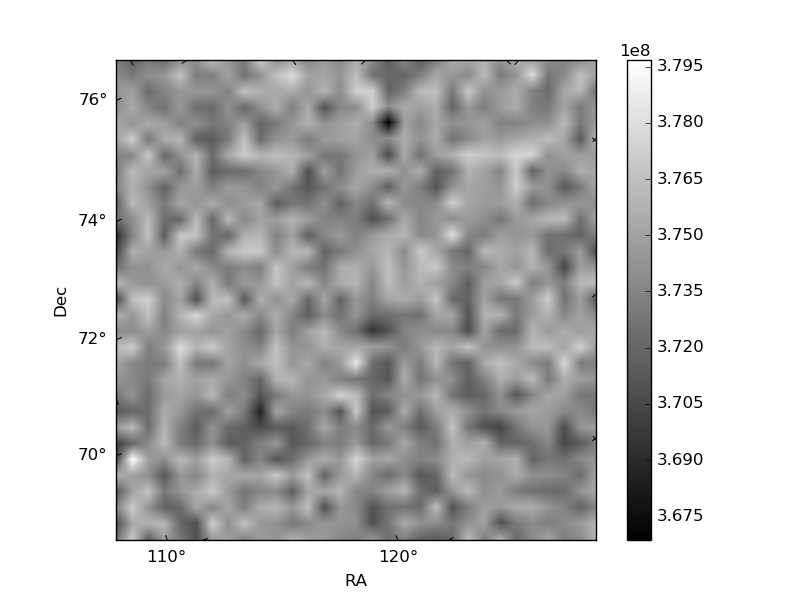
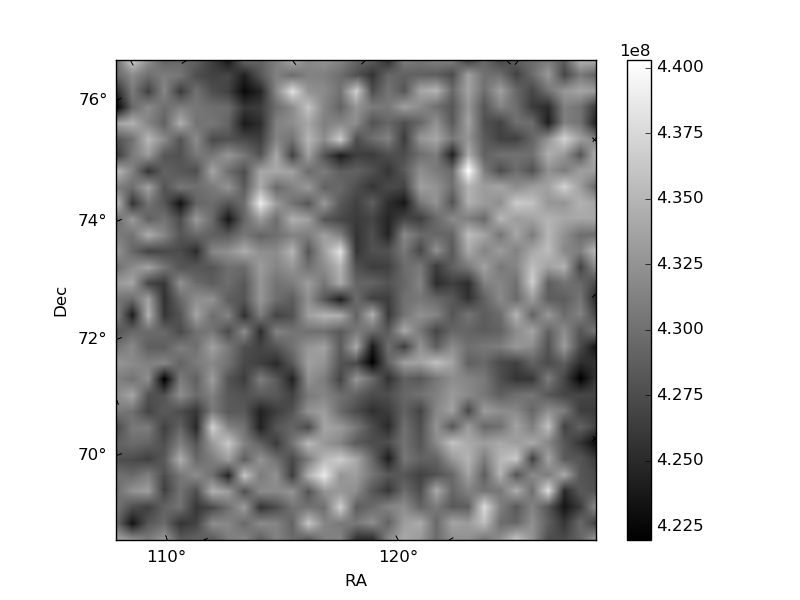
Histogram calculated using DETX and DETY for each event in the final _common_clean file
| Quadrant A | 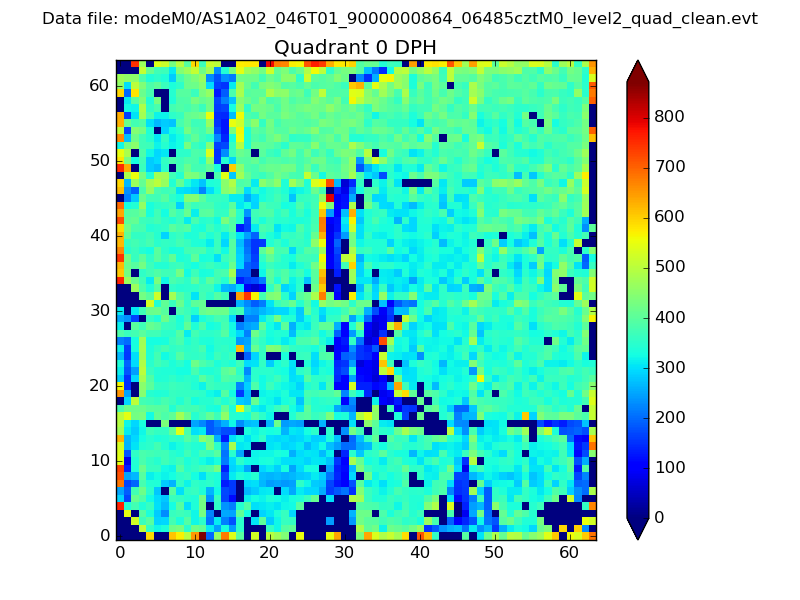 |
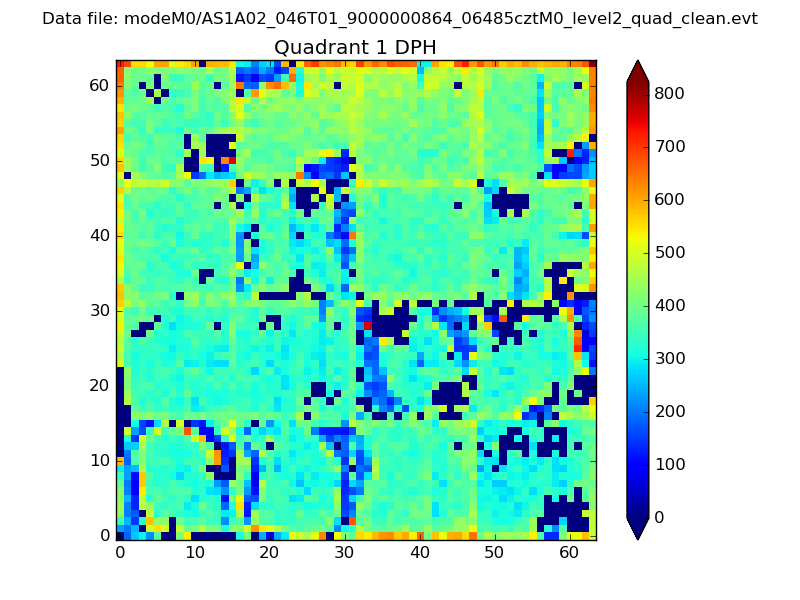 |
Quadrant B |
|---|---|---|---|
| Quadrant D | 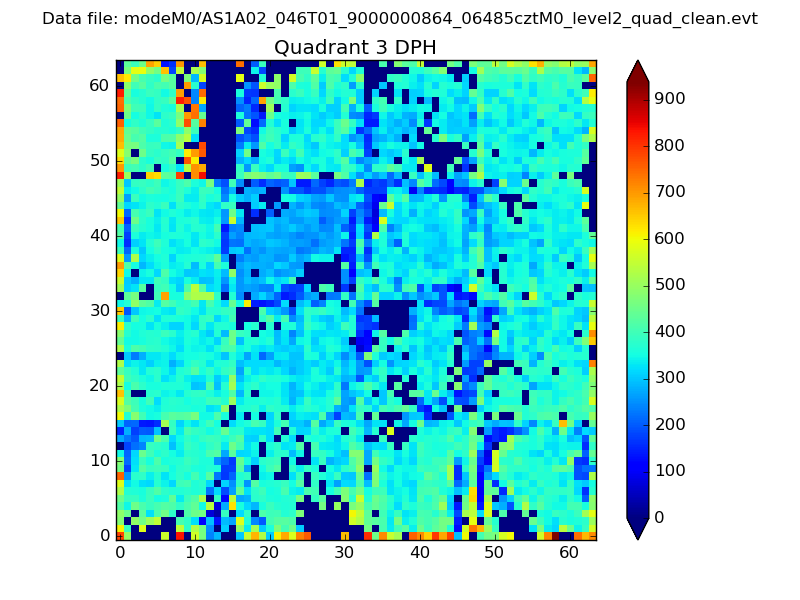 |
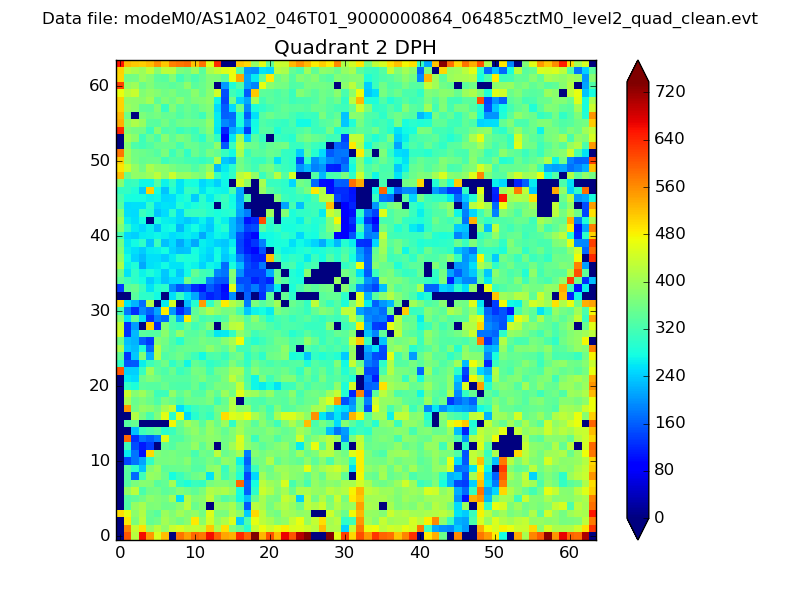 |
Quadrant C |
| Plot type | Count rate plots | Images |
|---|---|---|
| Comparison with Poisson distribution Blue bars denote a histogram of data divided into 1 sec bins. Red curve is a Poisson curve with rate = median count rate of data. |
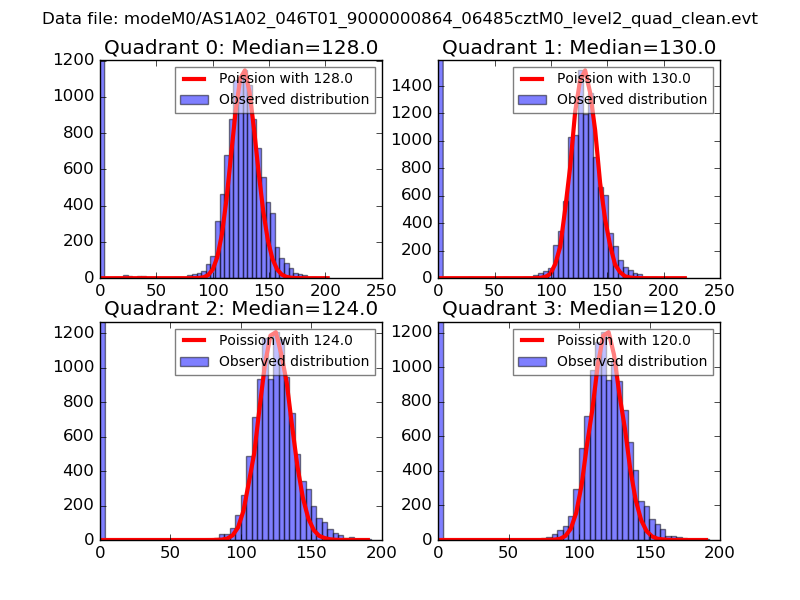 |
 |
| Quadrant-wise count rates Data is divided into 100 sec bins |
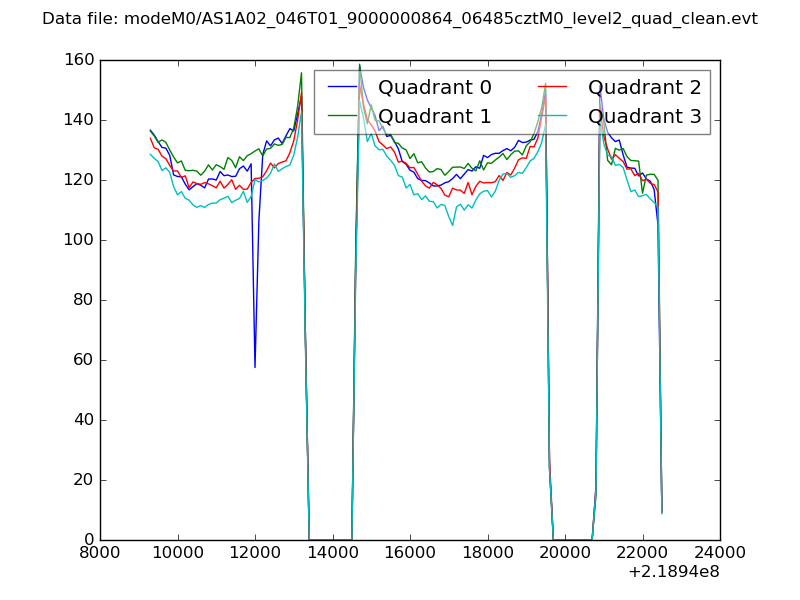 |
|
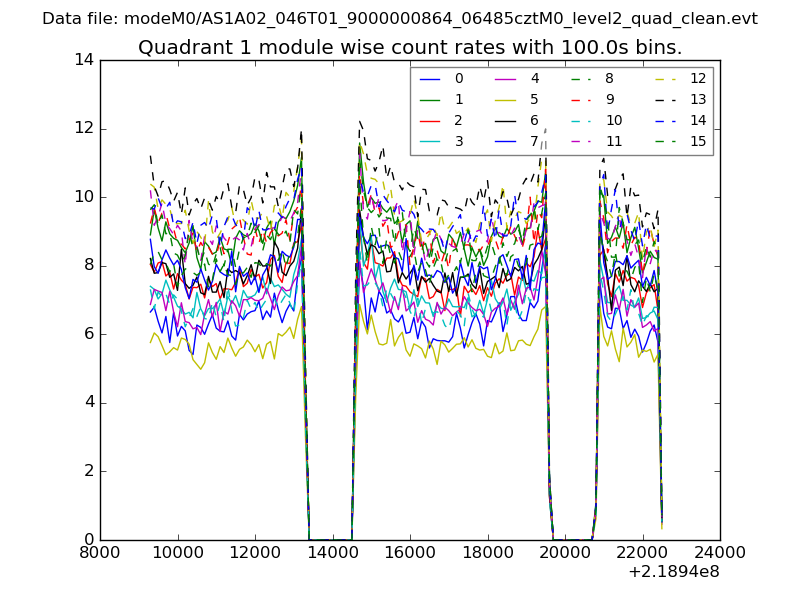
| Module-wise count rates for Quadrant A Data is divided into 100 sec bins |
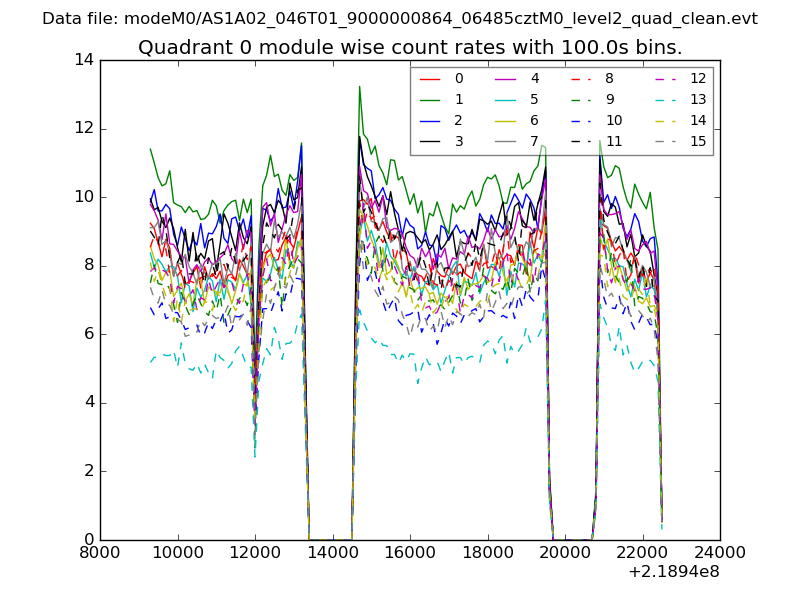 |
 |
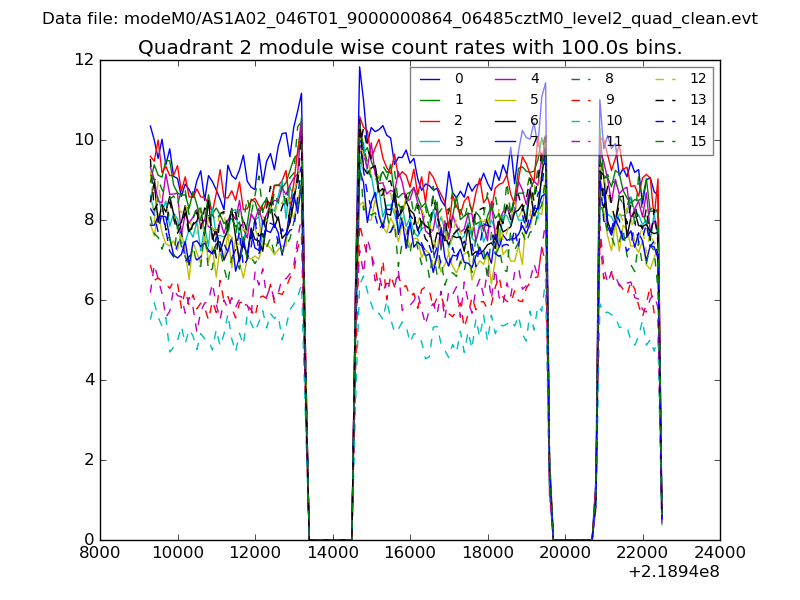
| Module-wise count rates for Quadrant B Data is divided into 100 sec bins |
 |
 |
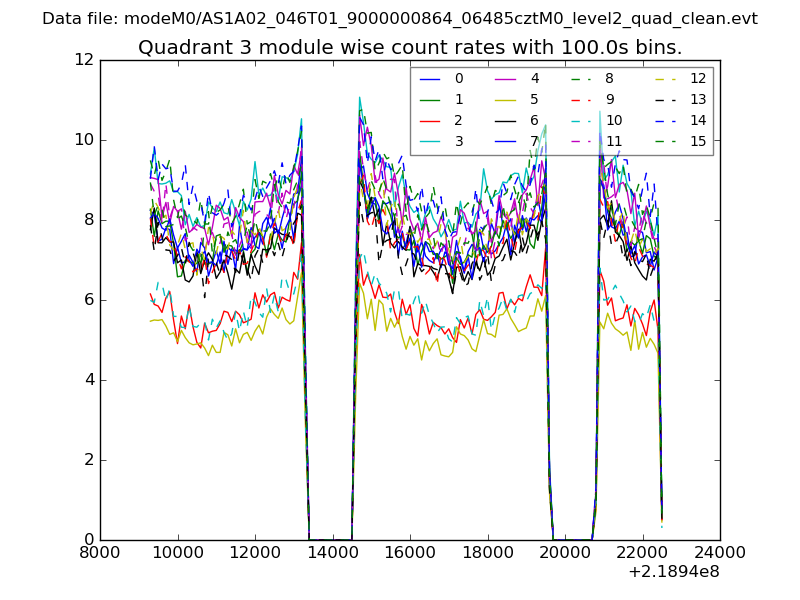
| Module-wise count rates for Quadrant C Data is divided into 100 sec bins |
 |
 |
| Module-wise count rates for Quadrant D Data is divided into 100 sec bins |
 |
 |
| Parameter | Plot |
|---|---|
| CZT HV Monitor | 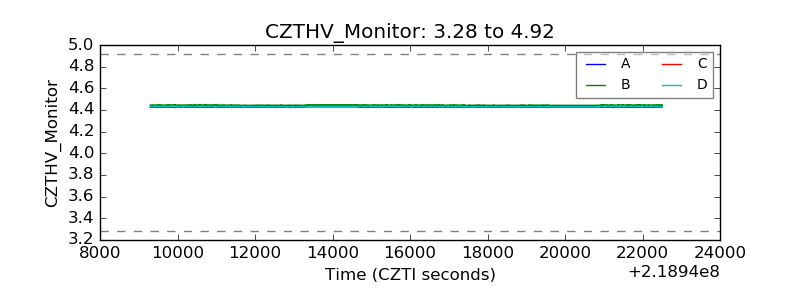 |
| D_VDD | 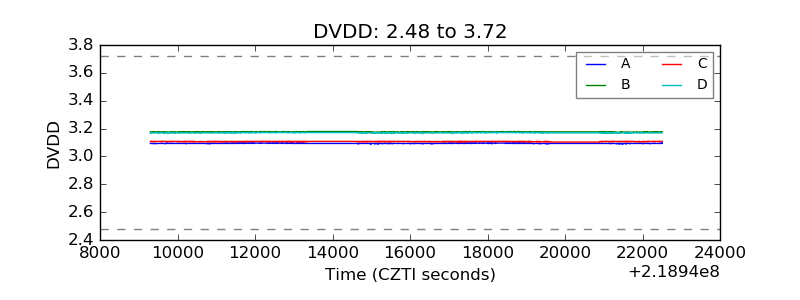 |
| Temperature 1 | 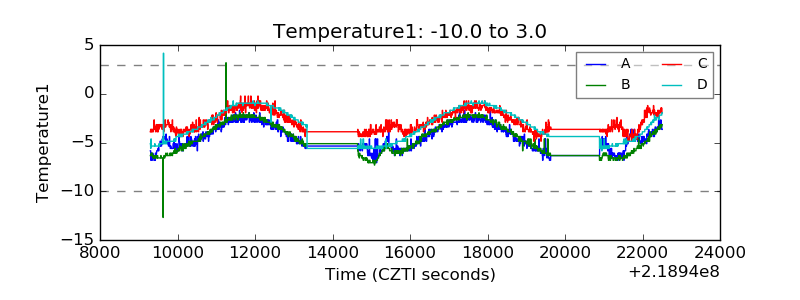 |
| Veto HV Monitor | 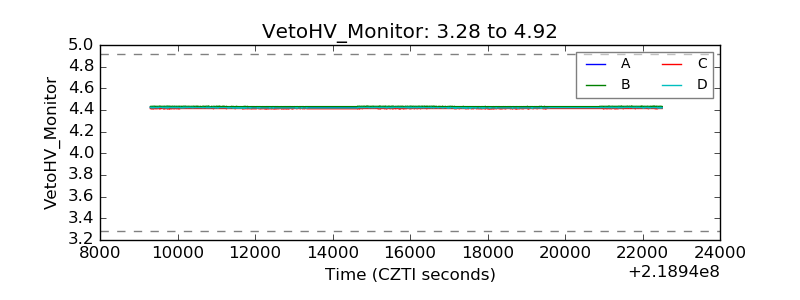 |
| Veto LLD | 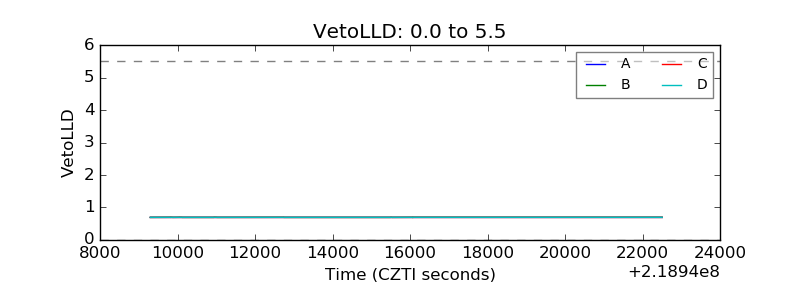 |
| Alpha Counter | 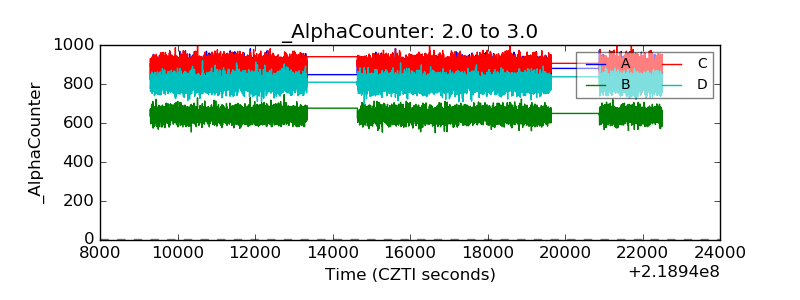 |
| _CPM_Rate | 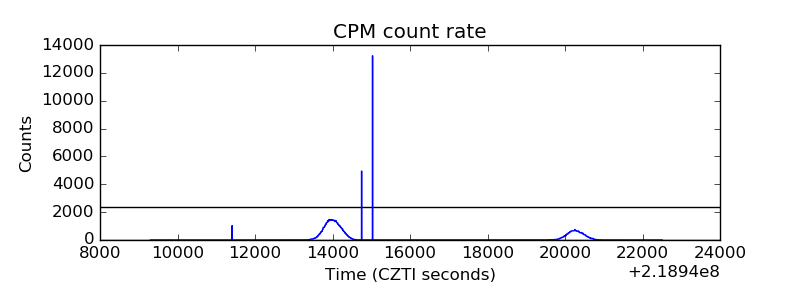 |
| CZT Counter | 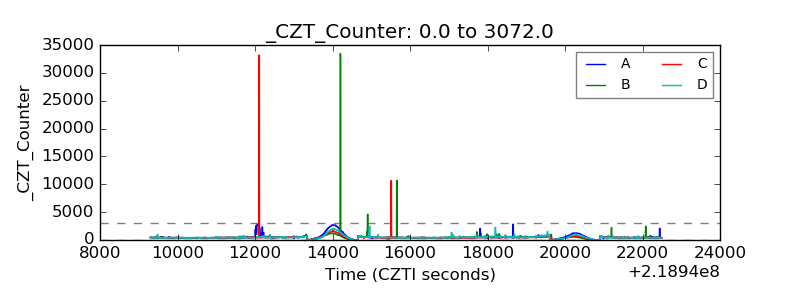 |
| +2.5 Volts monitor |  |
| +5 Volts monitor |  |
| _ROLL_ROT | 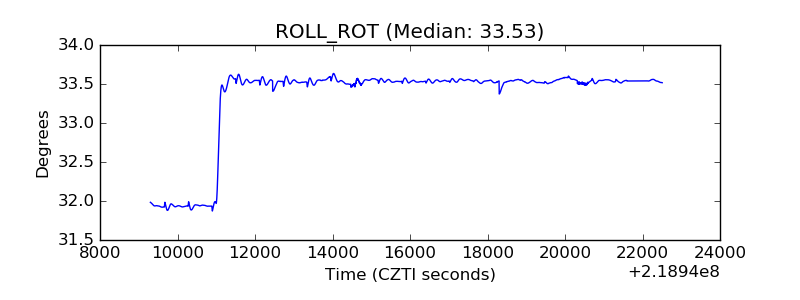 |
| _Roll_DEC | 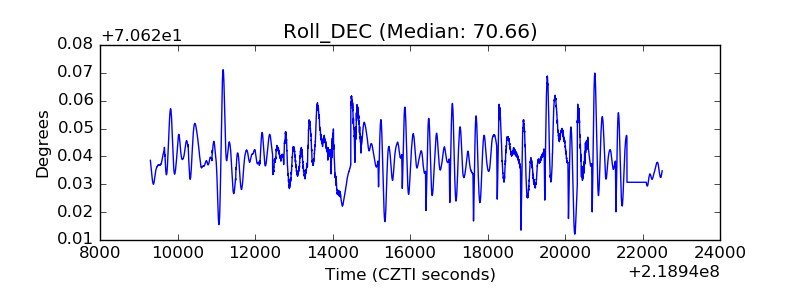 |
| _Roll_RA | 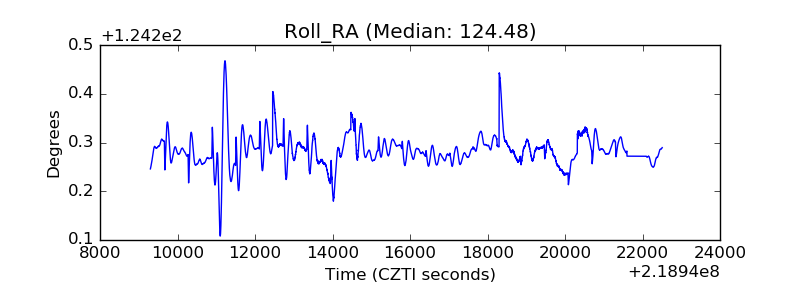 |
| Veto Counter | 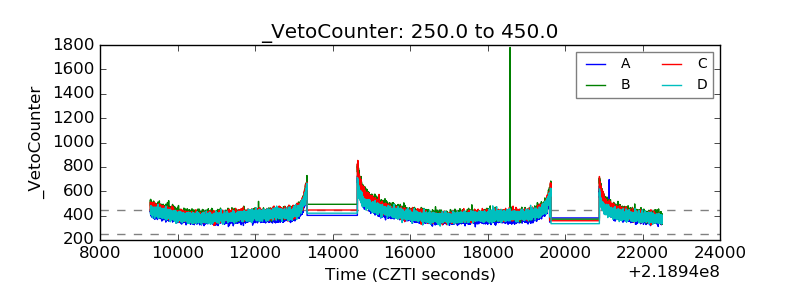 |