| Param | Original file | Final file |
|---|---|---|
| Filename | modeM0/AS1A02_046T01_9000000864_06486cztM0_level2.evt | modeM0/AS1A02_046T01_9000000864_06486cztM0_level2_quad_clean.evt |
| Size (bytes) | 388,111,680 | 109,131,840 |
| Size | 370.1 MB | 104.1 MB |
| Events in quadrant A | 2,844,165 | 732,815 |
| Events in quadrant B | 3,038,943 | 738,955 |
| Events in quadrant C | 2,563,702 | 718,055 |
| Events in quadrant D | 2,897,692 | 695,402 |
| Mode M0 | |||
|---|---|---|---|
| Quadrant | BADHDUFLAG | Total packets | Discarded packets |
| A | 0 | 12668 | 3 |
| B | 0 | 13155 | 2 |
| C | 0 | 12192 | 2 |
| D | 0 | 12770 | 2 |
| Mode SS | |||
|---|---|---|---|
| Quadrant | BADHDUFLAG | Total packets | Discarded packets |
| A | 0 | 122 | 0 |
| B | 0 | 122 | 0 |
| C | 0 | 122 | 0 |
| D | 0 | 122 | 0 |
| Mode M9 | |||
|---|---|---|---|
| Quadrant | BADHDUFLAG | Total packets | Discarded packets |
| A | 0 | 10 | 0 |
| B | 0 | 10 | 0 |
| C | 0 | 10 | 0 |
| D | 0 | 10 | 0 |
| Quadrant | Total seconds | Saturated seconds | Saturation percentage |
|---|---|---|---|
| A | 6012 | 128 | 2.129075% |
| B | 6012 | 155 | 2.578177% |
| C | 6012 | 62 | 1.031271% |
| D | 6012 | 78 | 1.297405% |
Noise dominated data is calculated using 1-second bins in cleaned event files. If a bin has >2000 counts, and if more than 50% of those come from <1% of pixels, then it is considered to be noise-dominated and hence unusable.
| Quadrant | # 1 sec bins | Bins with >0 counts | Bins with >2000 counts | High rate bins dominated by noise | Noise dominated (total time) | Noise dominated (detector-on time) | Marked lightcurve |
|---|---|---|---|---|---|---|---|
| A | 7002 | 6014 | 14 | 14 | 0.20% | 0.23% | 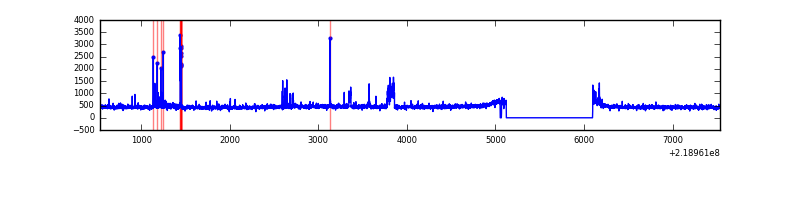 |
| B | 7002 | 6014 | 36 | 36 | 0.51% | 0.60% | 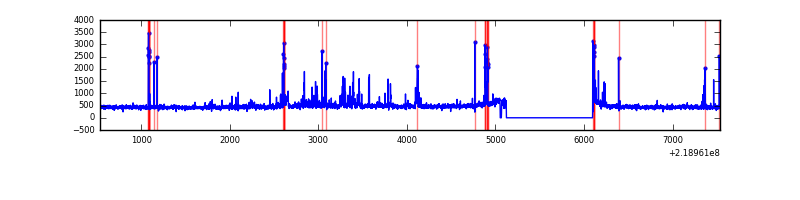 |
| C | 7002 | 6014 | 0 | 0 | 0.00% | 0.00% | 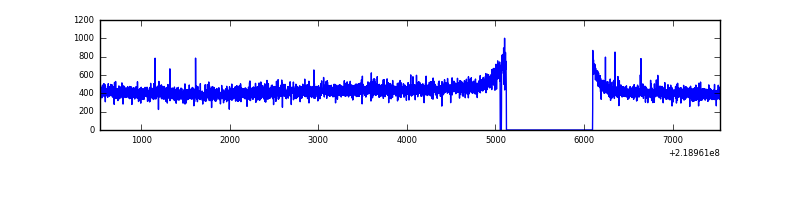 |
| D | 7002 | 6014 | 3 | 3 | 0.04% | 0.05% | 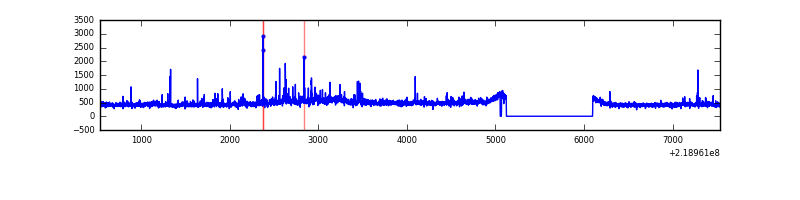 |
Top three noisy pixels from each quadrant. If the there are fewer than three noisy pixels in the level2.evt file, extra rows are filled as -1
| Pixel properties | Quadrant properties | ||||||
|---|---|---|---|---|---|---|---|
| Quadrant | DetID | PixID | Counts | Sigma | Mean | Median | Sigma |
| A | 15 | 236 | 133709 | 946.21 | 686 | 671 | 140.6 |
| A | 8 | 15 | 49415 | 346.68 | 686 | 671 | 140.6 |
| A | 10 | 133 | 11694 | 78.4 | 686 | 671 | 140.6 |
| B | 4 | 170 | 137211 | 1047.36 | 685 | 669 | 130.4 |
| B | 0 | 219 | 71321 | 541.94 | 685 | 669 | 130.4 |
| B | 3 | 220 | 54877 | 415.81 | 685 | 669 | 130.4 |
| C | 13 | 61 | 5205 | 30.14 | 654 | 656 | 150.9 |
| C | 1 | 16 | 4125 | 22.99 | 654 | 656 | 150.9 |
| C | 12 | 4 | 3883 | 21.38 | 654 | 656 | 150.9 |
| D | 8 | 195 | 205167 | 1270.02 | 660 | 637 | 161.0 |
| D | 2 | 152 | 133550 | 825.31 | 660 | 637 | 161.0 |
| D | 2 | 234 | 18187 | 108.98 | 660 | 637 | 161.0 |
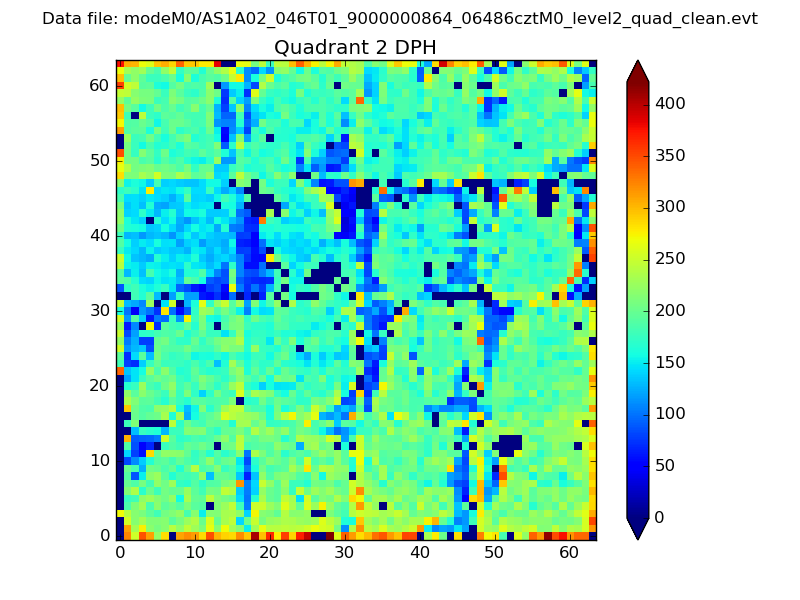
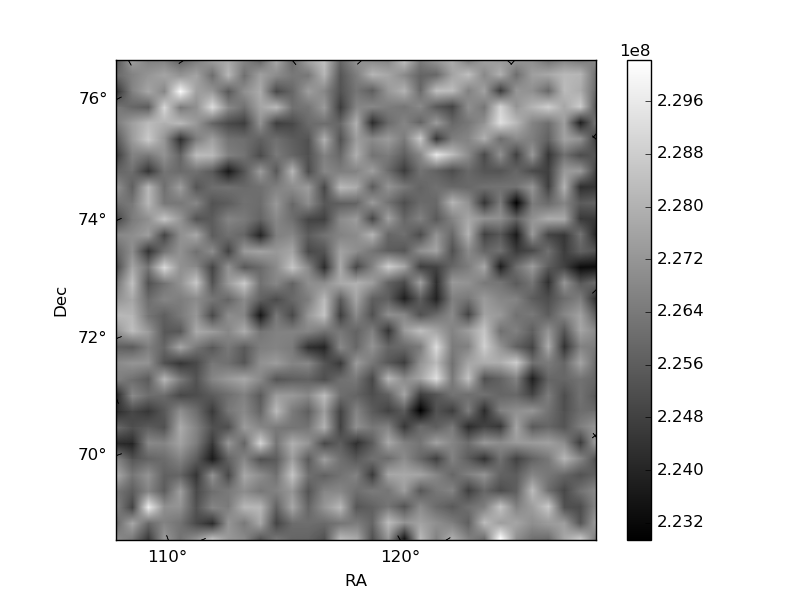
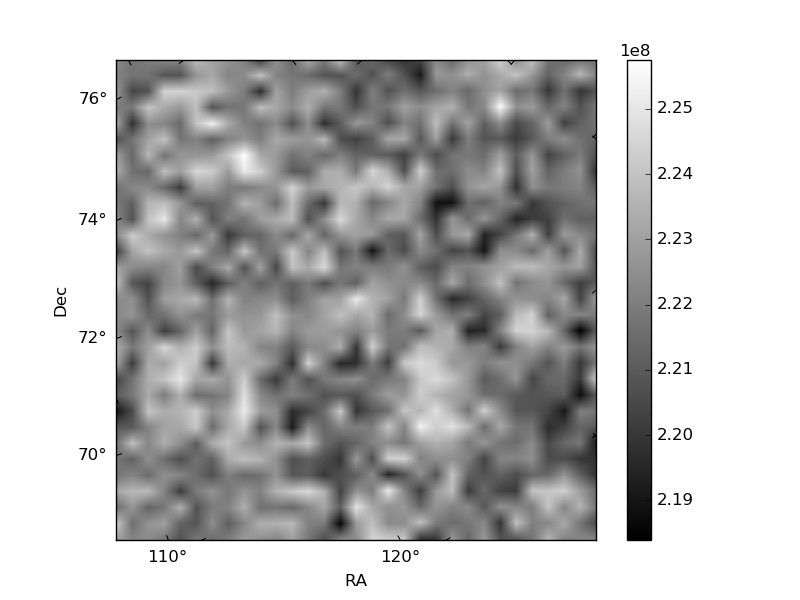
Histogram calculated using DETX and DETY for each event in the final _common_clean file
| Quadrant A | 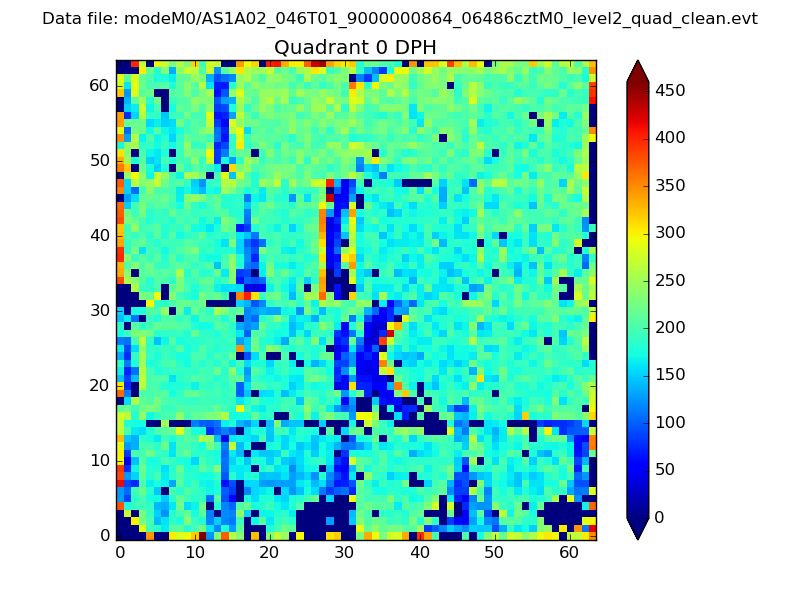 |
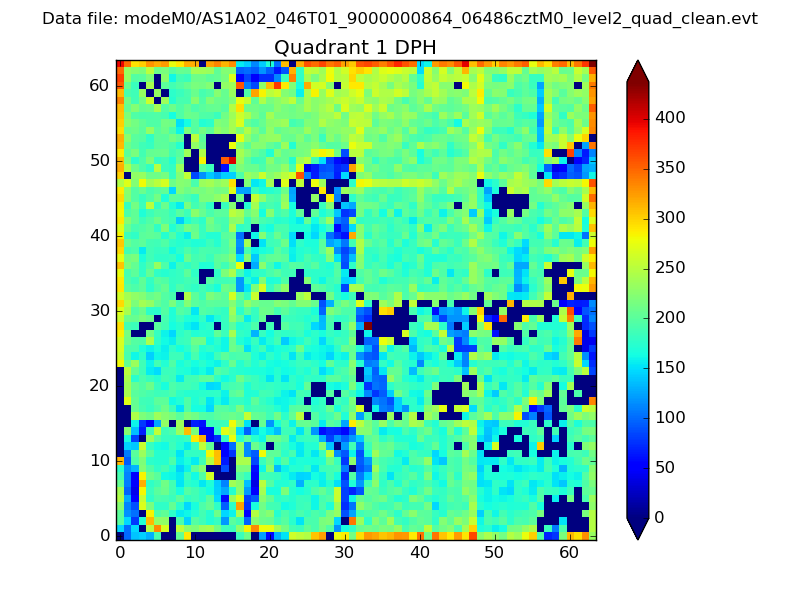 |
Quadrant B |
|---|---|---|---|
| Quadrant D | 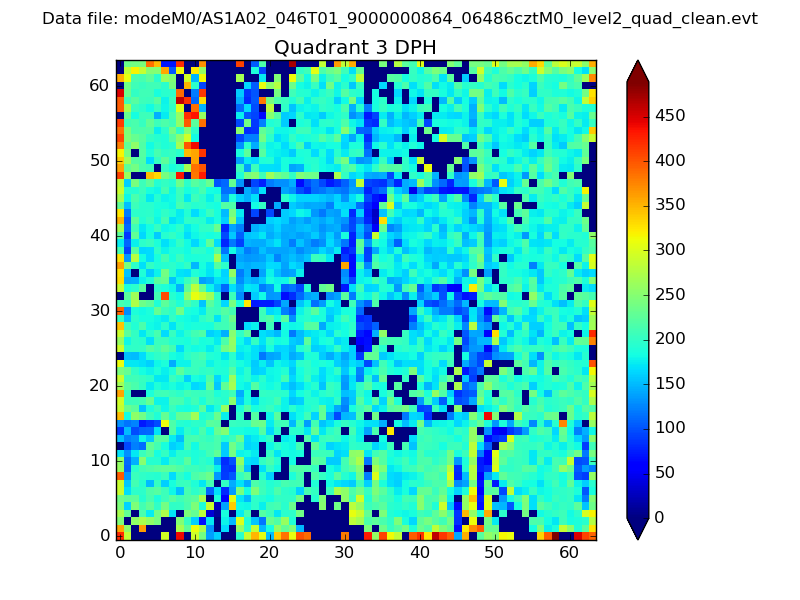 |
 |
Quadrant C |
| Plot type | Count rate plots | Images |
|---|---|---|
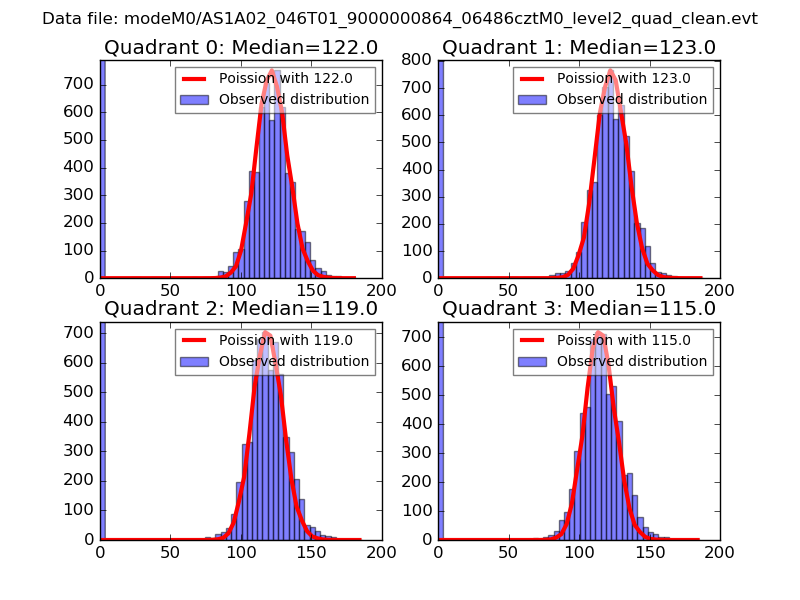
| Comparison with Poisson distribution Blue bars denote a histogram of data divided into 1 sec bins. Red curve is a Poisson curve with rate = median count rate of data. |
 |
 |
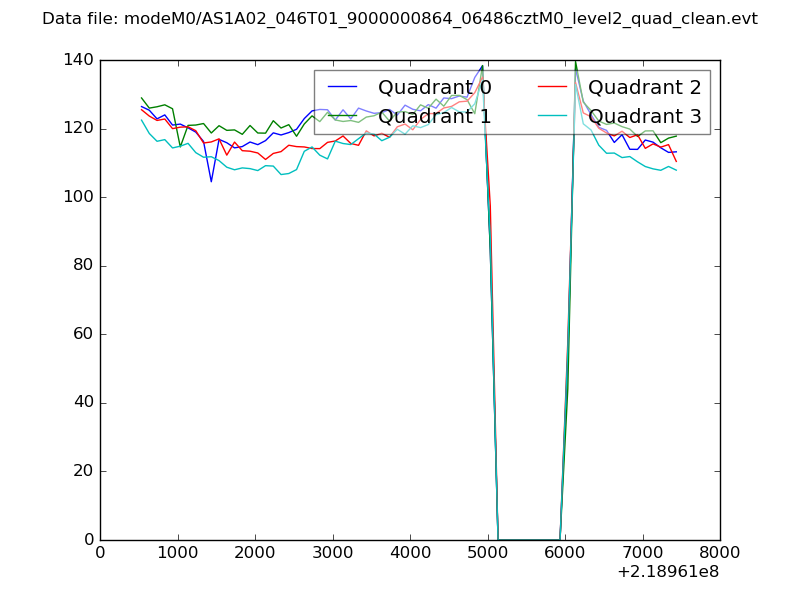
| Quadrant-wise count rates Data is divided into 100 sec bins |
 |
|
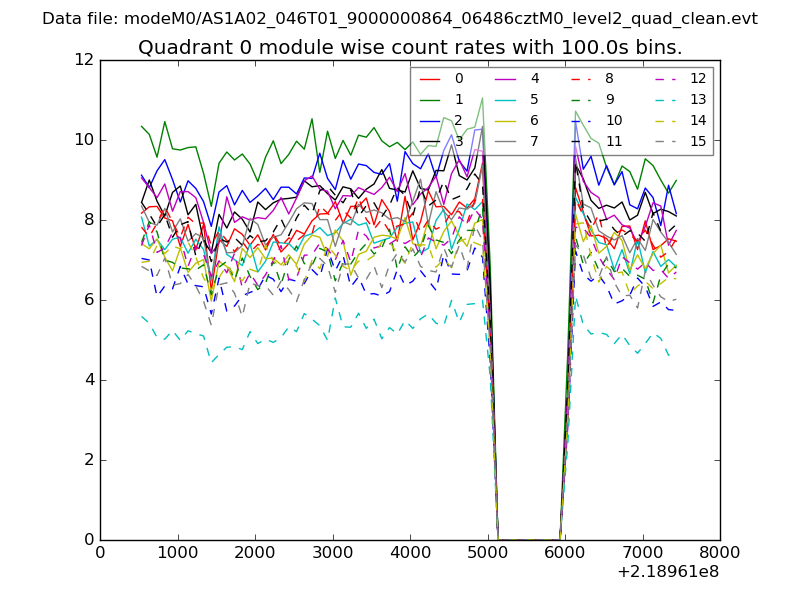
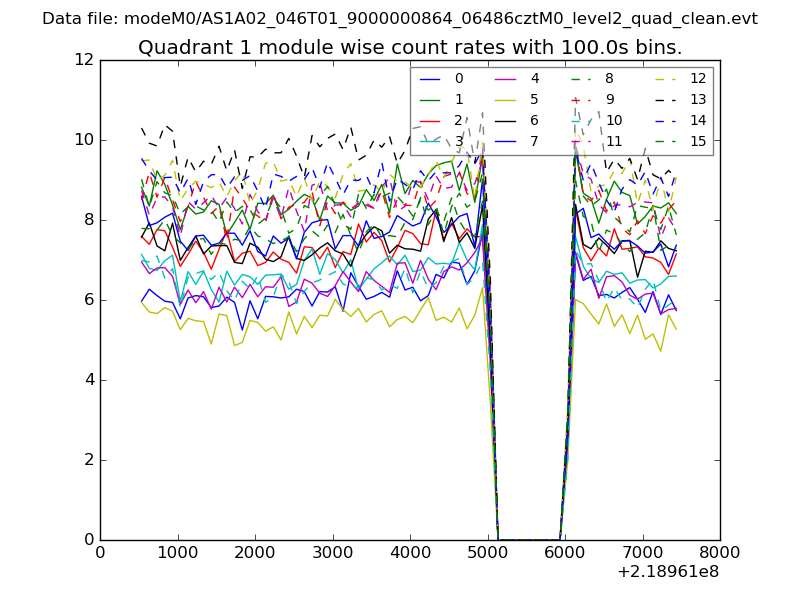
| Module-wise count rates for Quadrant A Data is divided into 100 sec bins |
 |
 |
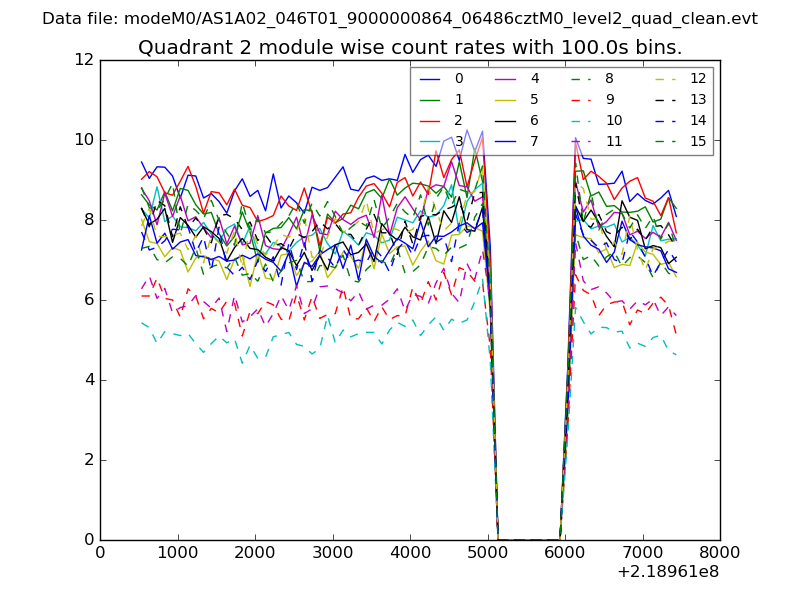
| Module-wise count rates for Quadrant B Data is divided into 100 sec bins |
 |
 |
| Module-wise count rates for Quadrant C Data is divided into 100 sec bins |
 |
 |
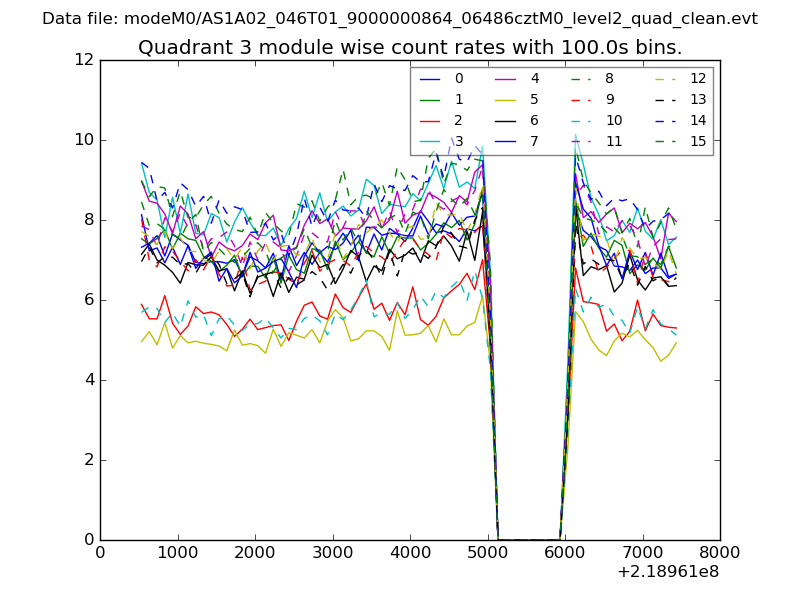
| Module-wise count rates for Quadrant D Data is divided into 100 sec bins |
 |
 |
| Parameter | Plot |
|---|---|
| CZT HV Monitor | 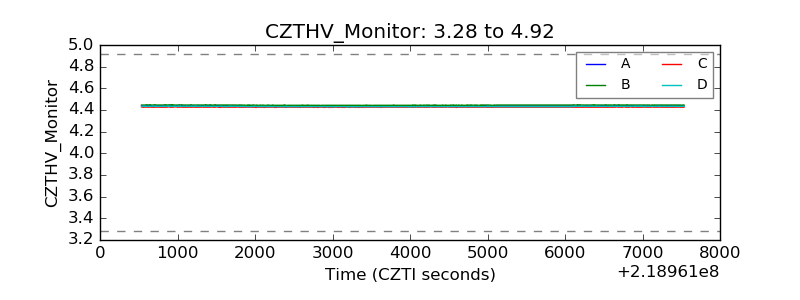 |
| D_VDD | 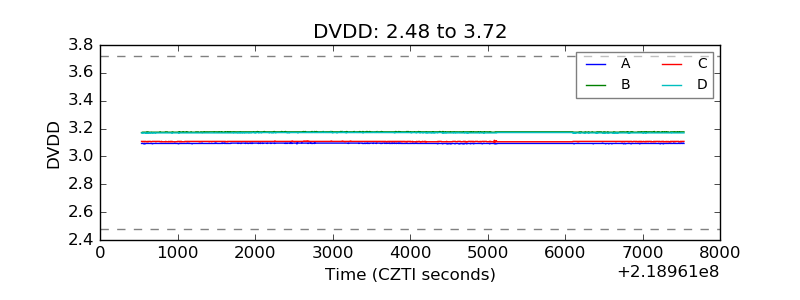 |
| Temperature 1 | 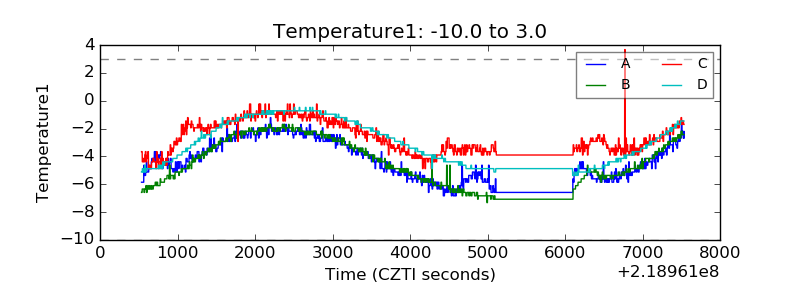 |
| Veto HV Monitor | 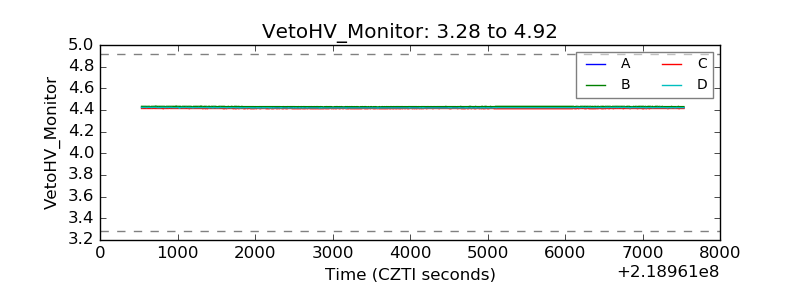 |
| Veto LLD | 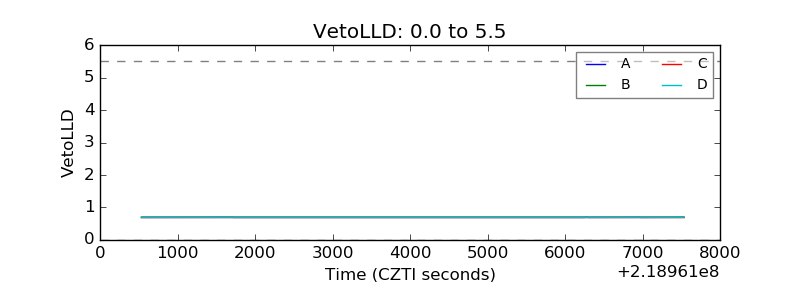 |
| Alpha Counter | 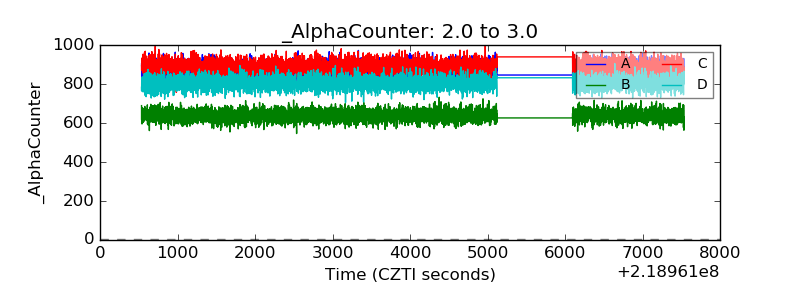 |
| _CPM_Rate | 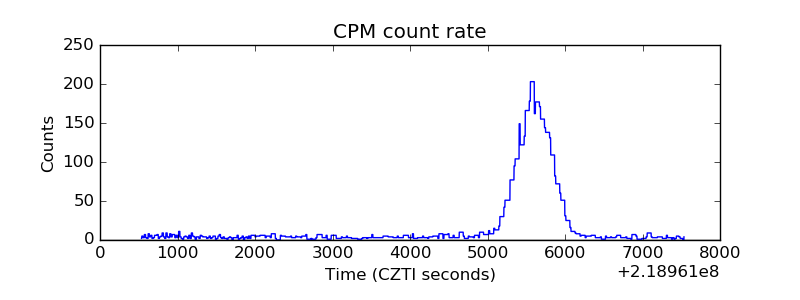 |
| CZT Counter | 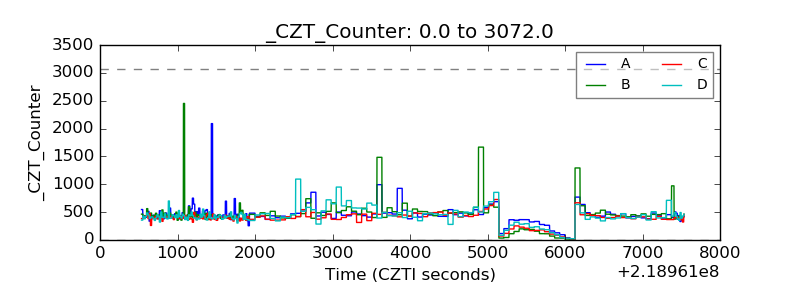 |
| +2.5 Volts monitor |  |
| +5 Volts monitor |  |
| _ROLL_ROT | 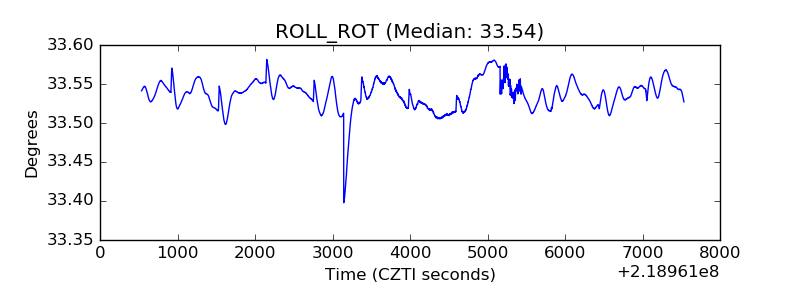 |
| _Roll_DEC | 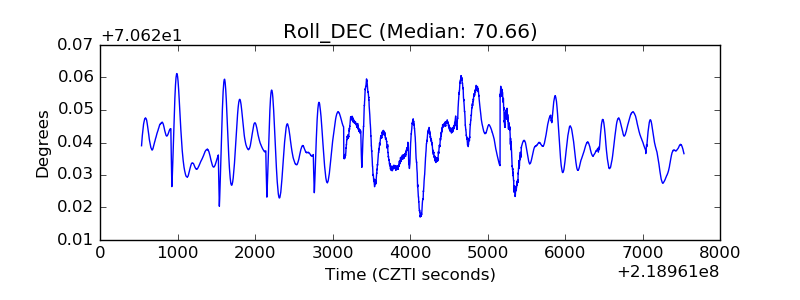 |
| _Roll_RA | 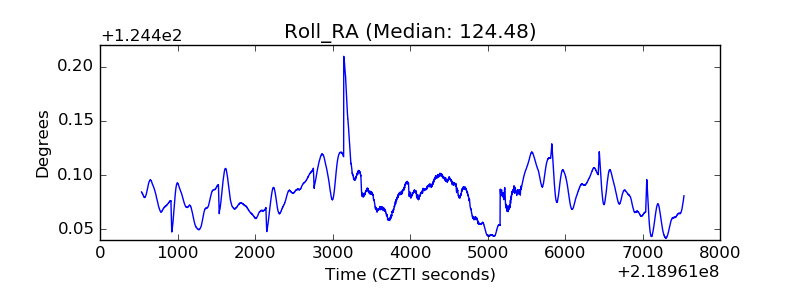 |
| Veto Counter | 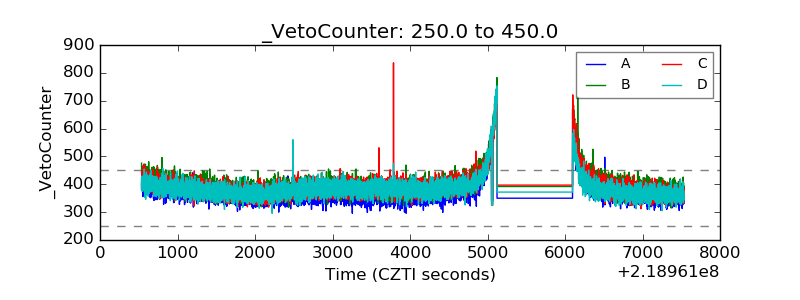 |