| Param | Original file | Final file |
|---|---|---|
| Filename | modeM0/AS1G06_065T01_9000000868cztM0_level2.fits | modeM0/AS1G06_065T01_9000000868cztM0_level2_quad_clean.evt |
| Size (bytes) | 117,800,640 | 159,318,720 |
| Size | 112.3 MB | 151.9 MB |
| Events in quadrant A | 699,716 | 1,047,614 |
| Events in quadrant B | 679,010 | 1,000,001 |
| Events in quadrant C | 692,632 | 952,975 |
| Events in quadrant D | 590,360 | 918,290 |
| Mode M0 | |||
|---|---|---|---|
| Quadrant | BADHDUFLAG | Total packets | Discarded packets |
| A | 0 | 28481 | 0 |
| B | 0 | 28120 | 0 |
| C | 0 | 26715 | 0 |
| D | 0 | 31384 | 0 |
| Mode SS | |||
|---|---|---|---|
| Quadrant | BADHDUFLAG | Total packets | Discarded packets |
| A | 0 | 268 | 0 |
| B | 0 | 268 | 0 |
| C | 0 | 268 | 0 |
| D | 0 | 268 | 0 |
| Mode M9 | |||
|---|---|---|---|
| Quadrant | BADHDUFLAG | Total packets | Discarded packets |
| A | 0 | 27 | 0 |
| B | 0 | 27 | 0 |
| C | 0 | 27 | 0 |
| D | 0 | 27 | 0 |
| Quadrant | Total seconds | Saturated seconds | Saturation percentage |
|---|---|---|---|
| A | 13114 | 88 | 0.671039% |
| B | 13114 | 92 | 0.701540% |
| C | 13114 | 36 | 0.274516% |
| D | 13114 | 161 | 1.227696% |
Noise dominated data is calculated using 1-second bins in cleaned event files. If a bin has >2000 counts, and if more than 50% of those come from <1% of pixels, then it is considered to be noise-dominated and hence unusable.
| Quadrant | # 1 sec bins | Bins with >0 counts | Bins with >2000 counts | High rate bins dominated by noise | Noise dominated (total time) | Noise dominated (detector-on time) | Marked lightcurve |
|---|---|---|---|---|---|---|---|
| A | 15819 | 13114 | 0 | 0 | 0.00% | 0.00% | 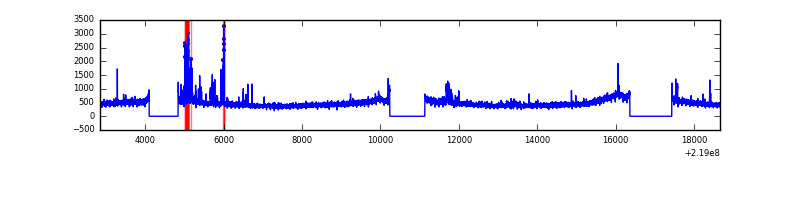 |
| B | 15819 | 13110 | 0 | 0 | 0.00% | 0.00% | 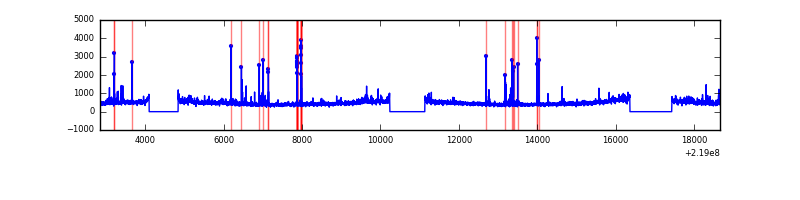 |
| C | 15819 | 13114 | 0 | 0 | 0.00% | 0.00% |  |
| D | 15819 | 13112 | 0 | 0 | 0.00% | 0.00% |  |
Top three noisy pixels from each quadrant. If the there are fewer than three noisy pixels in the level2.evt file, extra rows are filled as -1
| Pixel properties | Quadrant properties | ||||||
|---|---|---|---|---|---|---|---|
| Quadrant | DetID | PixID | Counts | Sigma | Mean | Median | Sigma |
| A | 0 | 29 | 704 | 11.03 | 181 | 170 | 48.4 |
| A | 14 | 188 | 671 | 10.34 | 181 | 170 | 48.4 |
| A | 7 | 110 | 633 | 9.56 | 181 | 170 | 48.4 |
| B | 2 | 9 | 604 | 11.26 | 179 | 170 | 38.5 |
| B | 2 | 8 | 491 | 8.33 | 179 | 170 | 38.5 |
| B | 14 | 254 | 482 | 8.1 | 179 | 170 | 38.5 |
| C | 1 | 80 | 522 | 7.1 | 182 | 169 | 49.7 |
| C | 1 | 81 | 519 | 7.04 | 182 | 169 | 49.7 |
| C | 12 | 241 | 502 | 6.7 | 182 | 169 | 49.7 |
| D | 3 | 14 | 459 | 6.54 | 168 | 152 | 46.9 |
| D | 1 | 19 | 455 | 6.45 | 168 | 152 | 46.9 |
| D | 11 | 82 | 448 | 6.31 | 168 | 152 | 46.9 |
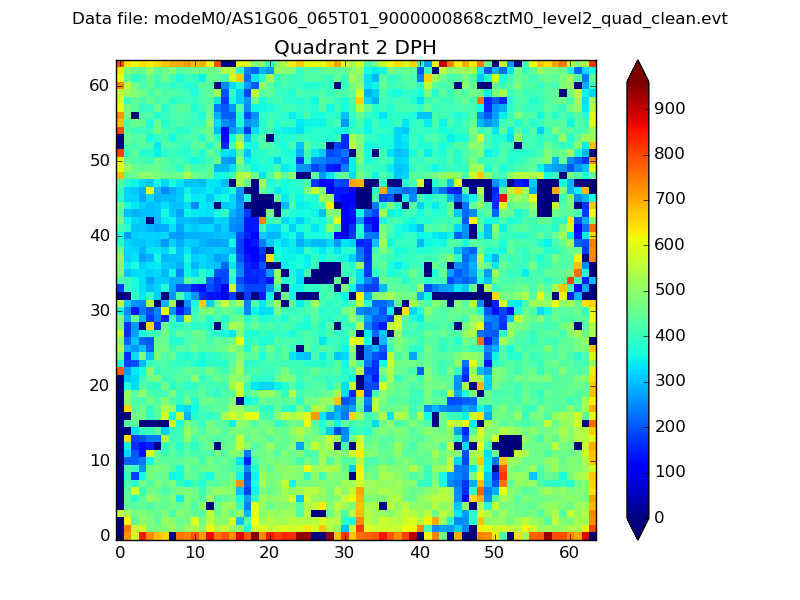
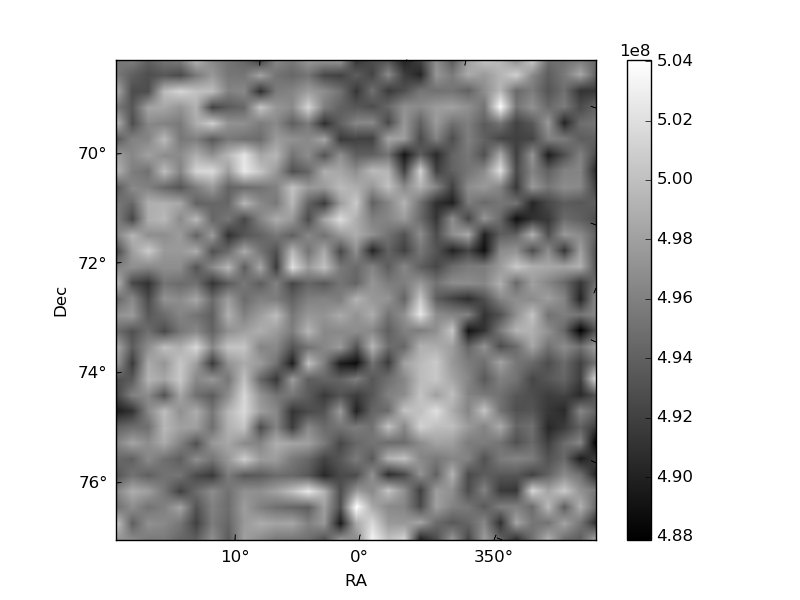
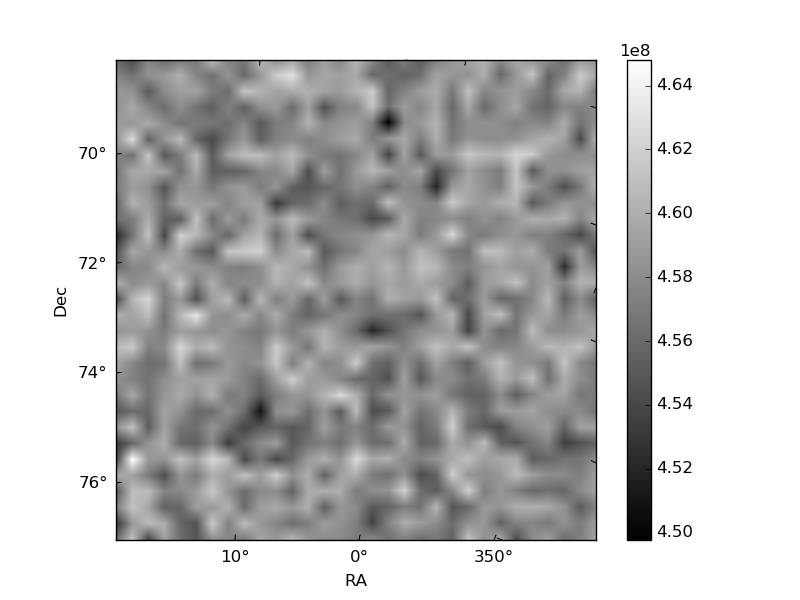
Histogram calculated using DETX and DETY for each event in the final _common_clean file
| Quadrant A | 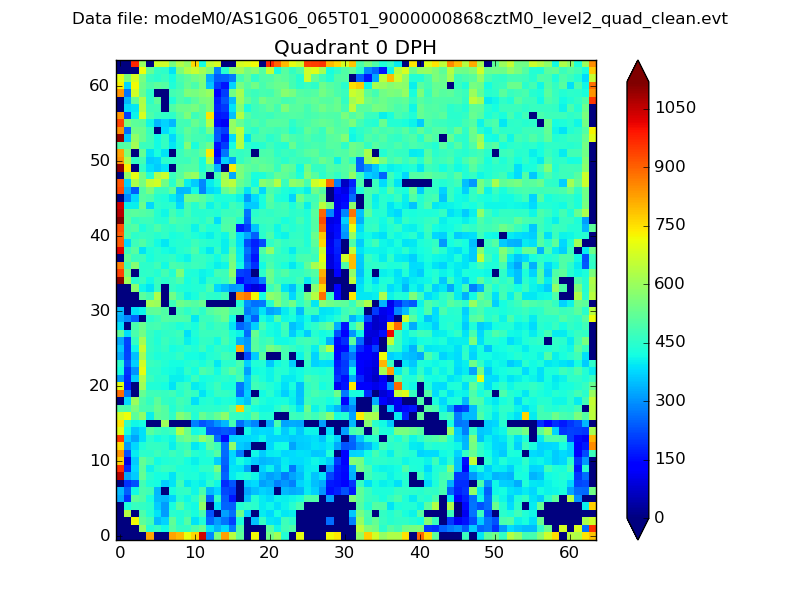 |
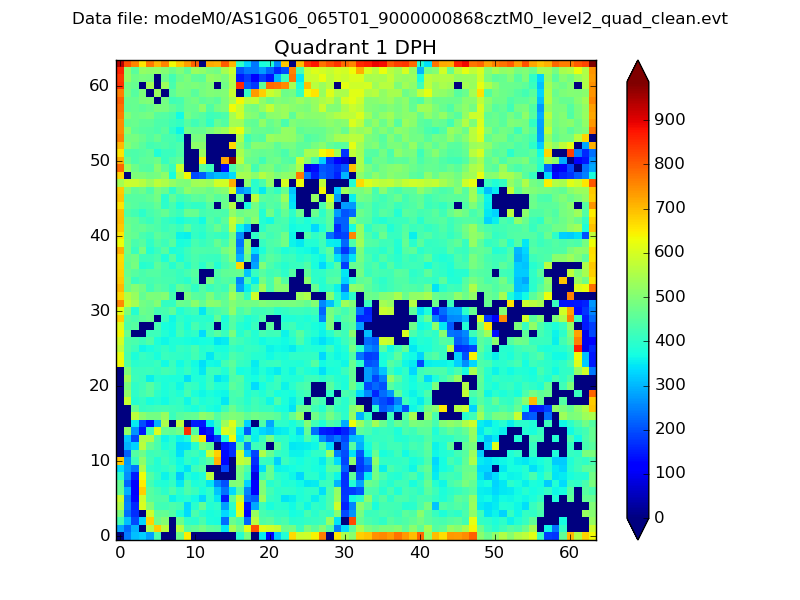 |
Quadrant B |
|---|---|---|---|
| Quadrant D | 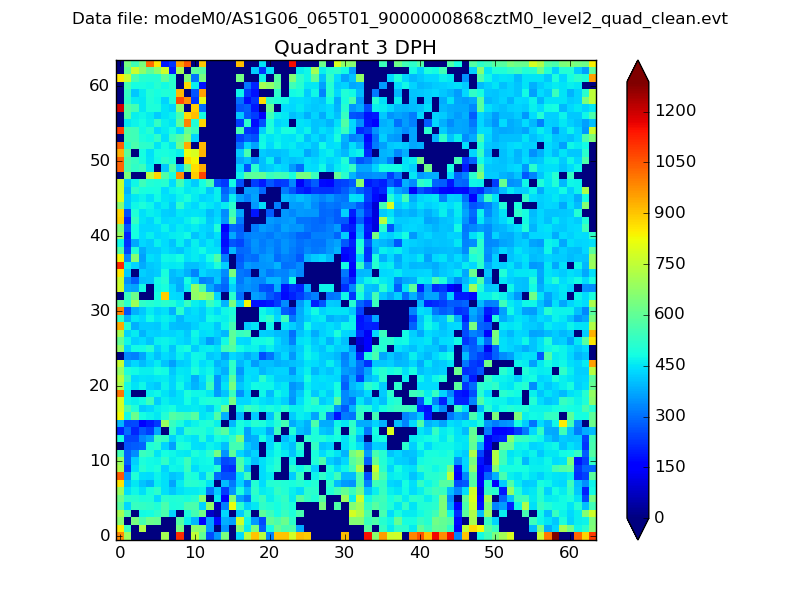 |
 |
Quadrant C |
| Plot type | Count rate plots | Images |
|---|---|---|
| Comparison with Poisson distribution Blue bars denote a histogram of data divided into 1 sec bins. Red curve is a Poisson curve with rate = median count rate of data. |
 |
 |
| Quadrant-wise count rates Data is divided into 100 sec bins |
 |
|
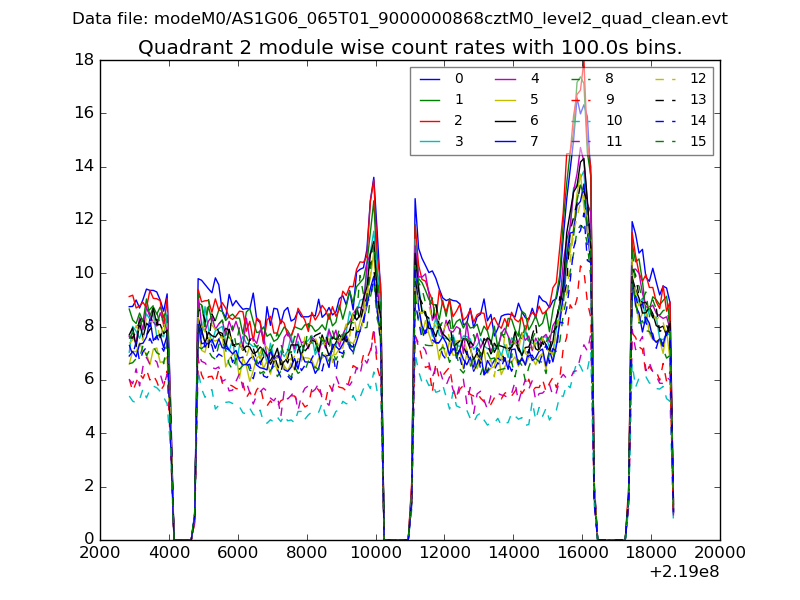
| Module-wise count rates for Quadrant A Data is divided into 100 sec bins |
 |
 |
| Module-wise count rates for Quadrant B Data is divided into 100 sec bins |
 |
 |
| Module-wise count rates for Quadrant C Data is divided into 100 sec bins |
 |
 |
| Module-wise count rates for Quadrant D Data is divided into 100 sec bins |
 |
 |
| Parameter | Plot |
|---|---|
| CZT HV Monitor | 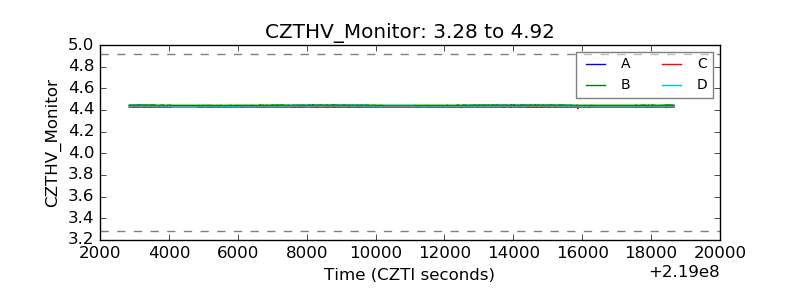 |
| D_VDD | 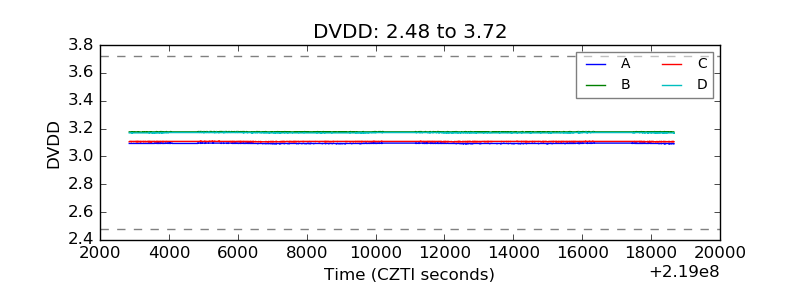 |
| Temperature 1 |  |
| Veto HV Monitor |  |
| Veto LLD | 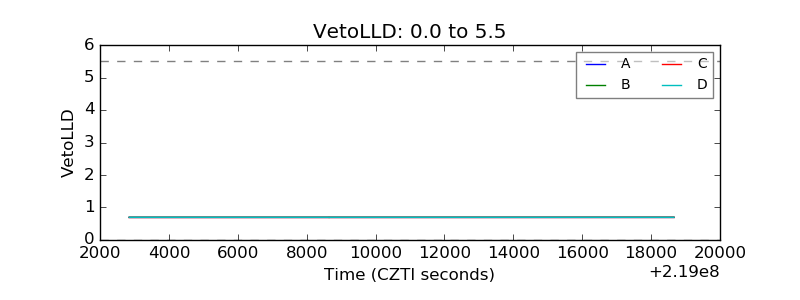 |
| Alpha Counter | 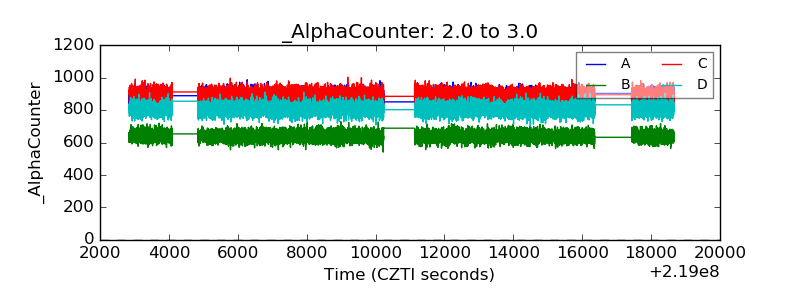 |
| _CPM_Rate | 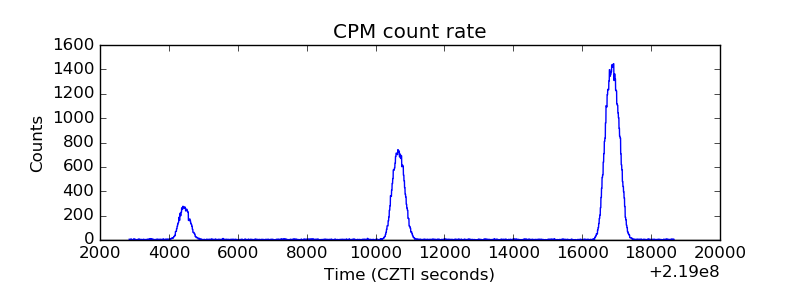 |
| CZT Counter |  |
| +2.5 Volts monitor | 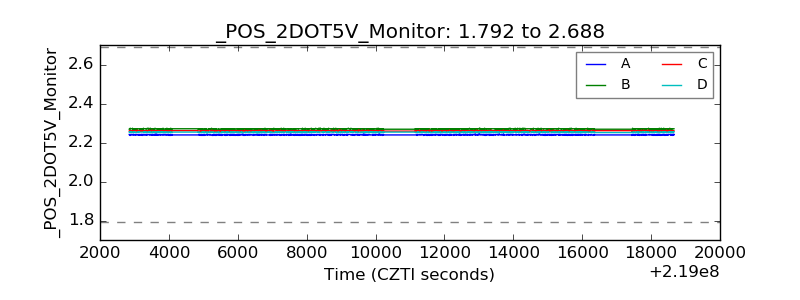 |
| +5 Volts monitor | 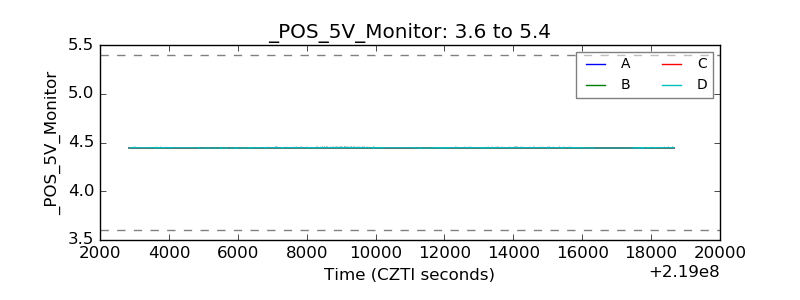 |
| _ROLL_ROT | 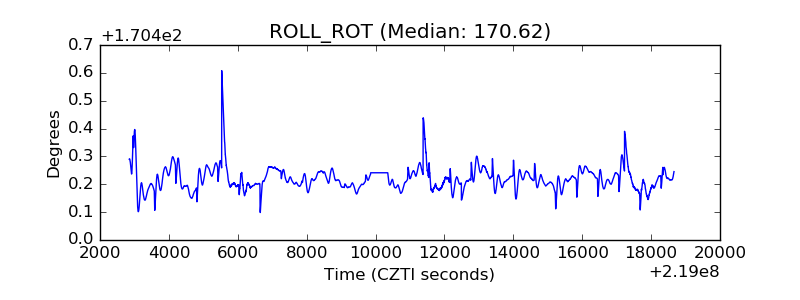 |
| _Roll_DEC |  |
| _Roll_RA |  |
| Veto Counter | 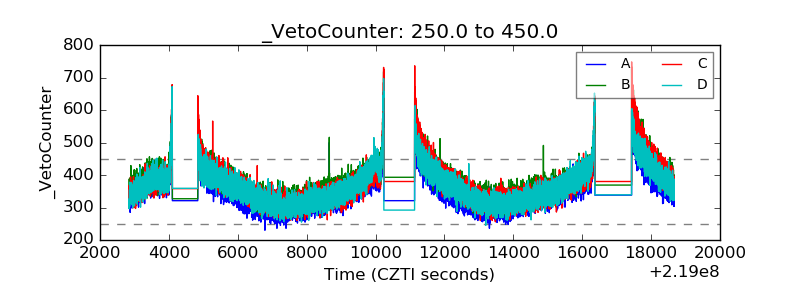 |