| Param | Original file | Final file |
|---|---|---|
| Filename | modeM0/AS1G06_065T01_9000000868_06493cztM0_level2.evt | modeM0/AS1G06_065T01_9000000868_06493cztM0_level2_quad_clean.evt |
| Size (bytes) | 549,967,680 | 146,721,600 |
| Size | 524.5 MB | 139.9 MB |
| Events in quadrant A | 3,978,921 | 991,428 |
| Events in quadrant B | 3,943,696 | 983,856 |
| Events in quadrant C | 3,564,477 | 968,346 |
| Events in quadrant D | 4,622,122 | 940,606 |
| Mode M0 | |||
|---|---|---|---|
| Quadrant | BADHDUFLAG | Total packets | Discarded packets |
| A | 0 | 17505 | 3 |
| B | 0 | 17158 | 2 |
| C | 0 | 16342 | 2 |
| D | 0 | 19284 | 2 |
| Mode SS | |||
|---|---|---|---|
| Quadrant | BADHDUFLAG | Total packets | Discarded packets |
| A | 0 | 166 | 0 |
| B | 0 | 166 | 0 |
| C | 0 | 166 | 0 |
| D | 0 | 166 | 0 |
| Mode M9 | |||
|---|---|---|---|
| Quadrant | BADHDUFLAG | Total packets | Discarded packets |
| A | 0 | 16 | 0 |
| B | 0 | 16 | 0 |
| C | 0 | 16 | 0 |
| D | 0 | 16 | 0 |
| Quadrant | Total seconds | Saturated seconds | Saturation percentage |
|---|---|---|---|
| A | 8051 | 79 | 0.981245% |
| B | 8051 | 74 | 0.919140% |
| C | 8051 | 31 | 0.385045% |
| D | 8051 | 138 | 1.714073% |
Noise dominated data is calculated using 1-second bins in cleaned event files. If a bin has >2000 counts, and if more than 50% of those come from <1% of pixels, then it is considered to be noise-dominated and hence unusable.
| Quadrant | # 1 sec bins | Bins with >0 counts | Bins with >2000 counts | High rate bins dominated by noise | Noise dominated (total time) | Noise dominated (detector-on time) | Marked lightcurve |
|---|---|---|---|---|---|---|---|
| A | 9686 | 8053 | 29 | 29 | 0.30% | 0.36% | 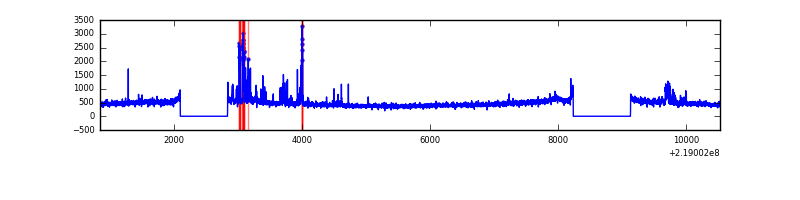 |
| B | 9686 | 8053 | 23 | 23 | 0.24% | 0.29% | 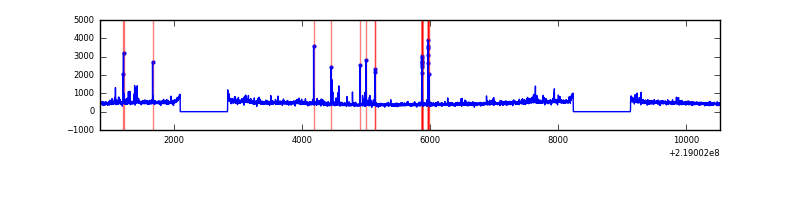 |
| C | 9686 | 8053 | 1 | 1 | 0.01% | 0.01% | 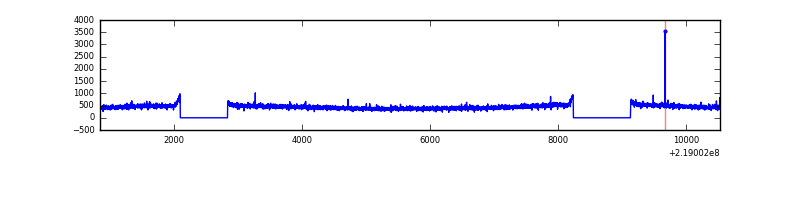 |
| D | 9686 | 8053 | 68 | 68 | 0.70% | 0.84% | 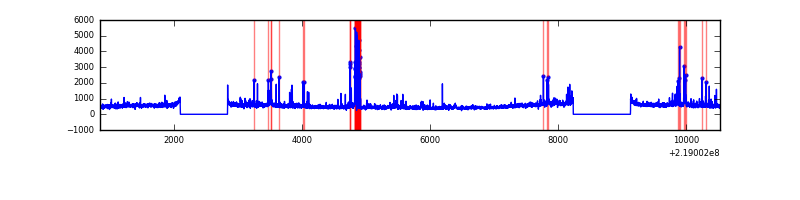 |
Top three noisy pixels from each quadrant. If the there are fewer than three noisy pixels in the level2.evt file, extra rows are filled as -1
| Pixel properties | Quadrant properties | ||||||
|---|---|---|---|---|---|---|---|
| Quadrant | DetID | PixID | Counts | Sigma | Mean | Median | Sigma |
| A | 15 | 234 | 279210 | 1456.34 | 940 | 917 | 191.1 |
| A | 15 | 236 | 41691 | 213.38 | 940 | 917 | 191.1 |
| A | 8 | 15 | 20339 | 101.64 | 940 | 917 | 191.1 |
| B | 0 | 219 | 118364 | 651.96 | 942 | 919 | 180.1 |
| B | 10 | 245 | 35835 | 193.83 | 942 | 919 | 180.1 |
| B | 4 | 81 | 32054 | 172.84 | 942 | 919 | 180.1 |
| C | 1 | 16 | 8916 | 38.06 | 908 | 910 | 210.4 |
| C | 12 | 4 | 8088 | 34.12 | 908 | 910 | 210.4 |
| C | 13 | 61 | 7218 | 29.99 | 908 | 910 | 210.4 |
| D | 8 | 195 | 535899 | 2402.1 | 910 | 880 | 222.7 |
| D | 5 | 97 | 235376 | 1052.83 | 910 | 880 | 222.7 |
| D | 2 | 152 | 167501 | 748.09 | 910 | 880 | 222.7 |
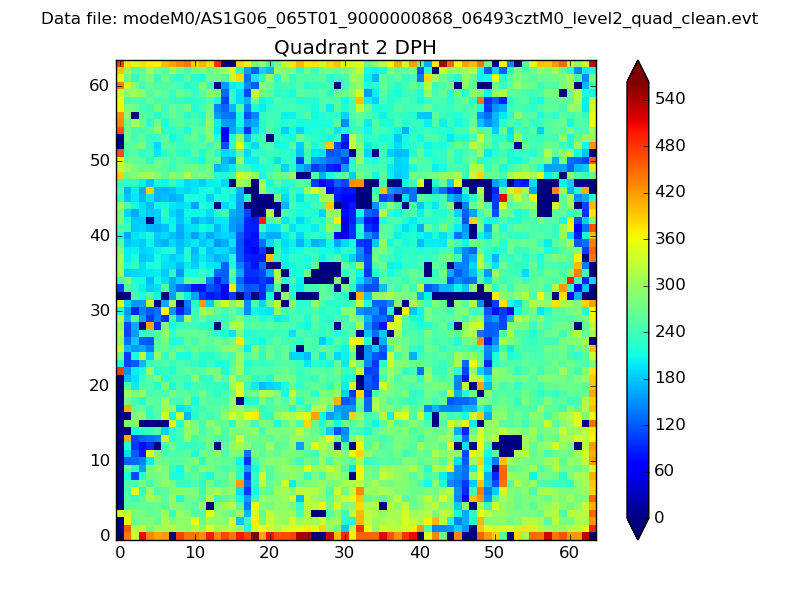
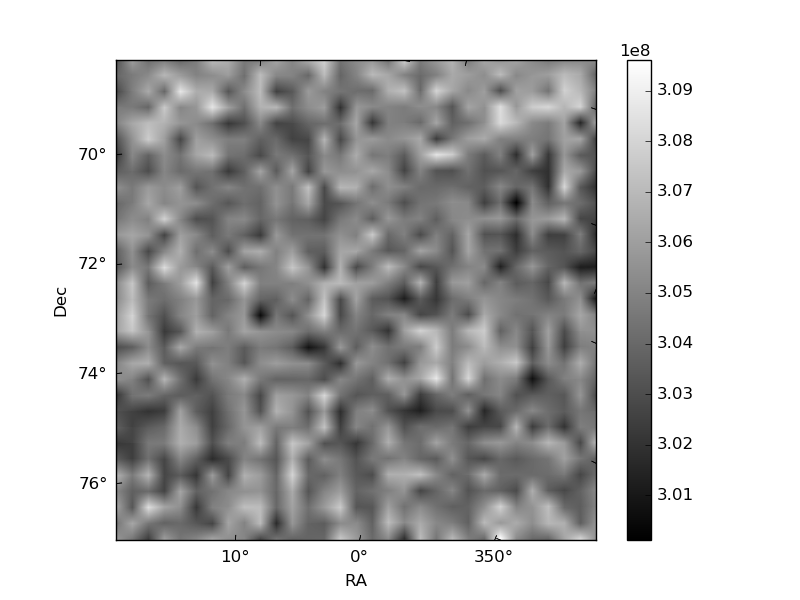
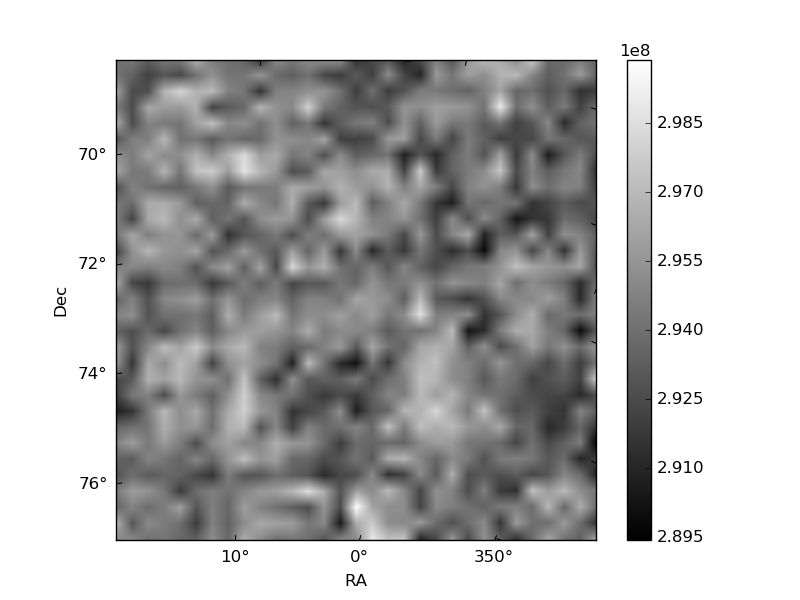
Histogram calculated using DETX and DETY for each event in the final _common_clean file
| Quadrant A | 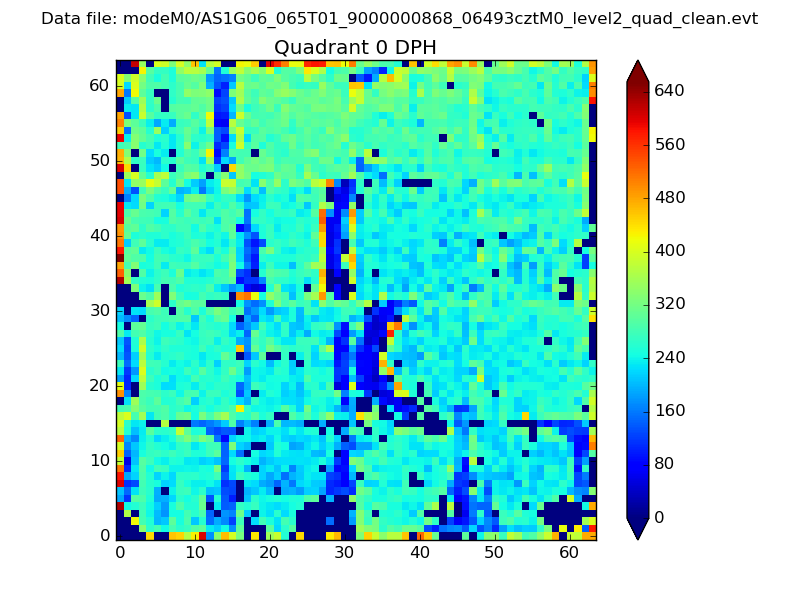 |
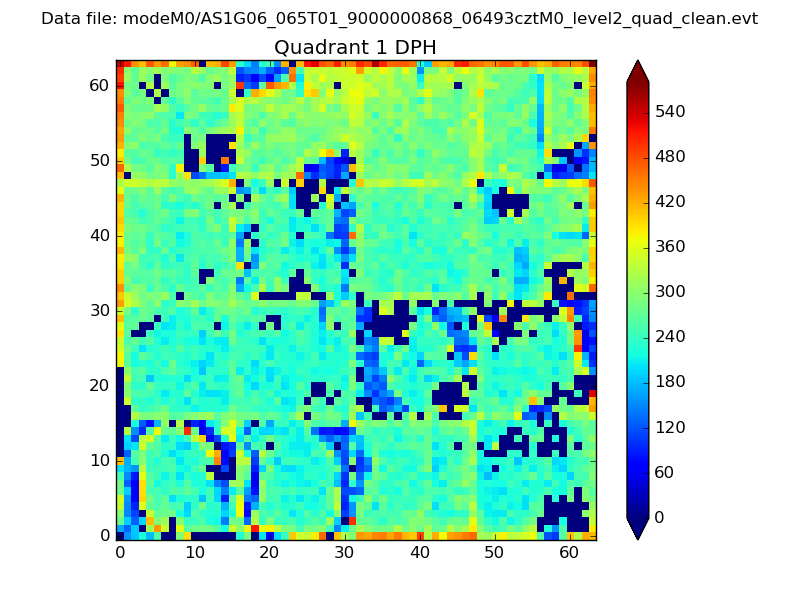 |
Quadrant B |
|---|---|---|---|
| Quadrant D | 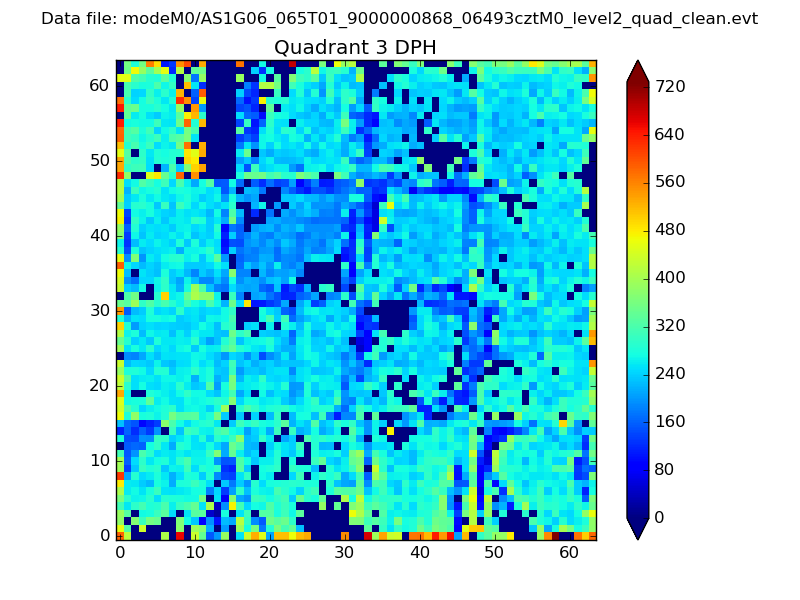 |
 |
Quadrant C |
| Plot type | Count rate plots | Images |
|---|---|---|
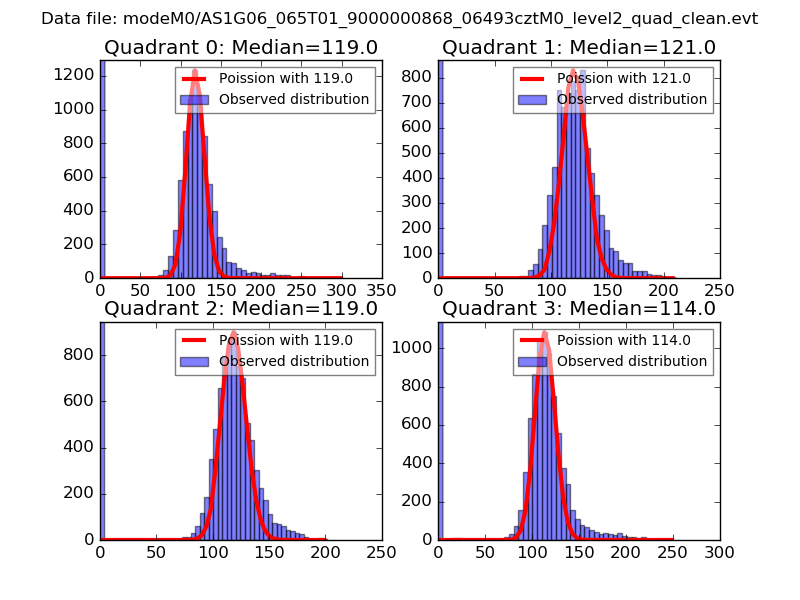
| Comparison with Poisson distribution Blue bars denote a histogram of data divided into 1 sec bins. Red curve is a Poisson curve with rate = median count rate of data. |
 |
 |
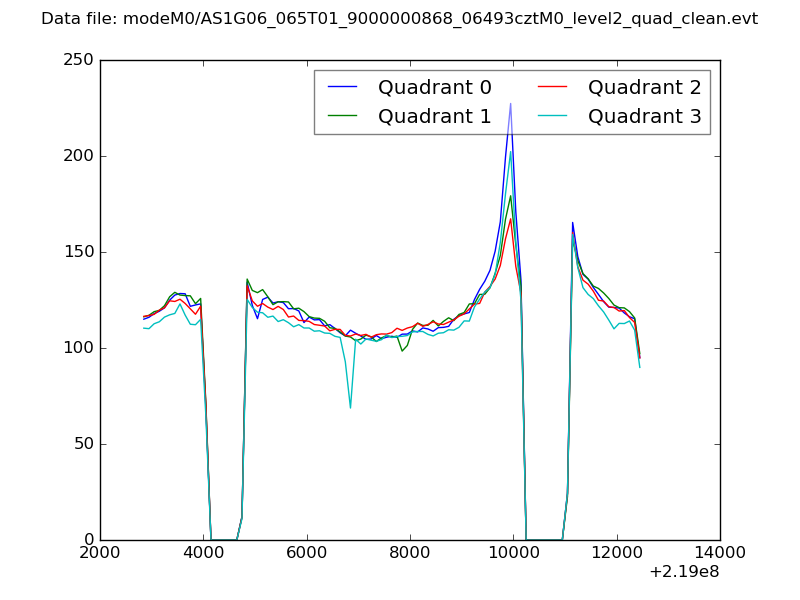
| Quadrant-wise count rates Data is divided into 100 sec bins |
 |
|
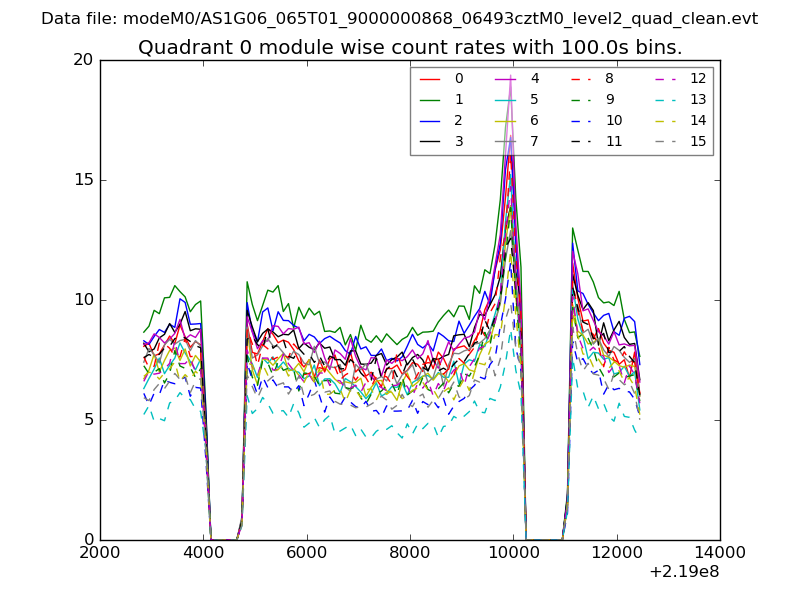
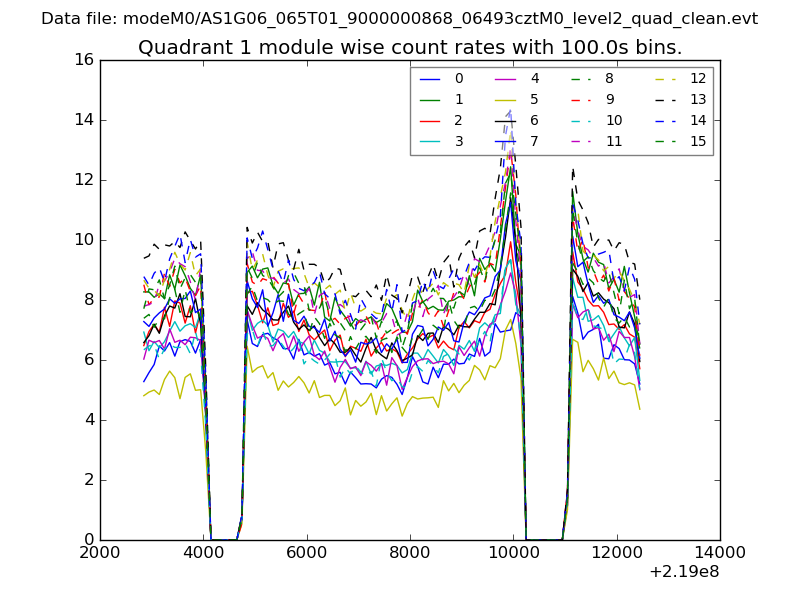
| Module-wise count rates for Quadrant A Data is divided into 100 sec bins |
 |
 |
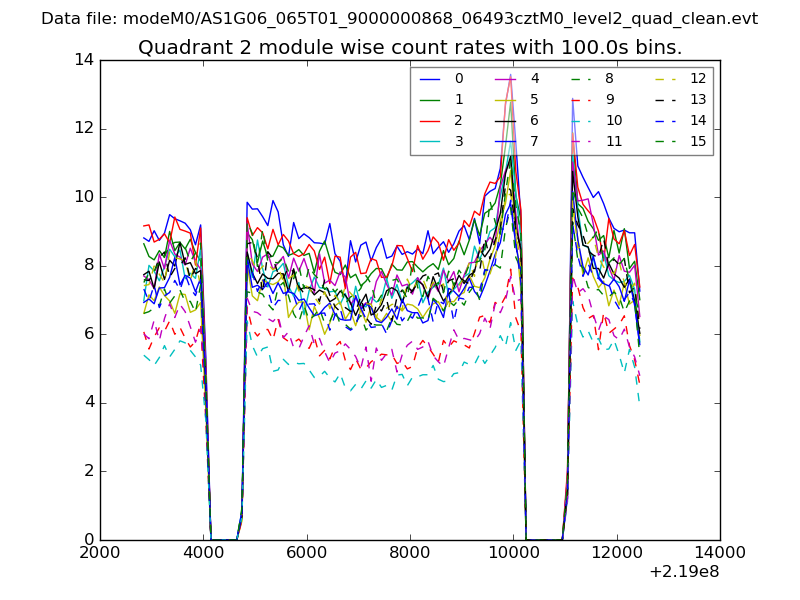
| Module-wise count rates for Quadrant B Data is divided into 100 sec bins |
 |
 |
| Module-wise count rates for Quadrant C Data is divided into 100 sec bins |
 |
 |
| Module-wise count rates for Quadrant D Data is divided into 100 sec bins |
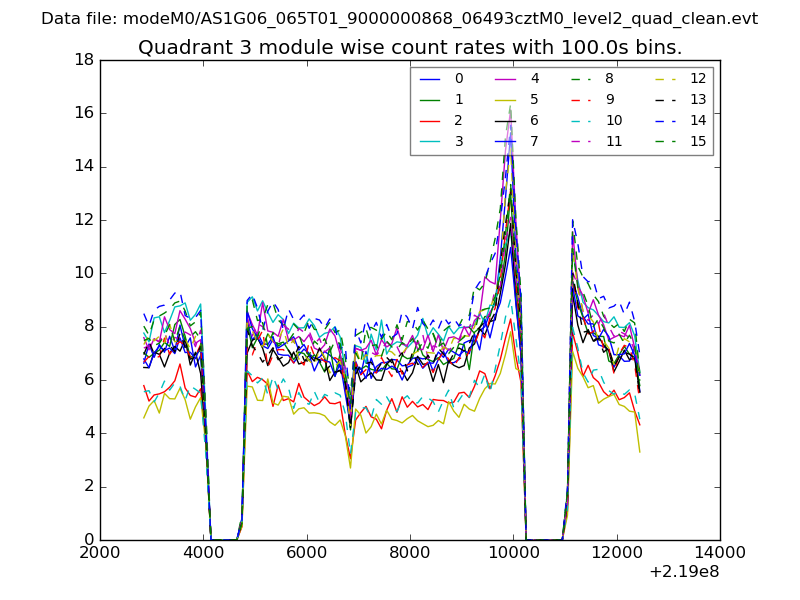 |
 |
| Parameter | Plot |
|---|---|
| CZT HV Monitor | 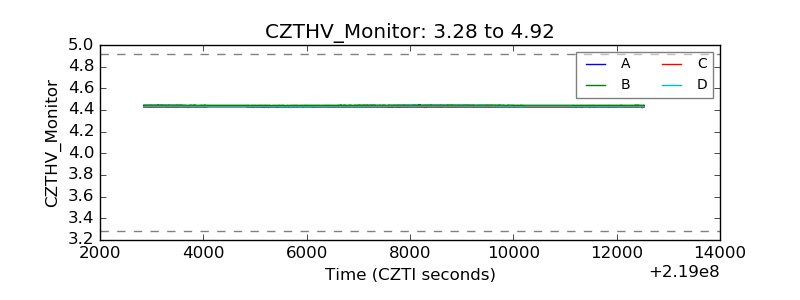 |
| D_VDD | 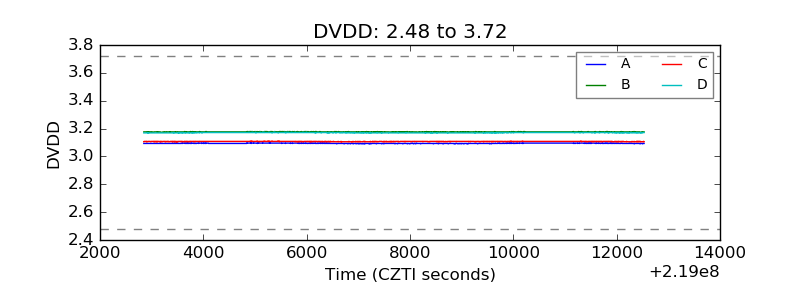 |
| Temperature 1 | 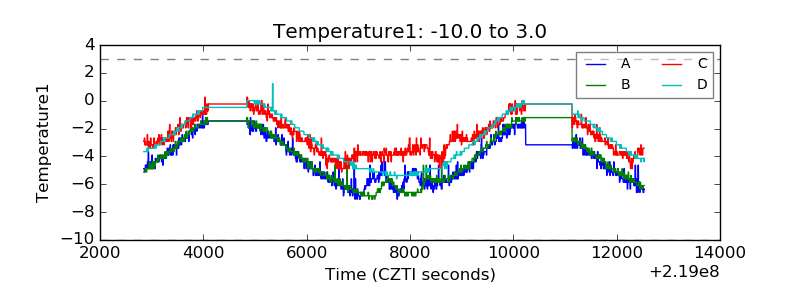 |
| Veto HV Monitor | 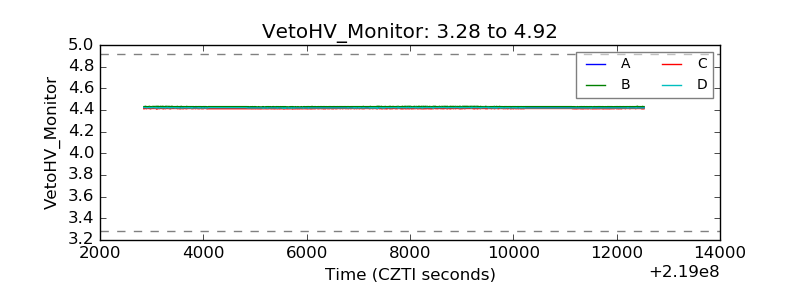 |
| Veto LLD | 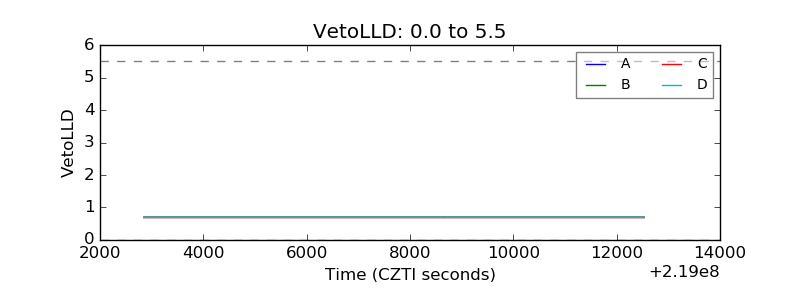 |
| Alpha Counter | 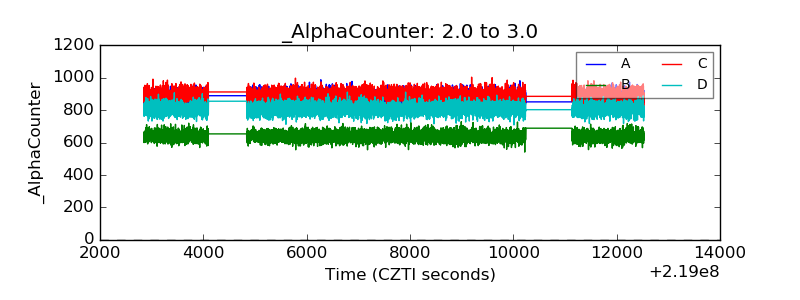 |
| _CPM_Rate | 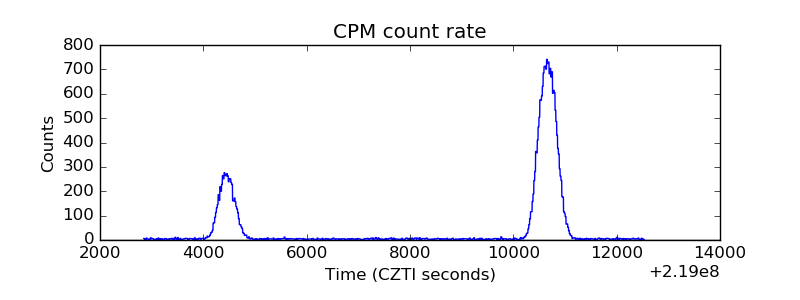 |
| CZT Counter | 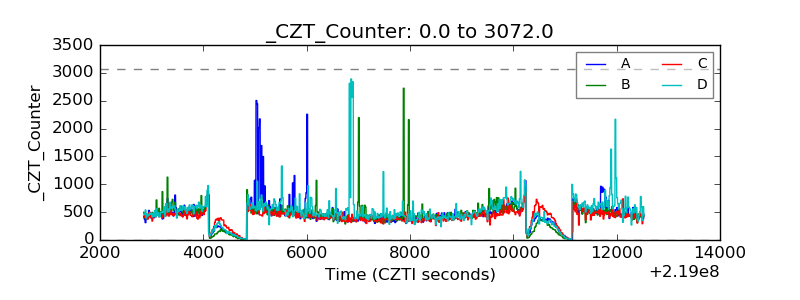 |
| +2.5 Volts monitor | 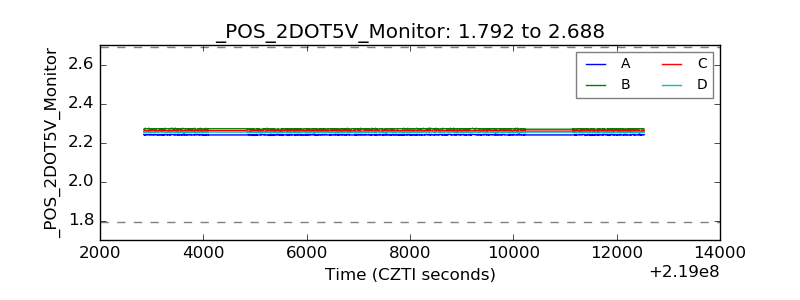 |
| +5 Volts monitor | 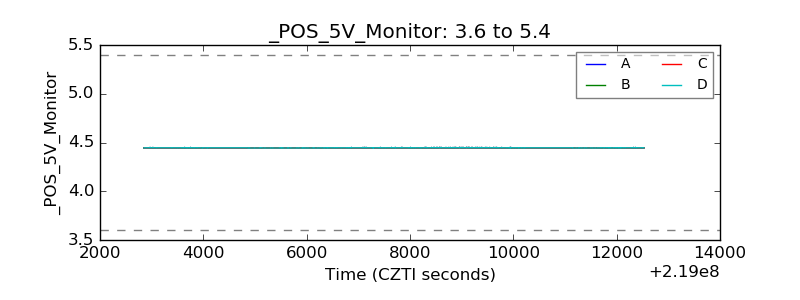 |
| _ROLL_ROT | 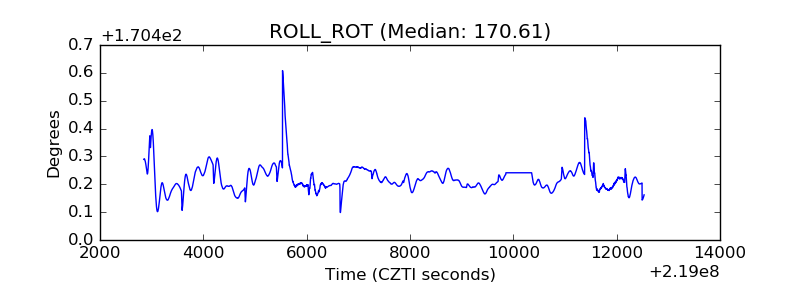 |
| _Roll_DEC | 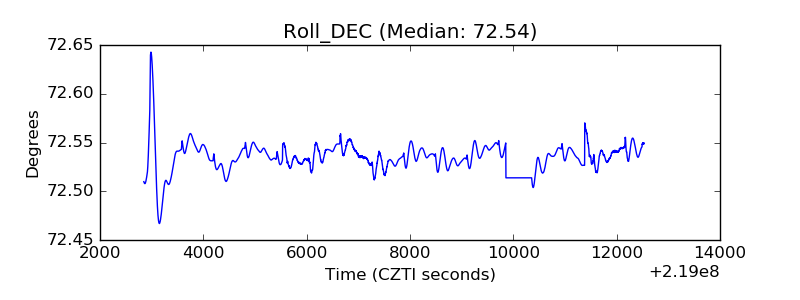 |
| _Roll_RA | 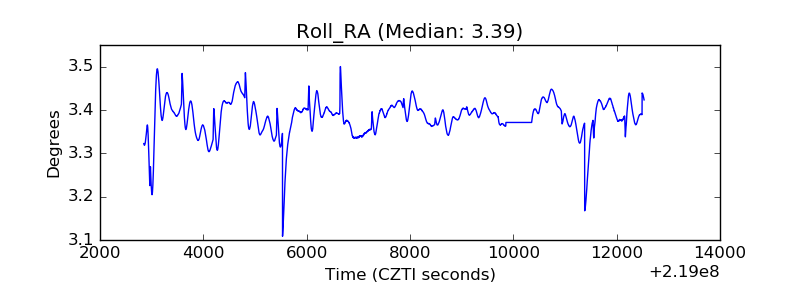 |
| Veto Counter | 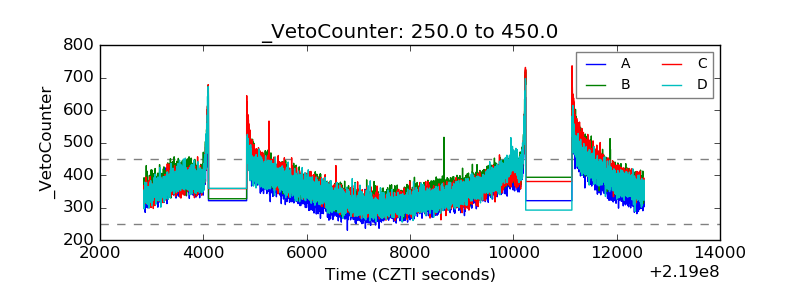 |