| Param | Original file | Final file |
|---|---|---|
| Filename | modeM0/AS1G06_065T01_9000000868_06496cztM0_level2.evt | modeM0/AS1G06_065T01_9000000868_06496cztM0_level2_quad_clean.evt |
| Size (bytes) | 443,672,640 | 127,483,200 |
| Size | 423.1 MB | 121.6 MB |
| Events in quadrant A | 3,155,597 | 880,496 |
| Events in quadrant B | 3,135,144 | 854,442 |
| Events in quadrant C | 2,893,843 | 834,839 |
| Events in quadrant D | 3,813,231 | 841,053 |
| Mode M0 | |||
|---|---|---|---|
| Quadrant | BADHDUFLAG | Total packets | Discarded packets |
| A | 0 | 14075 | 2 |
| B | 0 | 13883 | 2 |
| C | 0 | 13254 | 2 |
| D | 0 | 15762 | 2 |
| Mode SS | |||
|---|---|---|---|
| Quadrant | BADHDUFLAG | Total packets | Discarded packets |
| A | 0 | 130 | 0 |
| B | 0 | 130 | 0 |
| C | 0 | 130 | 0 |
| D | 0 | 130 | 0 |
| Mode M9 | |||
|---|---|---|---|
| Quadrant | BADHDUFLAG | Total packets | Discarded packets |
| A | 0 | 17 | 0 |
| B | 0 | 17 | 0 |
| C | 0 | 17 | 0 |
| D | 0 | 18 | 0 |
| Quadrant | Total seconds | Saturated seconds | Saturation percentage |
|---|---|---|---|
| A | 6461 | 14 | 0.216685% |
| B | 6461 | 21 | 0.325027% |
| C | 6461 | 9 | 0.139297% |
| D | 6461 | 38 | 0.588144% |
Noise dominated data is calculated using 1-second bins in cleaned event files. If a bin has >2000 counts, and if more than 50% of those come from <1% of pixels, then it is considered to be noise-dominated and hence unusable.
| Quadrant | # 1 sec bins | Bins with >0 counts | Bins with >2000 counts | High rate bins dominated by noise | Noise dominated (total time) | Noise dominated (detector-on time) | Marked lightcurve |
|---|---|---|---|---|---|---|---|
| A | 7531 | 6462 | 0 | 0 | 0.00% | 0.00% | 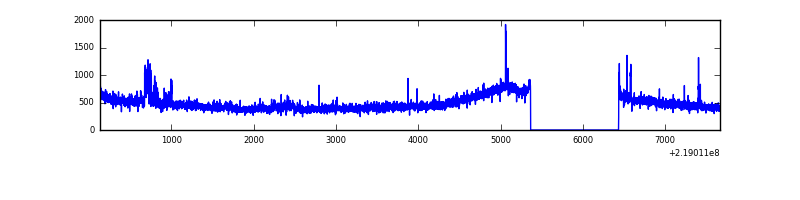 |
| B | 7531 | 6462 | 9 | 9 | 0.12% | 0.14% | 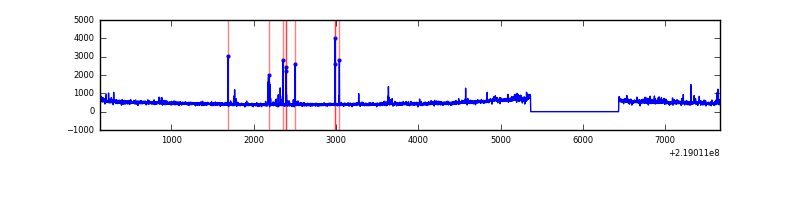 |
| C | 7531 | 6462 | 1 | 1 | 0.01% | 0.02% | 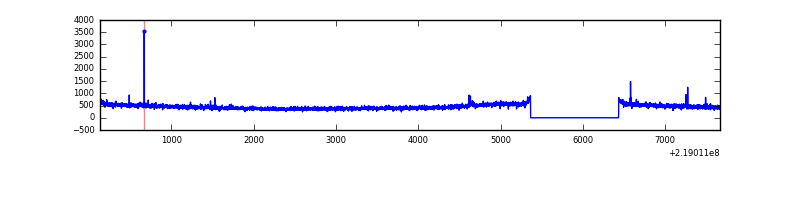 |
| D | 7531 | 6462 | 15 | 15 | 0.20% | 0.23% | 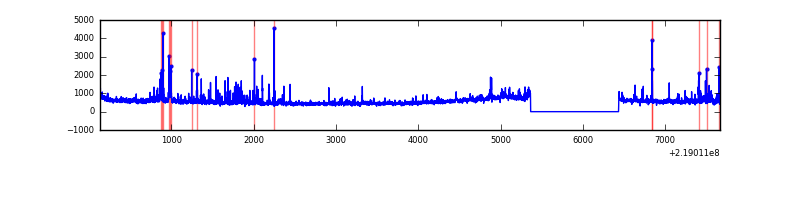 |
Top three noisy pixels from each quadrant. If the there are fewer than three noisy pixels in the level2.evt file, extra rows are filled as -1
| Pixel properties | Quadrant properties | ||||||
|---|---|---|---|---|---|---|---|
| Quadrant | DetID | PixID | Counts | Sigma | Mean | Median | Sigma |
| A | 15 | 234 | 112090 | 696.07 | 775 | 761 | 159.9 |
| A | 15 | 236 | 27498 | 167.17 | 775 | 761 | 159.9 |
| A | 13 | 14 | 15719 | 93.52 | 775 | 761 | 159.9 |
| B | 4 | 81 | 50958 | 345.26 | 760 | 743 | 145.4 |
| B | 0 | 219 | 42499 | 287.1 | 760 | 743 | 145.4 |
| B | 4 | 172 | 28506 | 190.89 | 760 | 743 | 145.4 |
| C | 1 | 16 | 10358 | 56.36 | 733 | 739 | 170.7 |
| C | 12 | 4 | 8144 | 43.38 | 733 | 739 | 170.7 |
| C | 9 | 54 | 6758 | 35.26 | 733 | 739 | 170.7 |
| D | 8 | 195 | 461887 | 2470.99 | 747 | 726 | 186.6 |
| D | 2 | 152 | 294134 | 1572.14 | 747 | 726 | 186.6 |
| D | 2 | 136 | 79581 | 422.52 | 747 | 726 | 186.6 |
Histogram calculated using DETX and DETY for each event in the final _common_clean file
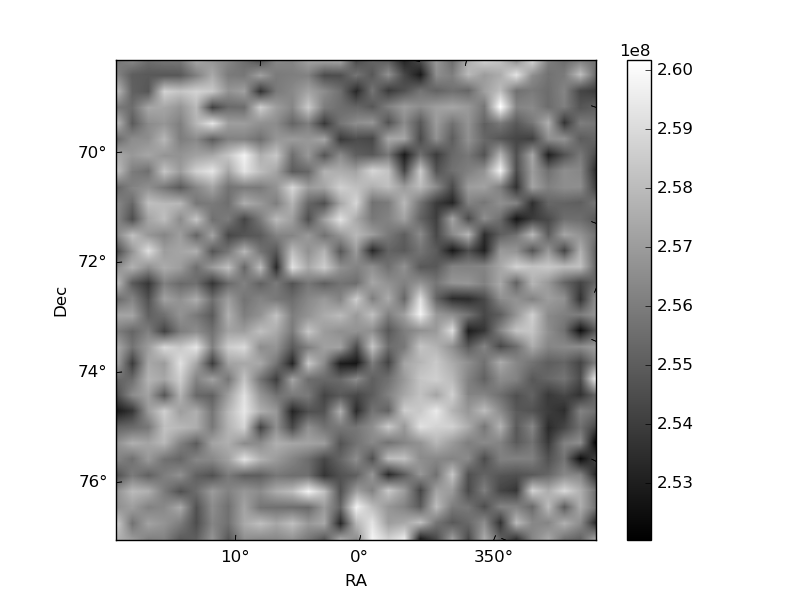
| Quadrant A | 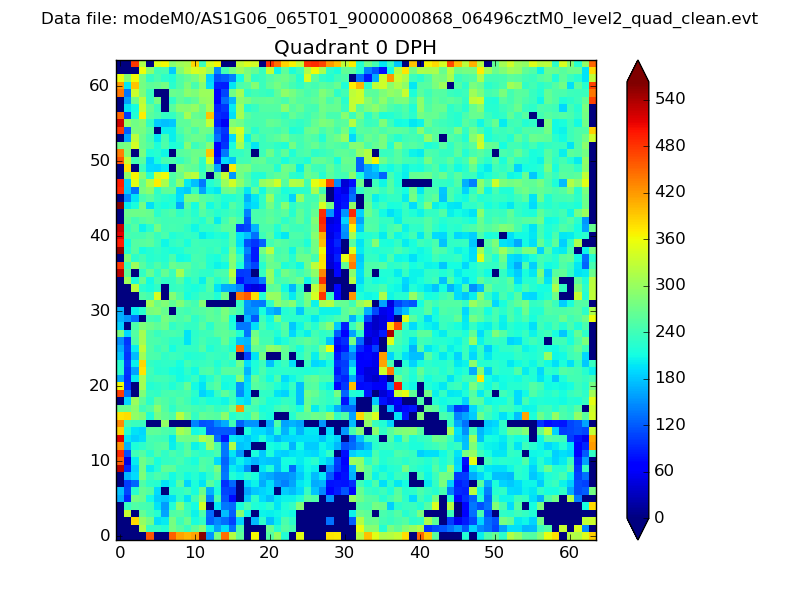 |
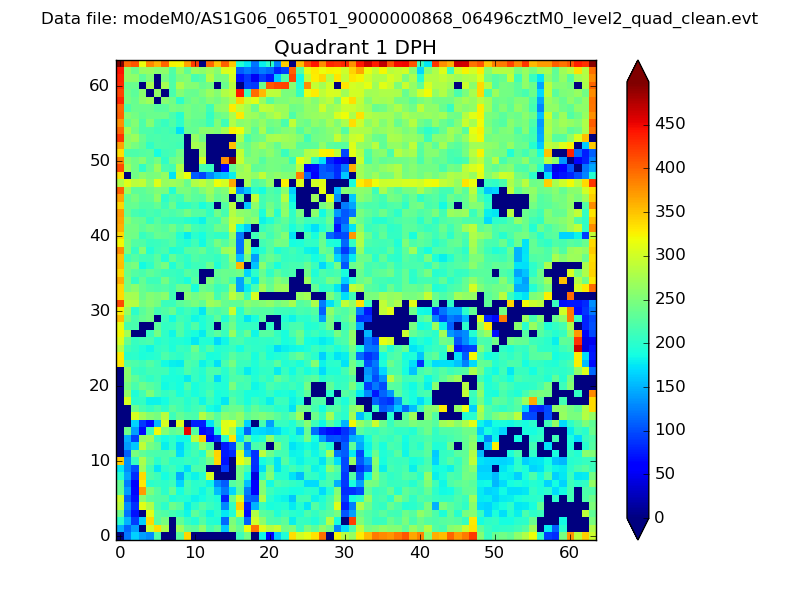 |
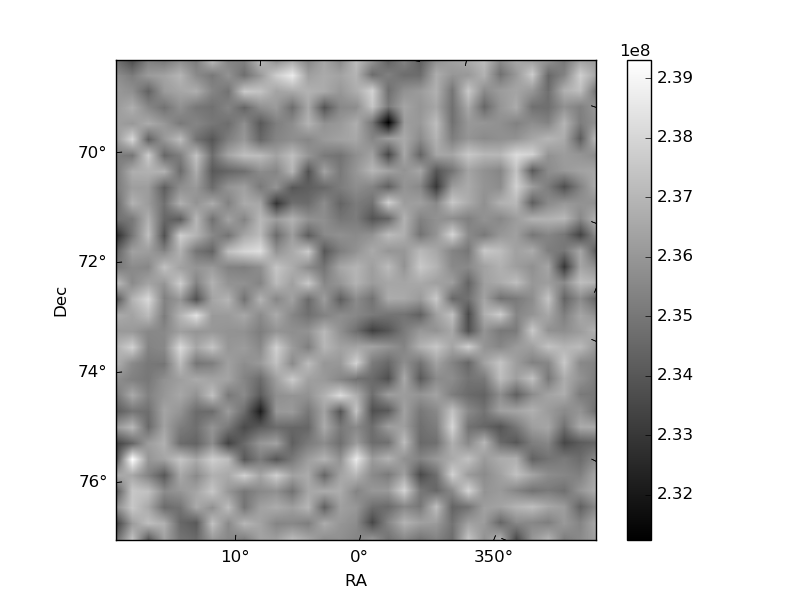
Quadrant B |
|---|---|---|---|
| Quadrant D | 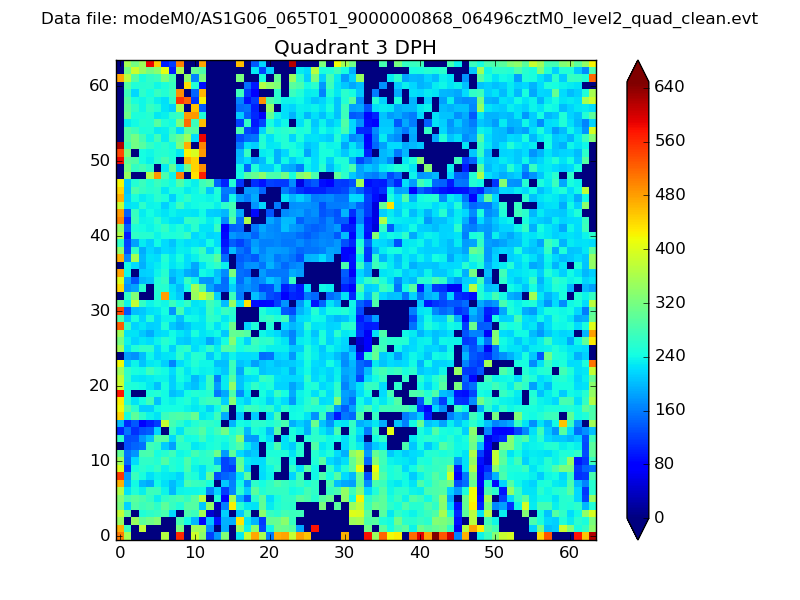 |
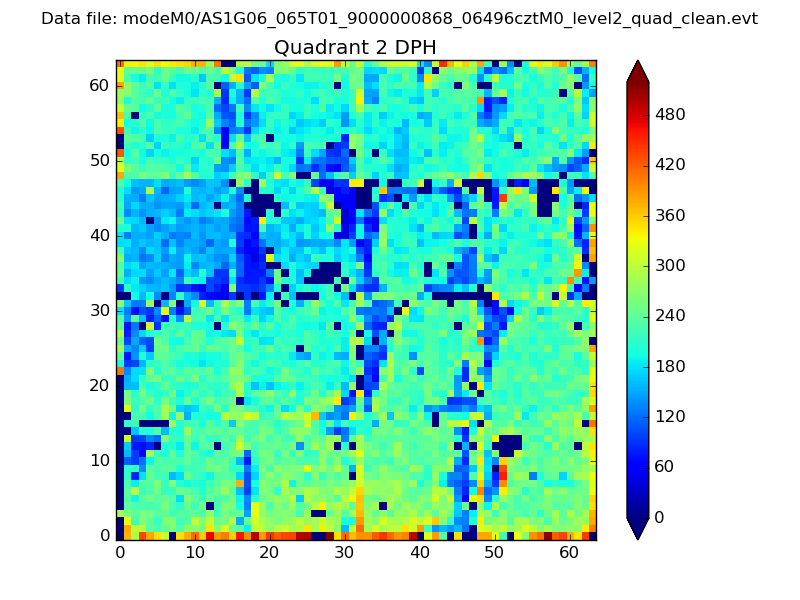 |
Quadrant C |
| Plot type | Count rate plots | Images |
|---|---|---|
| Comparison with Poisson distribution Blue bars denote a histogram of data divided into 1 sec bins. Red curve is a Poisson curve with rate = median count rate of data. |
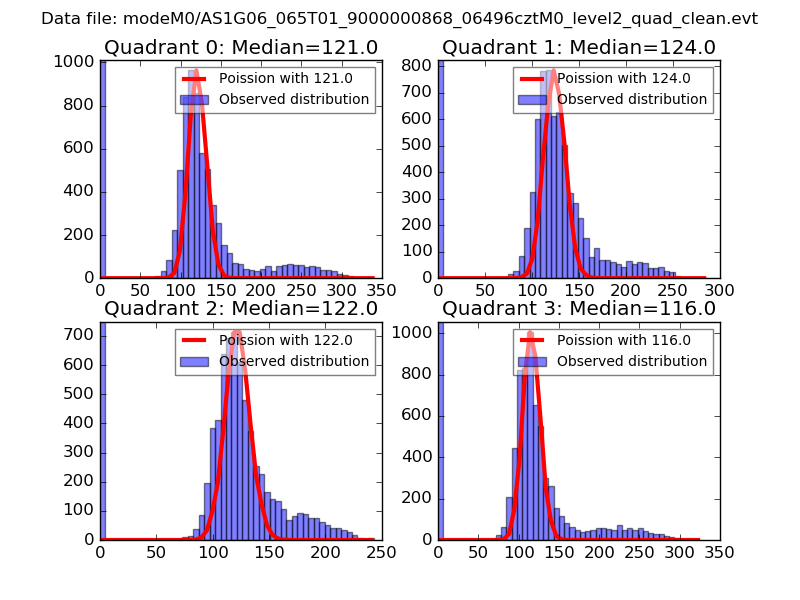 |
 |
| Quadrant-wise count rates Data is divided into 100 sec bins |
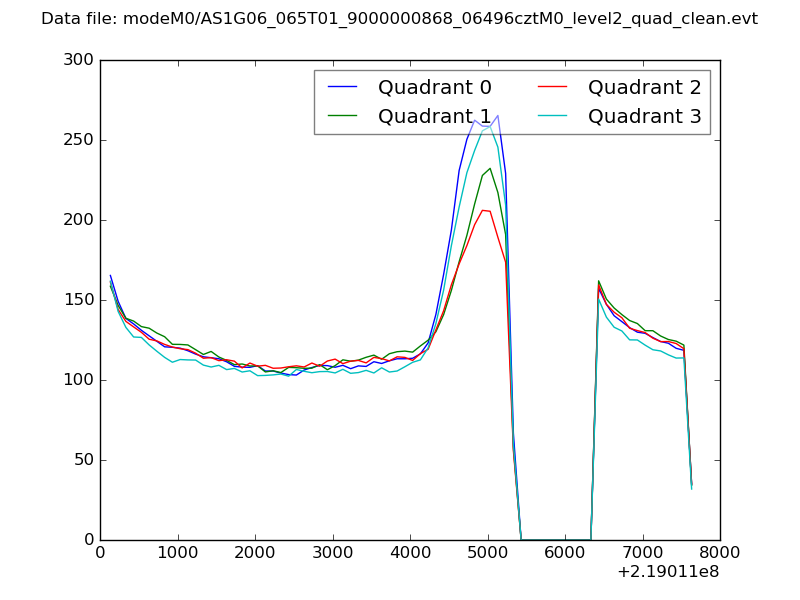 |
|
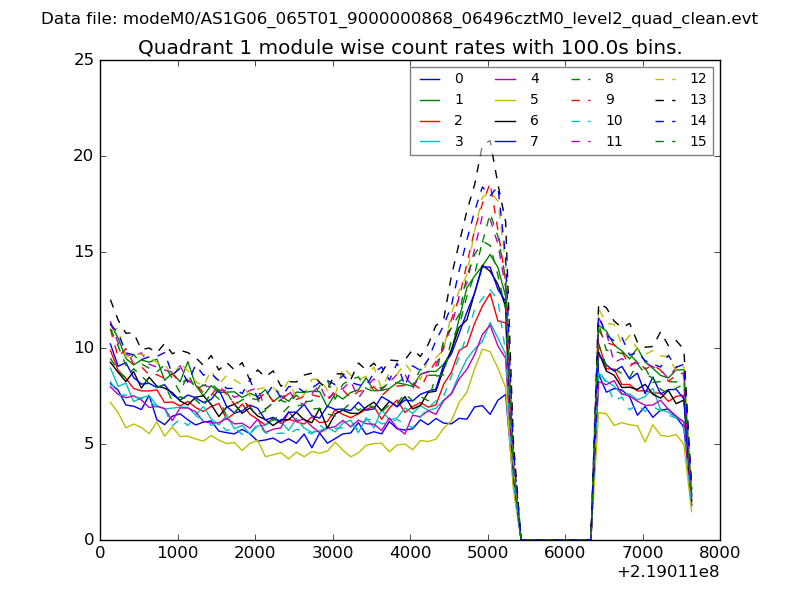
| Module-wise count rates for Quadrant A Data is divided into 100 sec bins |
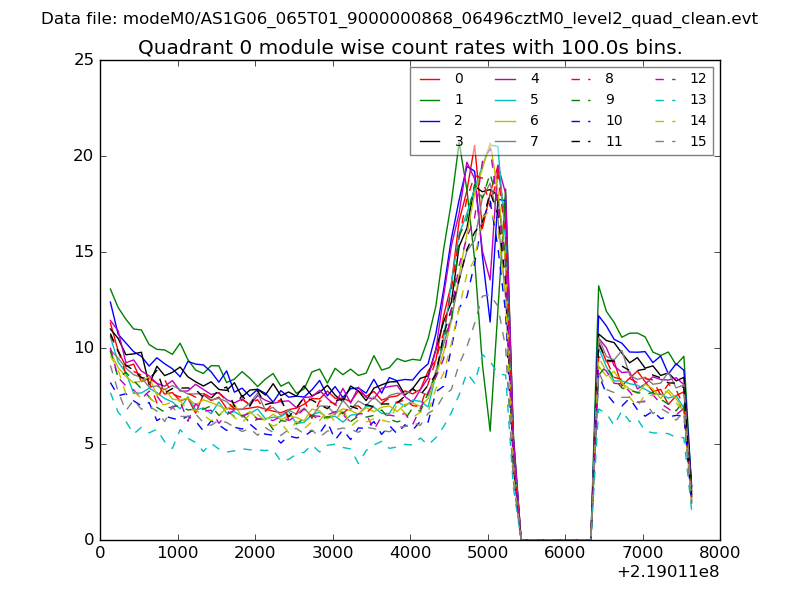 |
 |
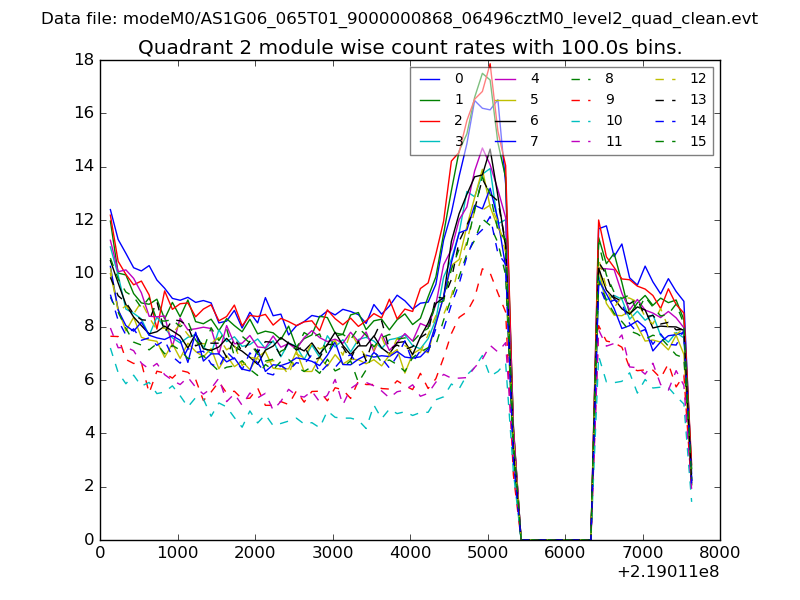
| Module-wise count rates for Quadrant B Data is divided into 100 sec bins |
 |
 |
| Module-wise count rates for Quadrant C Data is divided into 100 sec bins |
 |
 |
| Module-wise count rates for Quadrant D Data is divided into 100 sec bins |
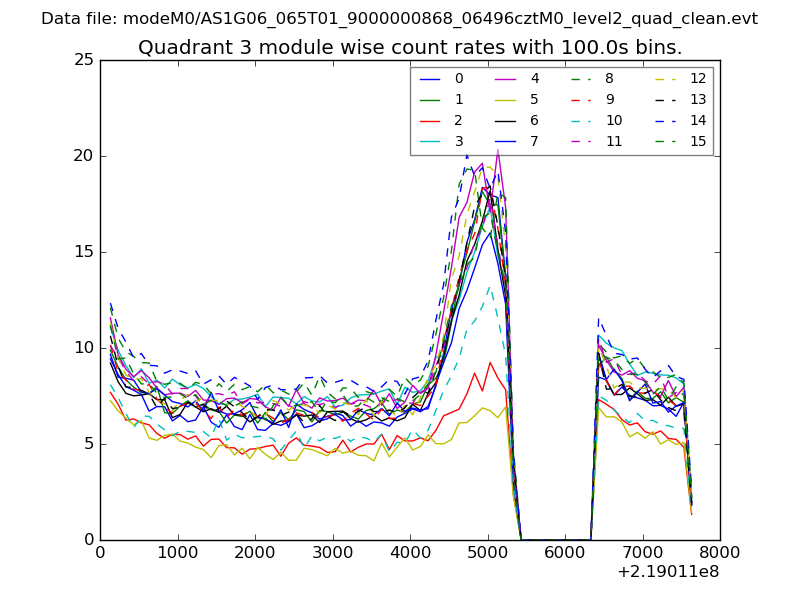 |
 |
| Parameter | Plot |
|---|---|
| CZT HV Monitor | 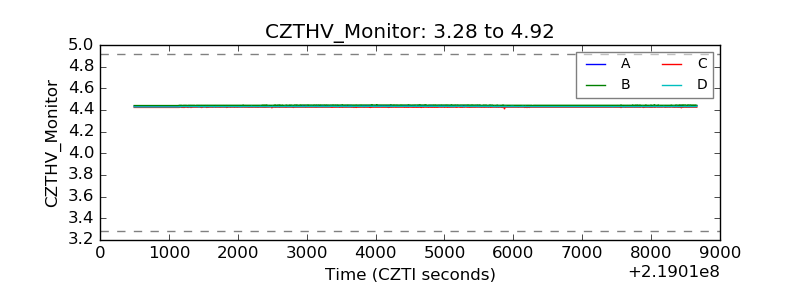 |
| D_VDD |  |
| Temperature 1 | 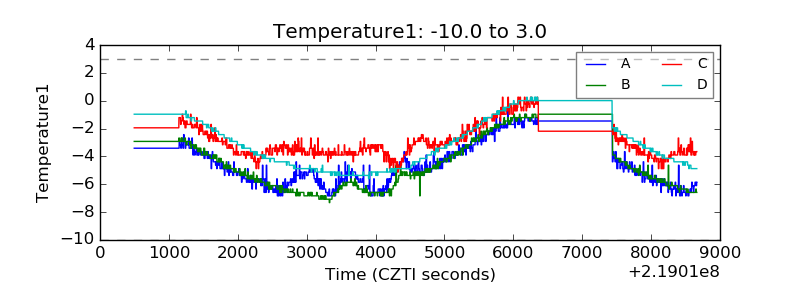 |
| Veto HV Monitor | 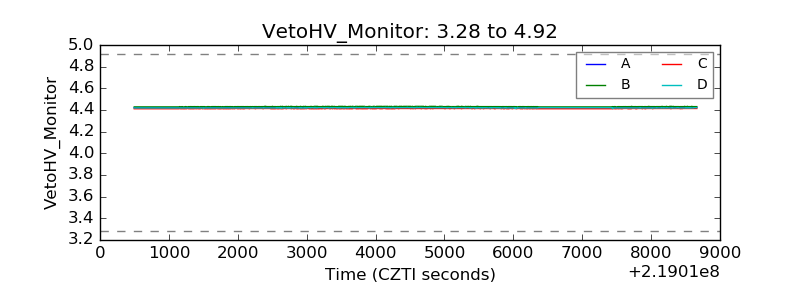 |
| Veto LLD | 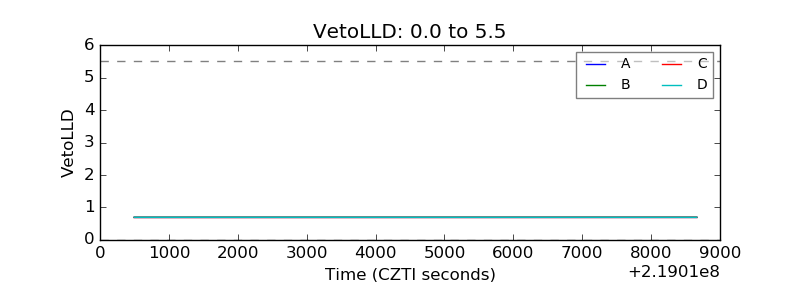 |
| Alpha Counter | 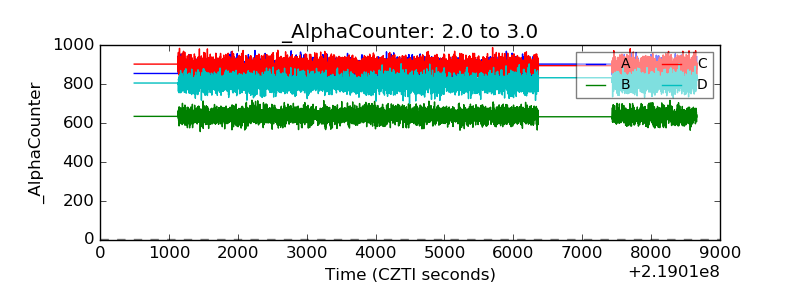 |
| _CPM_Rate | 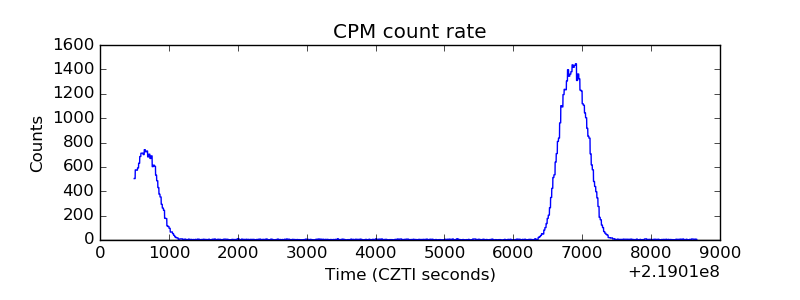 |
| CZT Counter | 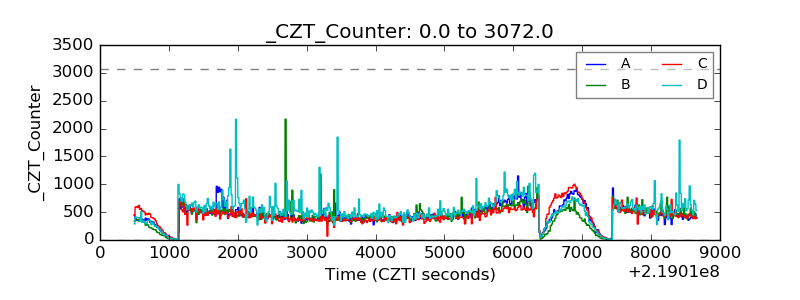 |
| +2.5 Volts monitor |  |
| +5 Volts monitor |  |
| _ROLL_ROT | 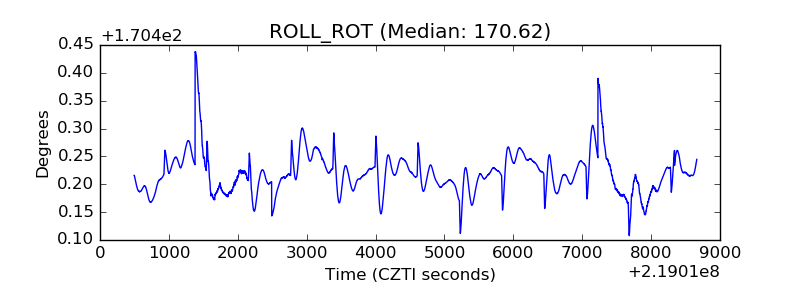 |
| _Roll_DEC | 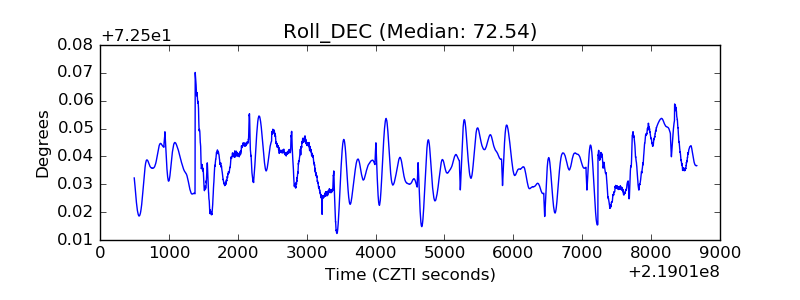 |
| _Roll_RA | 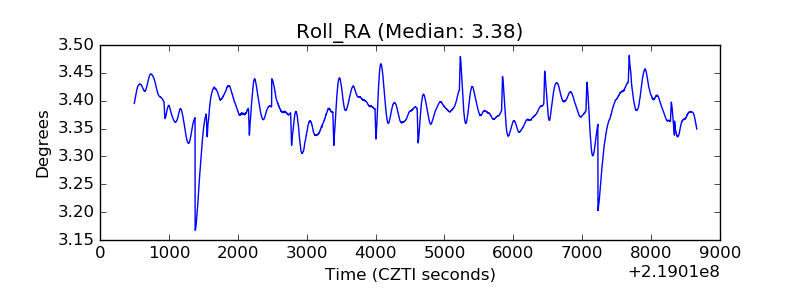 |
| Veto Counter | 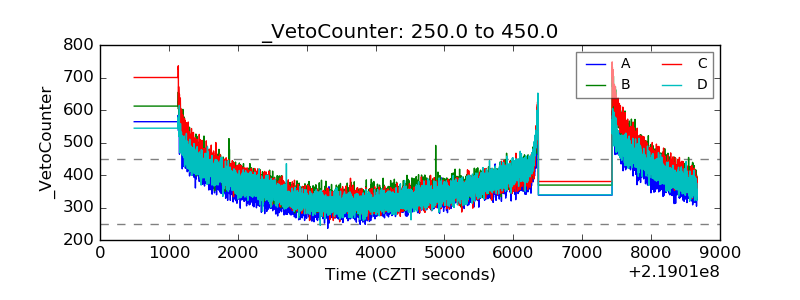 |