| Param | Original file | Final file |
|---|---|---|
| Filename | modeM0/AS1G06_134T11_9000000870cztM0_level2.fits | modeM0/AS1G06_134T11_9000000870cztM0_level2_quad_clean.evt |
| Size (bytes) | 302,241,600 | 301,858,560 |
| Size | 288.2 MB | 287.9 MB |
| Events in quadrant A | 1,817,502 | 1,795,930 |
| Events in quadrant B | 1,769,070 | 1,819,698 |
| Events in quadrant C | 1,795,660 | 1,721,307 |
| Events in quadrant D | 1,529,060 | 1,562,318 |
| Mode M0 | |||
|---|---|---|---|
| Quadrant | BADHDUFLAG | Total packets | Discarded packets |
| A | 0 | 67925 | 0 |
| B | 0 | 68023 | 0 |
| C | 0 | 66660 | 0 |
| D | 0 | 76319 | 0 |
| Mode M9 | |||
|---|---|---|---|
| Quadrant | BADHDUFLAG | Total packets | Discarded packets |
| A | 0 | 69 | 0 |
| B | 0 | 69 | 0 |
| C | 0 | 69 | 0 |
| D | 0 | 69 | 0 |
| Mode SS | |||
|---|---|---|---|
| Quadrant | BADHDUFLAG | Total packets | Discarded packets |
| A | 0 | 668 | 0 |
| B | 0 | 668 | 0 |
| C | 0 | 668 | 0 |
| D | 0 | 668 | 0 |
| Quadrant | Total seconds | Saturated seconds | Saturation percentage |
|---|---|---|---|
| A | 32621 | 481 | 1.474510% |
| B | 32621 | 261 | 0.800098% |
| C | 32621 | 85 | 0.260568% |
| D | 32621 | 564 | 1.728948% |
Noise dominated data is calculated using 1-second bins in cleaned event files. If a bin has >2000 counts, and if more than 50% of those come from <1% of pixels, then it is considered to be noise-dominated and hence unusable.
| Quadrant | # 1 sec bins | Bins with >0 counts | Bins with >2000 counts | High rate bins dominated by noise | Noise dominated (total time) | Noise dominated (detector-on time) | Marked lightcurve |
|---|---|---|---|---|---|---|---|
| A | 39600 | 32620 | 0 | 0 | 0.00% | 0.00% |  |
| B | 39600 | 32620 | 0 | 0 | 0.00% | 0.00% |  |
| C | 39600 | 32620 | 0 | 0 | 0.00% | 0.00% |  |
| D | 39600 | 32598 | 0 | 0 | 0.00% | 0.00% |  |
Top three noisy pixels from each quadrant. If the there are fewer than three noisy pixels in the level2.evt file, extra rows are filled as -1
| Pixel properties | Quadrant properties | ||||||
|---|---|---|---|---|---|---|---|
| Quadrant | DetID | PixID | Counts | Sigma | Mean | Median | Sigma |
| A | 0 | 29 | 1704 | 10.51 | 473 | 445 | 119.8 |
| A | 7 | 110 | 1563 | 9.33 | 473 | 445 | 119.8 |
| A | 9 | 19 | 1346 | 7.52 | 473 | 445 | 119.8 |
| B | 2 | 9 | 1527 | 11.36 | 468 | 447 | 95.1 |
| B | 14 | 254 | 1215 | 8.08 | 468 | 447 | 95.1 |
| B | 12 | 226 | 1201 | 7.93 | 468 | 447 | 95.1 |
| C | 1 | 80 | 1353 | 7.33 | 473 | 440 | 124.6 |
| C | 1 | 81 | 1306 | 6.95 | 473 | 440 | 124.6 |
| C | 2 | 191 | 1227 | 6.32 | 473 | 440 | 124.6 |
| D | 3 | 14 | 1160 | 6.35 | 436 | 395 | 120.4 |
| D | 6 | 231 | 1135 | 6.15 | 436 | 395 | 120.4 |
| D | 7 | 5 | 1134 | 6.14 | 436 | 395 | 120.4 |
Histogram calculated using DETX and DETY for each event in the final _common_clean file
| Quadrant A |  |
 |
Quadrant B |
|---|---|---|---|
| Quadrant D | 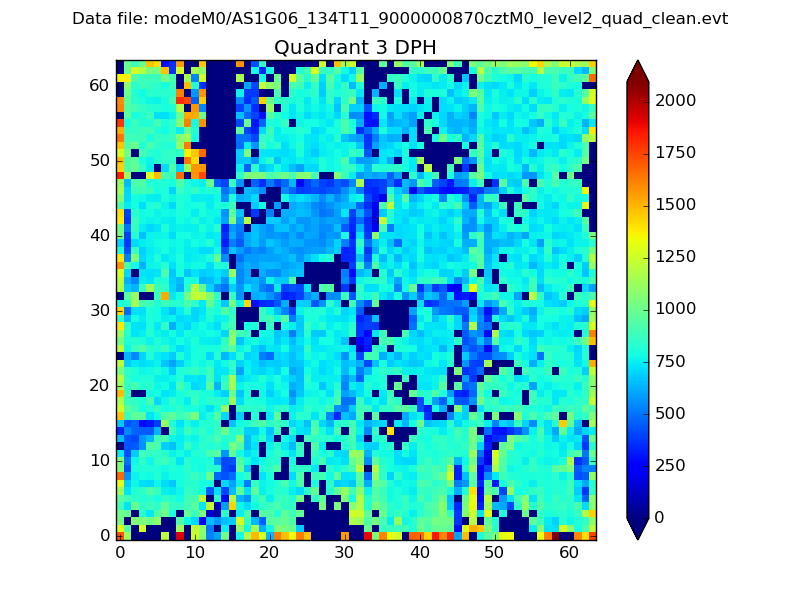 |
 |
Quadrant C |
| Plot type | Count rate plots | Images |
|---|---|---|
| Comparison with Poisson distribution Blue bars denote a histogram of data divided into 1 sec bins. Red curve is a Poisson curve with rate = median count rate of data. |
 |
 |
| Quadrant-wise count rates Data is divided into 100 sec bins |
 |
|
| Module-wise count rates for Quadrant A Data is divided into 100 sec bins |
 |
 |
| Module-wise count rates for Quadrant B Data is divided into 100 sec bins |
 |
 |
| Module-wise count rates for Quadrant C Data is divided into 100 sec bins |
 |
 |
| Module-wise count rates for Quadrant D Data is divided into 100 sec bins |
 |
 |
| Parameter | Plot |
|---|---|
| CZT HV Monitor |  |
| D_VDD |  |
| Temperature 1 |  |
| Veto HV Monitor |  |
| Veto LLD |  |
| Alpha Counter |  |
| _CPM_Rate |  |
| CZT Counter |  |
| +2.5 Volts monitor |  |
| +5 Volts monitor |  |
| _ROLL_ROT |  |
| _Roll_DEC |  |
| _Roll_RA |  |
| Veto Counter |  |