| Param | Original file | Final file |
|---|---|---|
| Filename | modeM0/AS1G06_134T11_9000000870_06496cztM0_level2.evt | modeM0/AS1G06_134T11_9000000870_06496cztM0_level2_quad_clean.evt |
| Size (bytes) | 327,430,080 | 80,533,440 |
| Size | 312.3 MB | 76.8 MB |
| Events in quadrant A | 2,403,971 | 519,762 |
| Events in quadrant B | 2,313,670 | 542,146 |
| Events in quadrant C | 2,113,490 | 535,244 |
| Events in quadrant D | 2,755,841 | 502,696 |
| Mode M0 | |||
|---|---|---|---|
| Quadrant | BADHDUFLAG | Total packets | Discarded packets |
| A | 0 | 10679 | 2 |
| B | 0 | 10327 | 1 |
| C | 0 | 9936 | 1 |
| D | 0 | 11535 | 1 |
| Mode M9 | |||
|---|---|---|---|
| Quadrant | BADHDUFLAG | Total packets | Discarded packets |
| A | 0 | 11 | 0 |
| B | 0 | 11 | 0 |
| C | 0 | 11 | 0 |
| D | 0 | 11 | 0 |
| Mode SS | |||
|---|---|---|---|
| Quadrant | BADHDUFLAG | Total packets | Discarded packets |
| A | 0 | 100 | 0 |
| B | 0 | 100 | 0 |
| C | 0 | 100 | 0 |
| D | 0 | 100 | 0 |
| Quadrant | Total seconds | Saturated seconds | Saturation percentage |
|---|---|---|---|
| A | 4821 | 209 | 4.335200% |
| B | 4821 | 54 | 1.120100% |
| C | 4821 | 21 | 0.435594% |
| D | 4821 | 90 | 1.866833% |
Noise dominated data is calculated using 1-second bins in cleaned event files. If a bin has >2000 counts, and if more than 50% of those come from <1% of pixels, then it is considered to be noise-dominated and hence unusable.
| Quadrant | # 1 sec bins | Bins with >0 counts | Bins with >2000 counts | High rate bins dominated by noise | Noise dominated (total time) | Noise dominated (detector-on time) | Marked lightcurve |
|---|---|---|---|---|---|---|---|
| A | 5980 | 4821 | 13 | 13 | 0.22% | 0.27% | 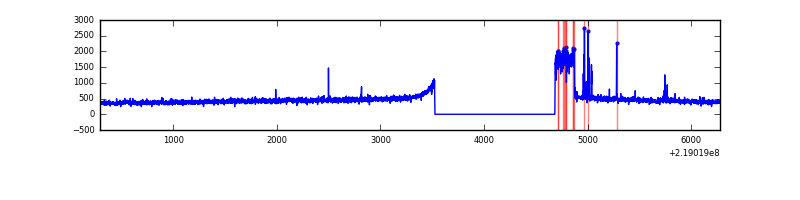 |
| B | 5980 | 4821 | 16 | 16 | 0.27% | 0.33% |  |
| C | 5980 | 4821 | 0 | 0 | 0.00% | 0.00% | 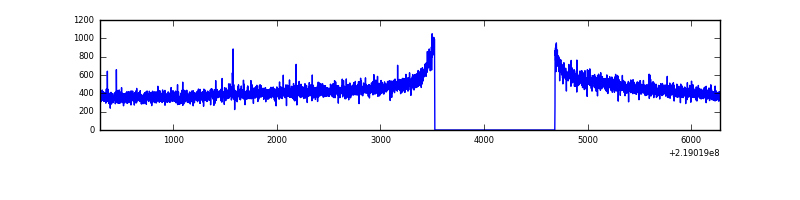 |
| D | 5980 | 4821 | 39 | 39 | 0.65% | 0.81% | 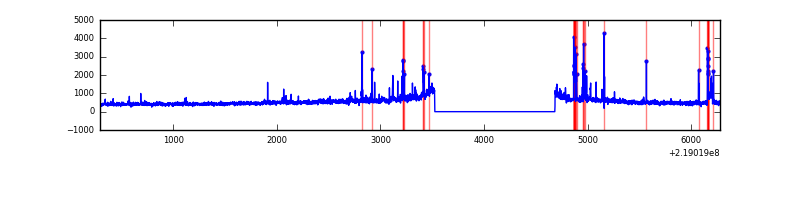 |
Top three noisy pixels from each quadrant. If the there are fewer than three noisy pixels in the level2.evt file, extra rows are filled as -1
| Pixel properties | Quadrant properties | ||||||
|---|---|---|---|---|---|---|---|
| Quadrant | DetID | PixID | Counts | Sigma | Mean | Median | Sigma |
| A | 15 | 236 | 247126 | 2215.04 | 547 | 536 | 111.3 |
| A | 8 | 15 | 38537 | 341.35 | 547 | 536 | 111.3 |
| A | 0 | 226 | 5400 | 43.69 | 547 | 536 | 111.3 |
| B | 0 | 219 | 39894 | 372.19 | 559 | 548 | 105.7 |
| B | 15 | 35 | 36885 | 343.73 | 559 | 548 | 105.7 |
| B | 4 | 172 | 22081 | 203.69 | 559 | 548 | 105.7 |
| C | 1 | 16 | 4922 | 34.95 | 539 | 541 | 125.4 |
| C | 13 | 61 | 4311 | 30.07 | 539 | 541 | 125.4 |
| C | 12 | 4 | 2538 | 15.93 | 539 | 541 | 125.4 |
| D | 8 | 195 | 403425 | 3102.9 | 534 | 518 | 129.8 |
| D | 2 | 33 | 153755 | 1180.12 | 534 | 518 | 129.8 |
| D | 2 | 152 | 74943 | 573.17 | 534 | 518 | 129.8 |
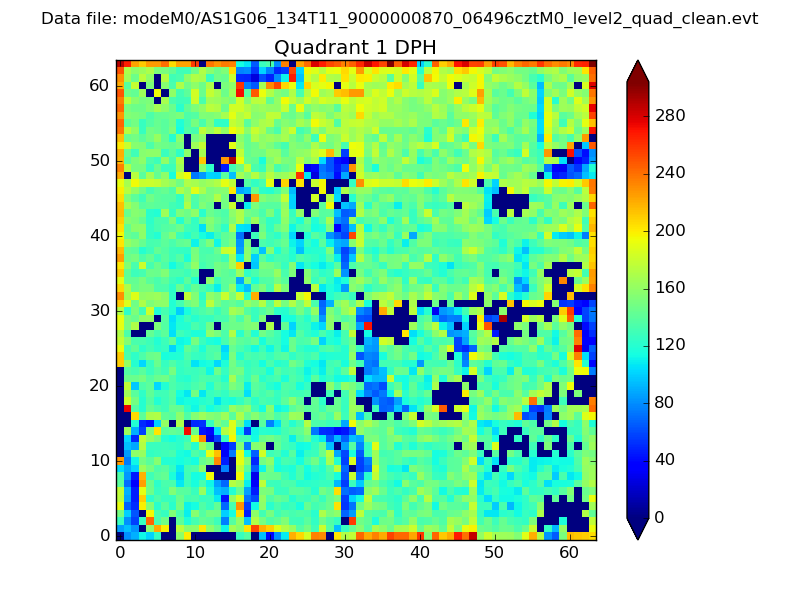
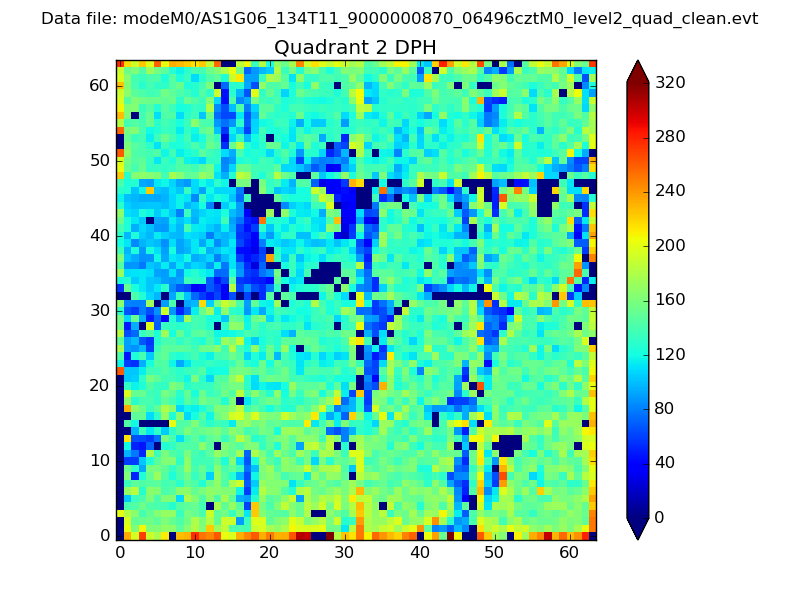
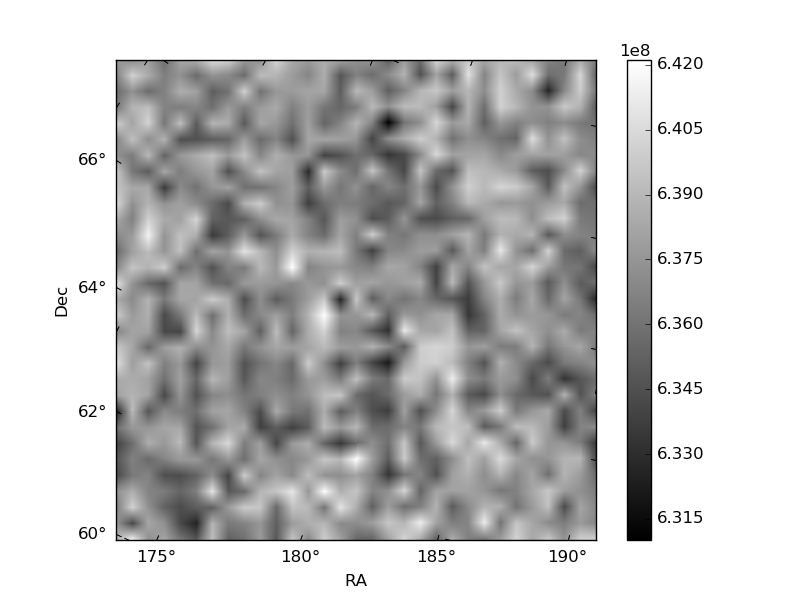
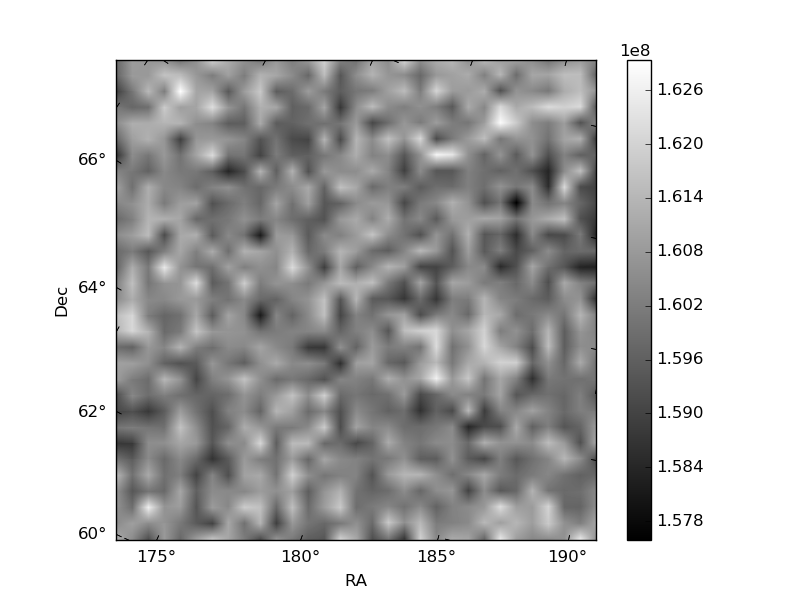
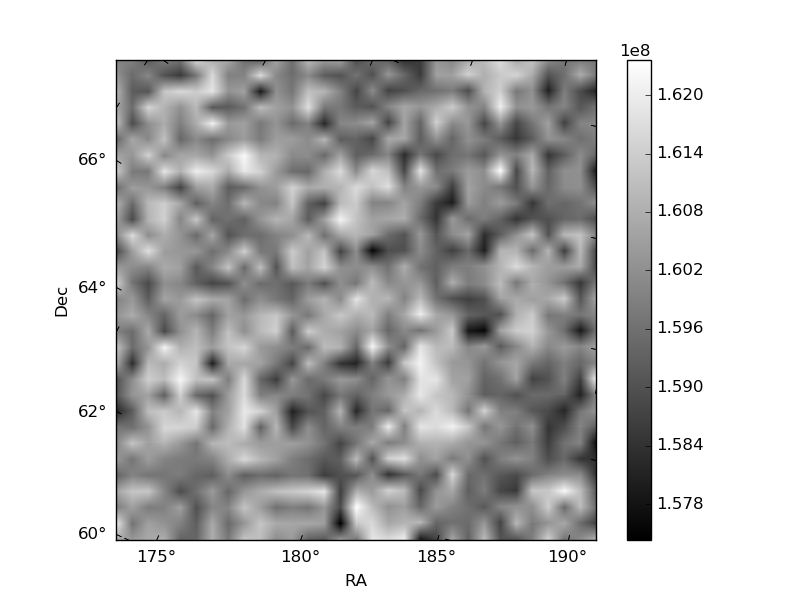
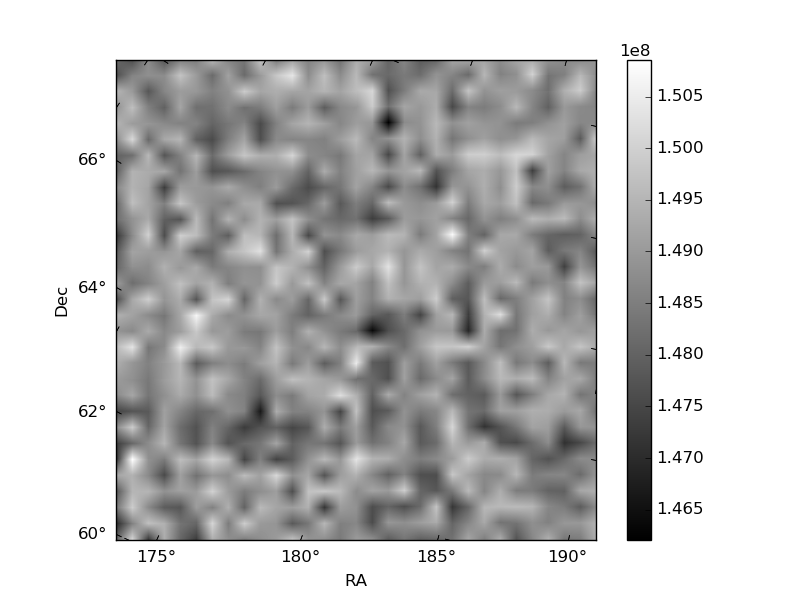
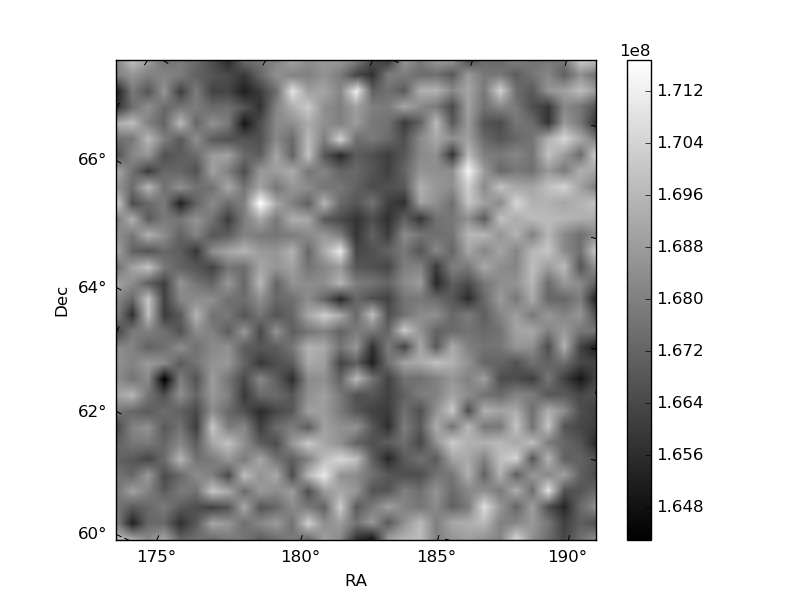
Histogram calculated using DETX and DETY for each event in the final _common_clean file
| Quadrant A | 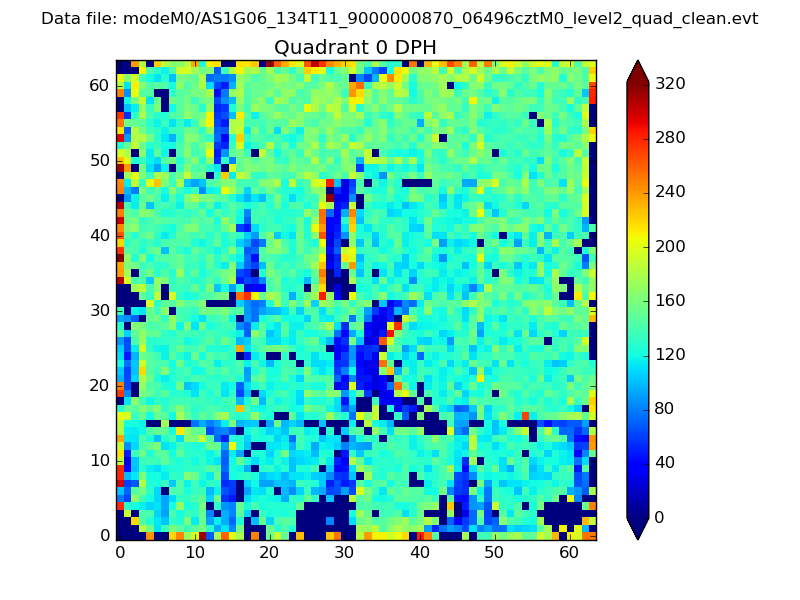 |
 |
Quadrant B |
|---|---|---|---|
| Quadrant D | 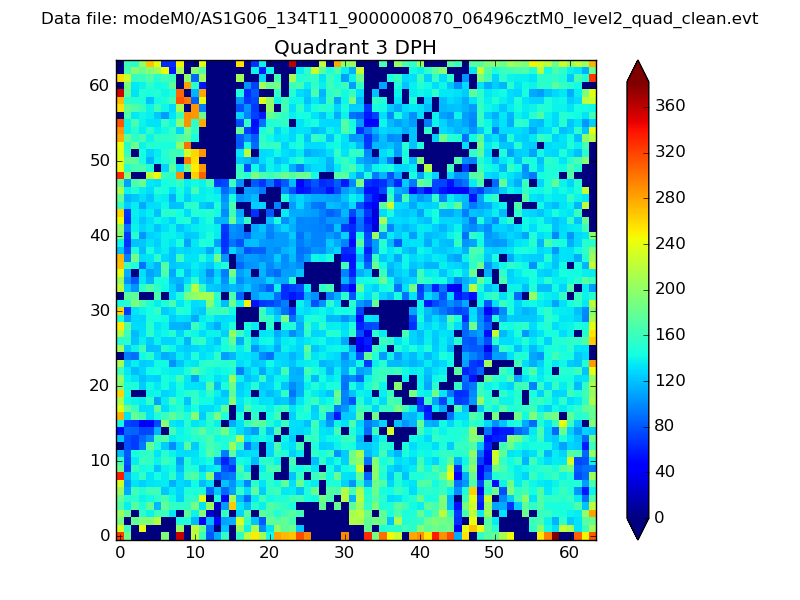 |
 |
Quadrant C |
| Plot type | Count rate plots | Images |
|---|---|---|
| Comparison with Poisson distribution Blue bars denote a histogram of data divided into 1 sec bins. Red curve is a Poisson curve with rate = median count rate of data. |
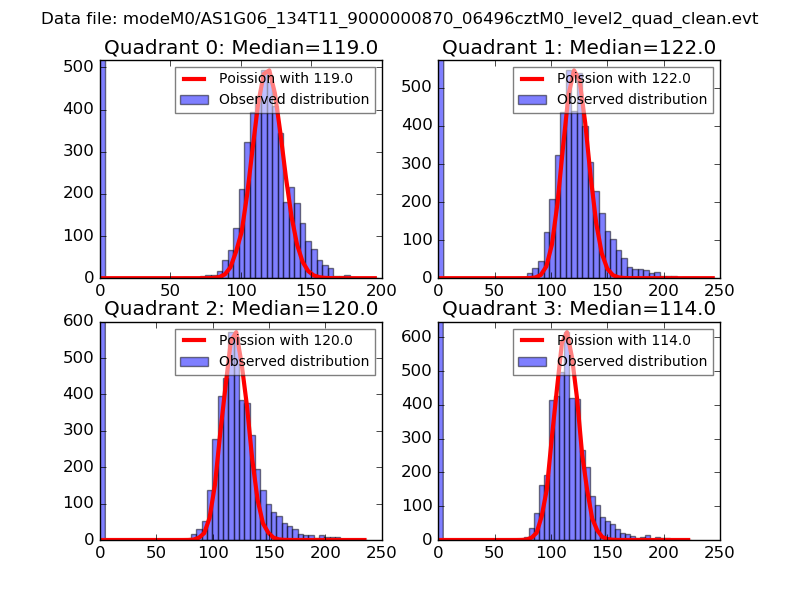 |
 |
| Quadrant-wise count rates Data is divided into 100 sec bins |
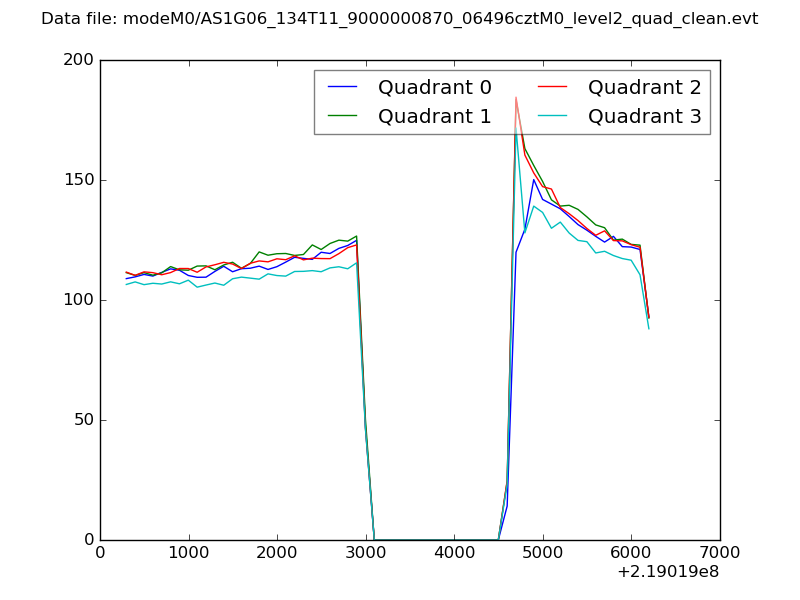 |
|
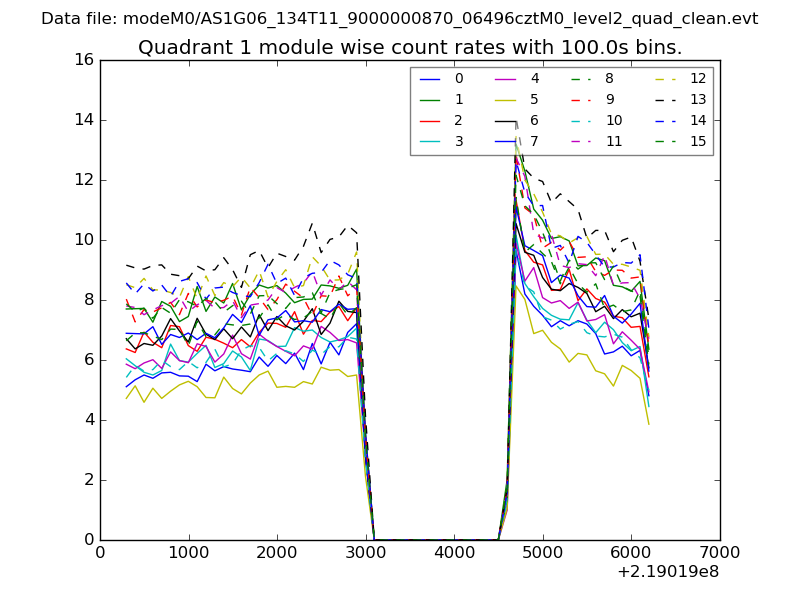
| Module-wise count rates for Quadrant A Data is divided into 100 sec bins |
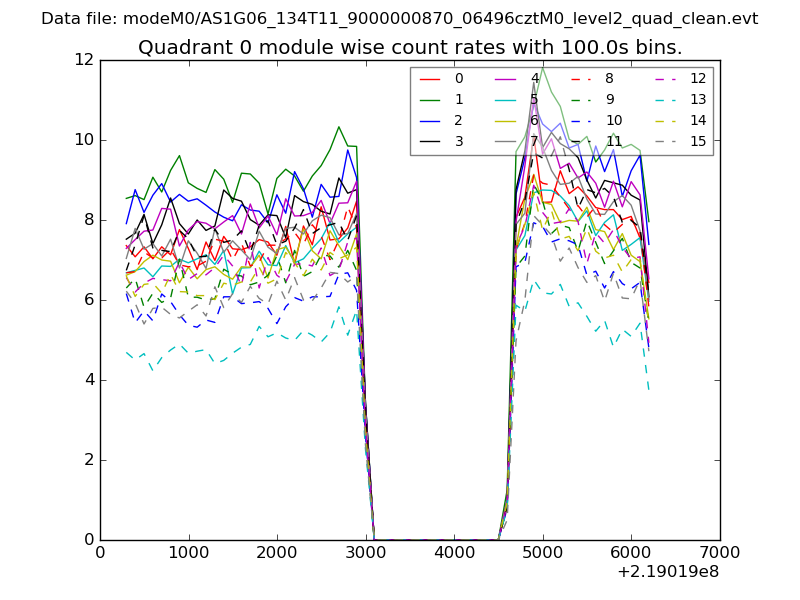 |
 |
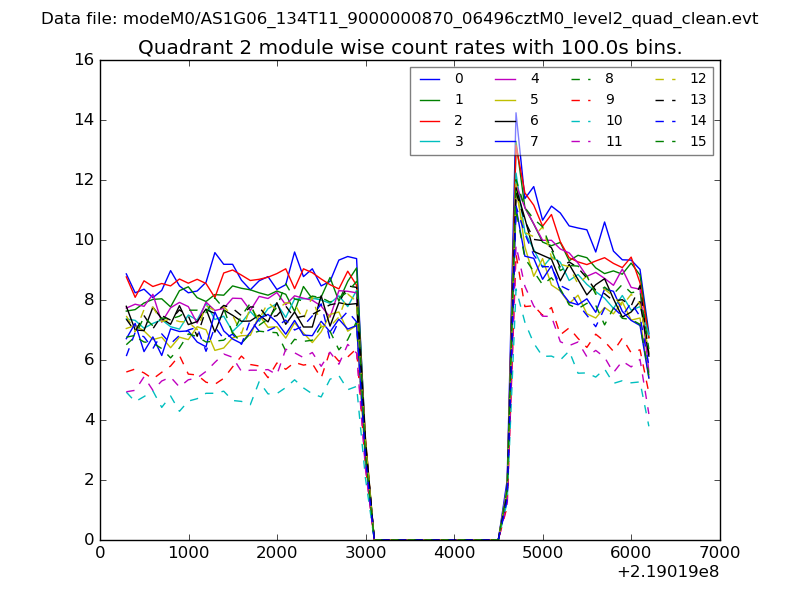
| Module-wise count rates for Quadrant B Data is divided into 100 sec bins |
 |
 |
| Module-wise count rates for Quadrant C Data is divided into 100 sec bins |
 |
 |
| Module-wise count rates for Quadrant D Data is divided into 100 sec bins |
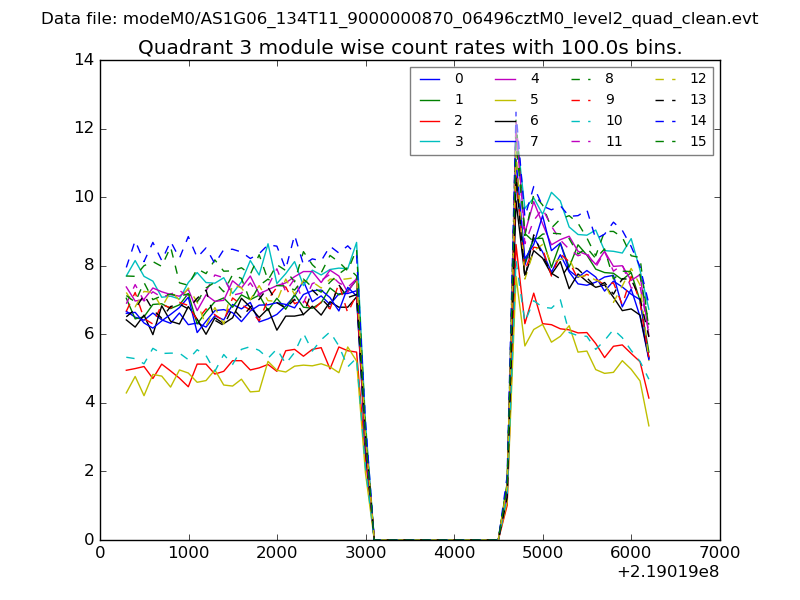 |
 |
| Parameter | Plot |
|---|---|
| CZT HV Monitor | 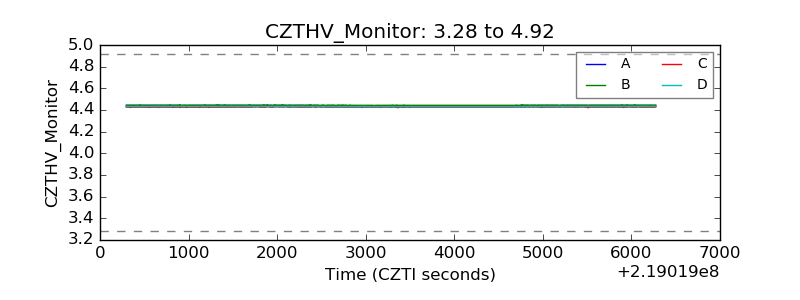 |
| D_VDD | 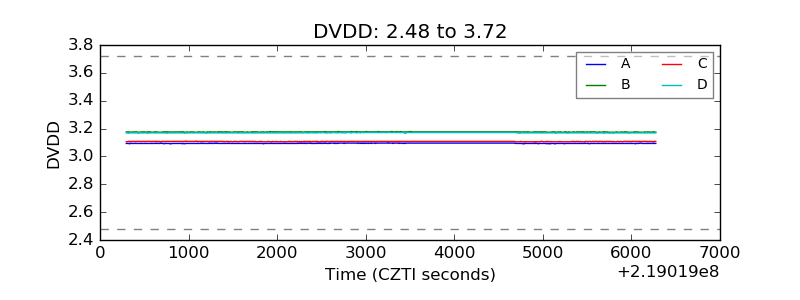 |
| Temperature 1 | 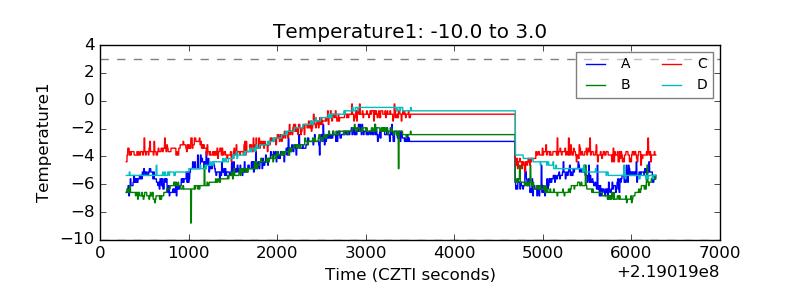 |
| Veto HV Monitor | 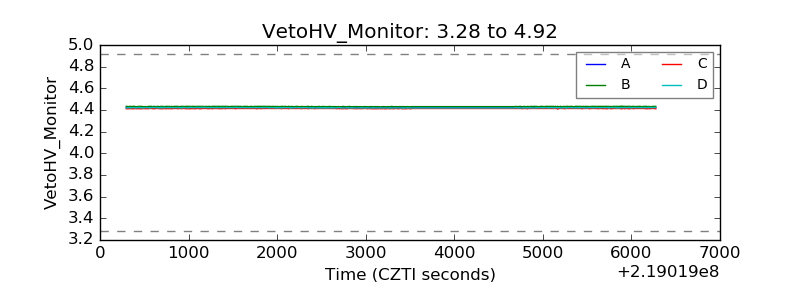 |
| Veto LLD | 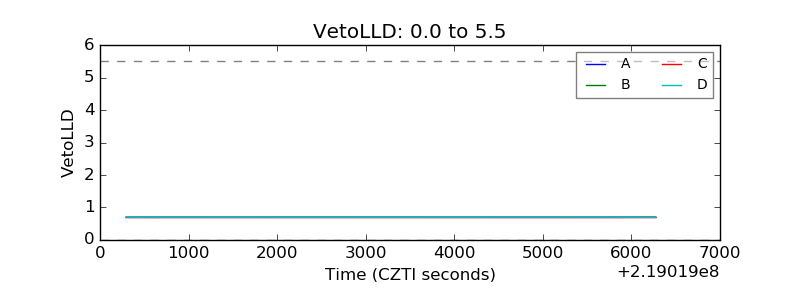 |
| Alpha Counter | 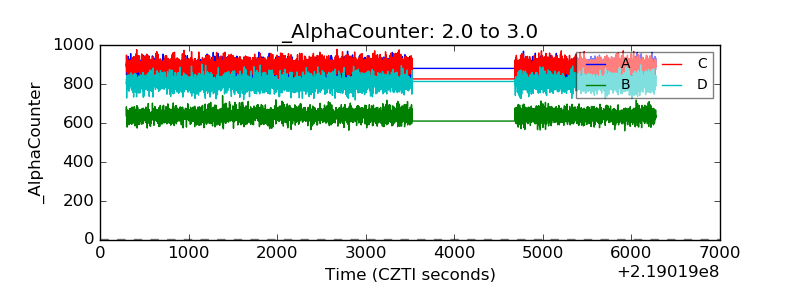 |
| _CPM_Rate | 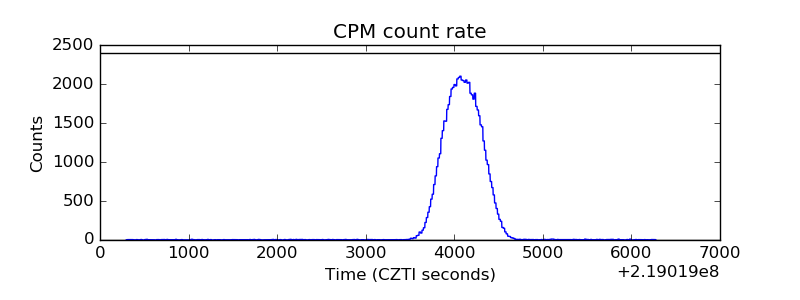 |
| CZT Counter | 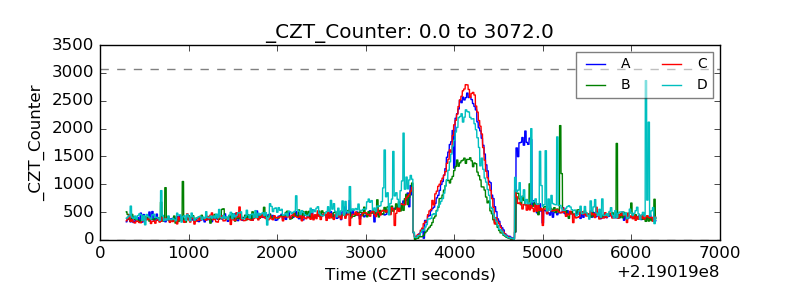 |
| +2.5 Volts monitor |  |
| +5 Volts monitor |  |
| _ROLL_ROT | 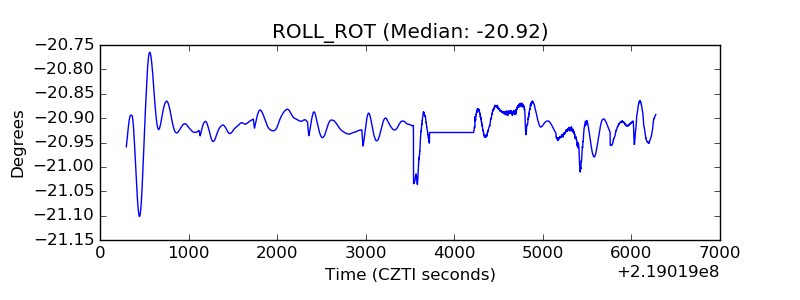 |
| _Roll_DEC | 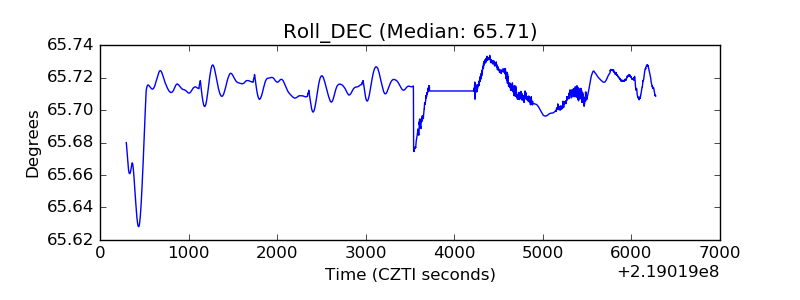 |
| _Roll_RA | 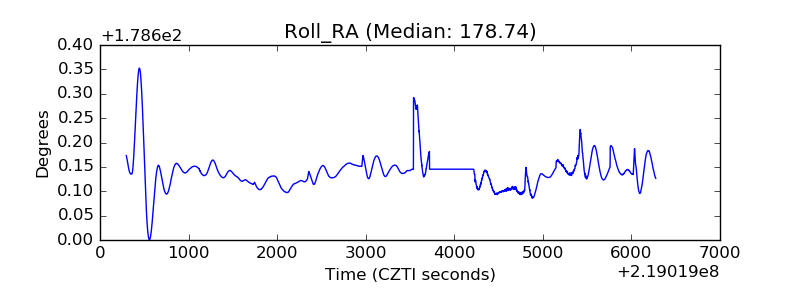 |
| Veto Counter | 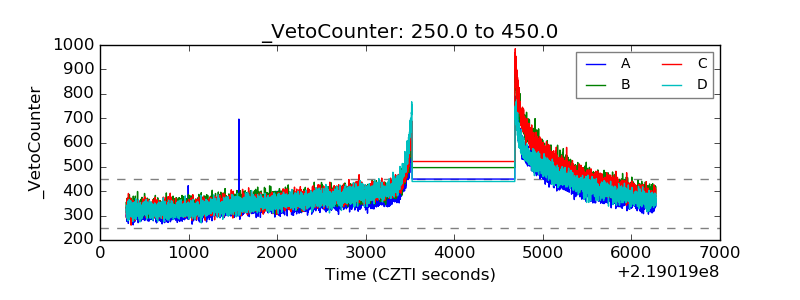 |