| Param | Original file | Final file |
|---|---|---|
| Filename | modeM0/AS1G06_134T11_9000000870_06498cztM0_level2.evt | modeM0/AS1G06_134T11_9000000870_06498cztM0_level2_quad_clean.evt |
| Size (bytes) | 422,956,800 | 102,199,680 |
| Size | 403.4 MB | 97.5 MB |
| Events in quadrant A | 2,934,164 | 669,190 |
| Events in quadrant B | 2,992,270 | 691,241 |
| Events in quadrant C | 2,793,130 | 667,144 |
| Events in quadrant D | 3,663,192 | 630,010 |
| Mode M0 | |||
|---|---|---|---|
| Quadrant | BADHDUFLAG | Total packets | Discarded packets |
| A | 0 | 13037 | 3 |
| B | 0 | 13146 | 2 |
| C | 0 | 12814 | 2 |
| D | 0 | 15122 | 2 |
| Mode M9 | |||
|---|---|---|---|
| Quadrant | BADHDUFLAG | Total packets | Discarded packets |
| A | 0 | 20 | 0 |
| B | 0 | 20 | 0 |
| C | 0 | 20 | 0 |
| D | 0 | 21 | 0 |
| Mode SS | |||
|---|---|---|---|
| Quadrant | BADHDUFLAG | Total packets | Discarded packets |
| A | 0 | 128 | 0 |
| B | 0 | 128 | 0 |
| C | 0 | 128 | 0 |
| D | 0 | 128 | 0 |
| Quadrant | Total seconds | Saturated seconds | Saturation percentage |
|---|---|---|---|
| A | 6269 | 64 | 1.020896% |
| B | 6269 | 43 | 0.685915% |
| C | 6269 | 10 | 0.159515% |
| D | 6269 | 69 | 1.100654% |
Noise dominated data is calculated using 1-second bins in cleaned event files. If a bin has >2000 counts, and if more than 50% of those come from <1% of pixels, then it is considered to be noise-dominated and hence unusable.
| Quadrant | # 1 sec bins | Bins with >0 counts | Bins with >2000 counts | High rate bins dominated by noise | Noise dominated (total time) | Noise dominated (detector-on time) | Marked lightcurve |
|---|---|---|---|---|---|---|---|
| A | 7574 | 6270 | 2 | 2 | 0.03% | 0.03% | 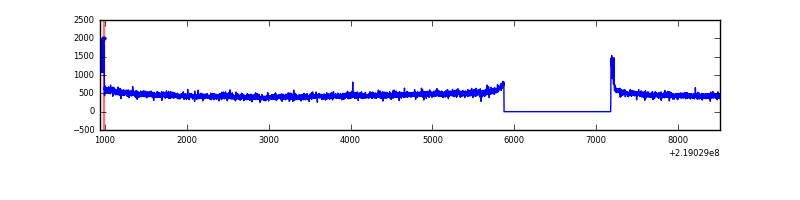 |
| B | 7574 | 6270 | 1 | 1 | 0.01% | 0.02% | 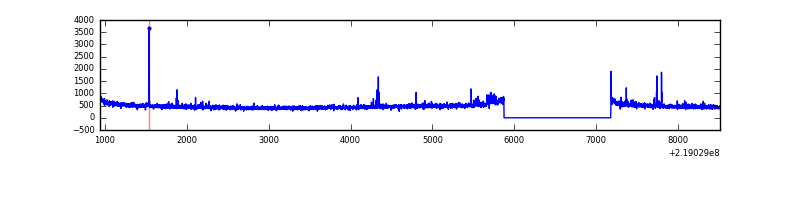 |
| C | 7574 | 6270 | 0 | 0 | 0.00% | 0.00% | 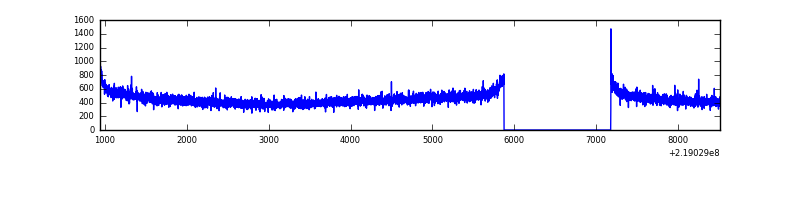 |
| D | 7574 | 6270 | 47 | 47 | 0.62% | 0.75% | 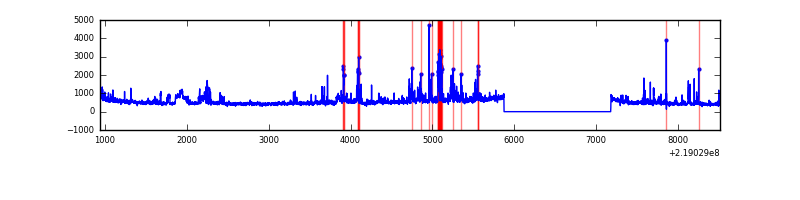 |
Top three noisy pixels from each quadrant. If the there are fewer than three noisy pixels in the level2.evt file, extra rows are filled as -1
| Pixel properties | Quadrant properties | ||||||
|---|---|---|---|---|---|---|---|
| Quadrant | DetID | PixID | Counts | Sigma | Mean | Median | Sigma |
| A | 15 | 236 | 87951 | 593.31 | 735 | 722 | 147.0 |
| A | 8 | 15 | 13747 | 88.59 | 735 | 722 | 147.0 |
| A | 0 | 226 | 7229 | 44.26 | 735 | 722 | 147.0 |
| B | 0 | 219 | 30245 | 210.65 | 748 | 733 | 140.1 |
| B | 4 | 81 | 17602 | 120.41 | 748 | 733 | 140.1 |
| B | 0 | 197 | 17511 | 119.76 | 748 | 733 | 140.1 |
| C | 1 | 16 | 8424 | 47.65 | 712 | 714 | 161.8 |
| C | 13 | 61 | 5767 | 31.23 | 712 | 714 | 161.8 |
| C | 12 | 4 | 3376 | 16.45 | 712 | 714 | 161.8 |
| D | 8 | 195 | 362257 | 2116.38 | 702 | 679 | 170.8 |
| D | 10 | 15 | 158945 | 926.36 | 702 | 679 | 170.8 |
| D | 2 | 152 | 154700 | 901.51 | 702 | 679 | 170.8 |
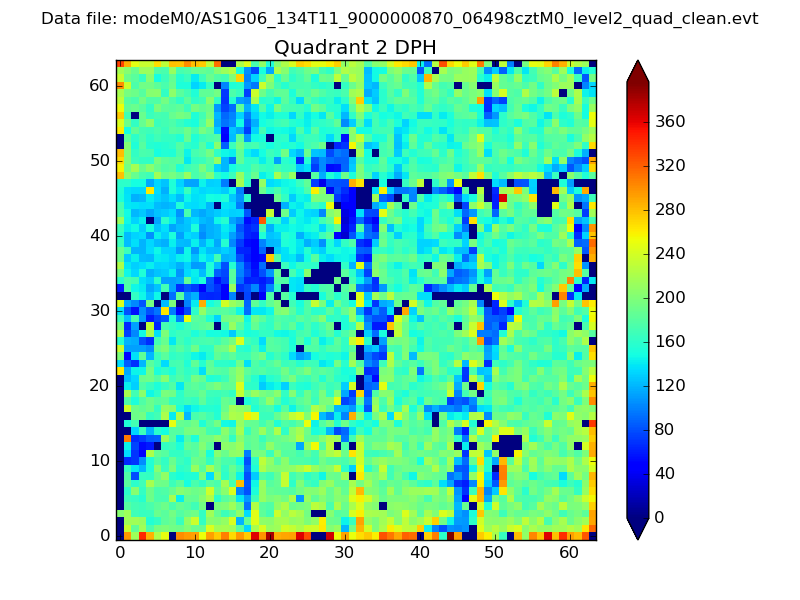
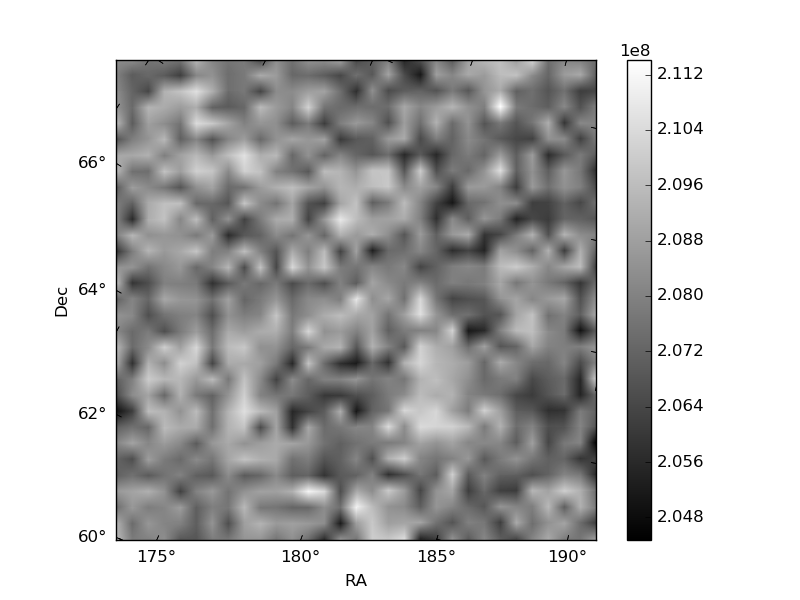
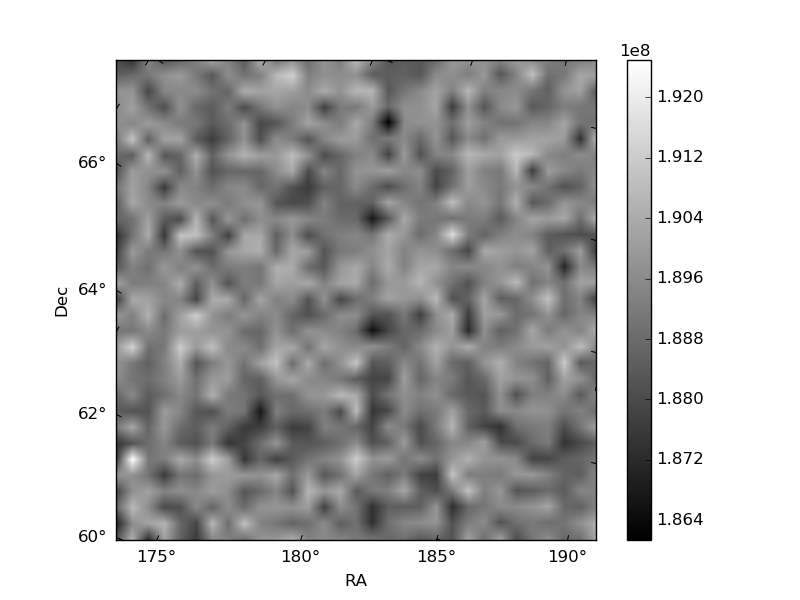
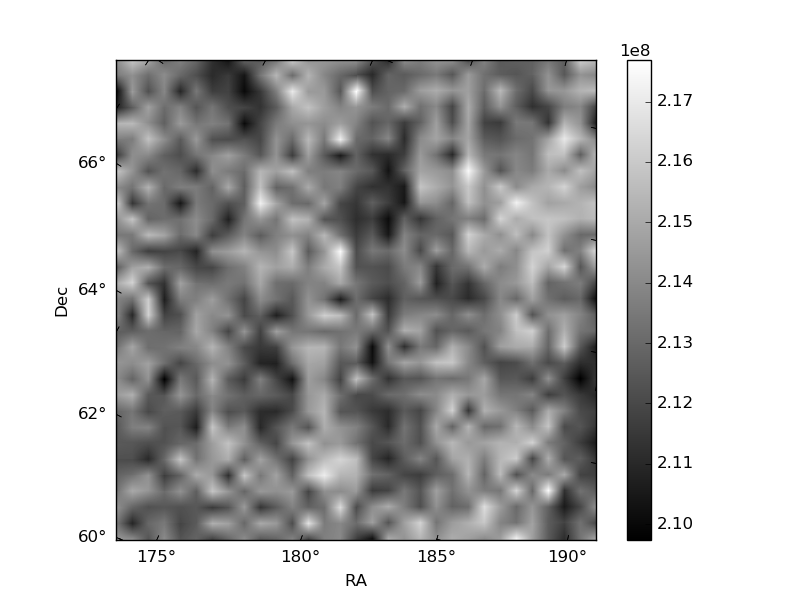
Histogram calculated using DETX and DETY for each event in the final _common_clean file
| Quadrant A | 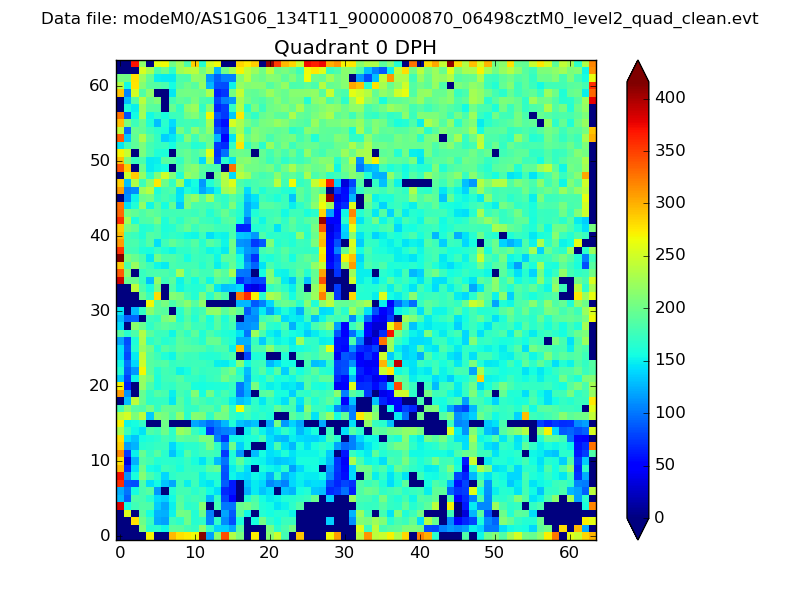 |
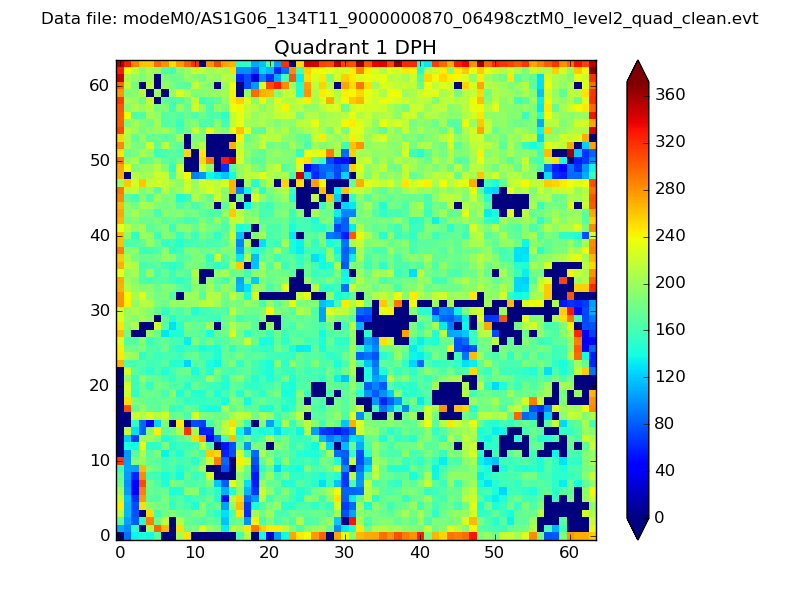 |
Quadrant B |
|---|---|---|---|
| Quadrant D | 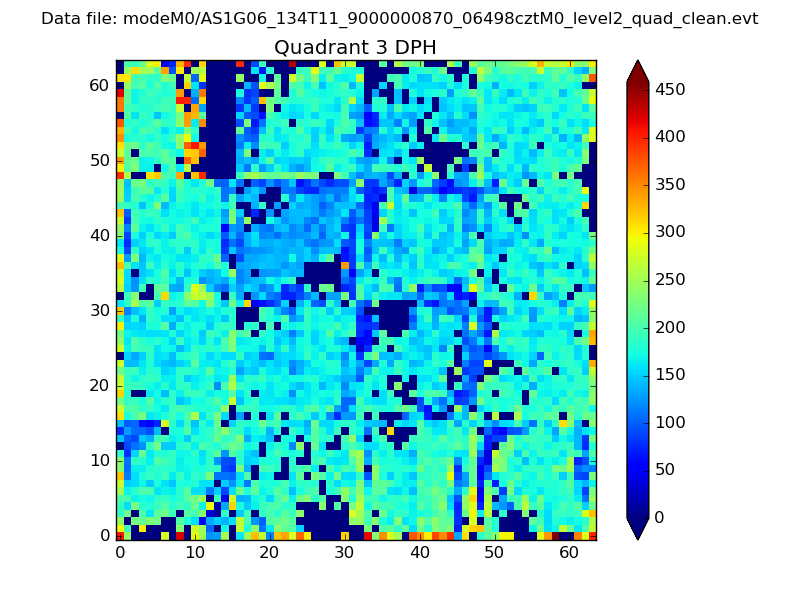 |
 |
Quadrant C |
| Plot type | Count rate plots | Images |
|---|---|---|
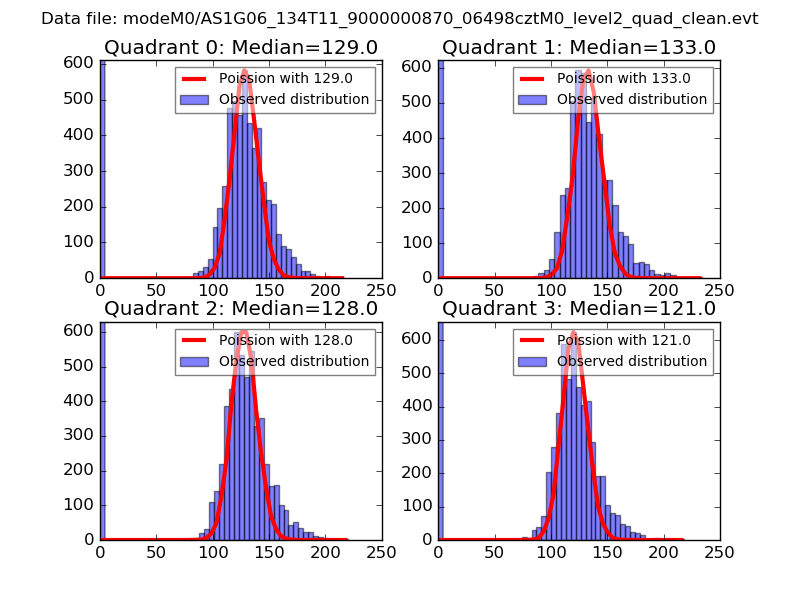
| Comparison with Poisson distribution Blue bars denote a histogram of data divided into 1 sec bins. Red curve is a Poisson curve with rate = median count rate of data. |
 |
 |
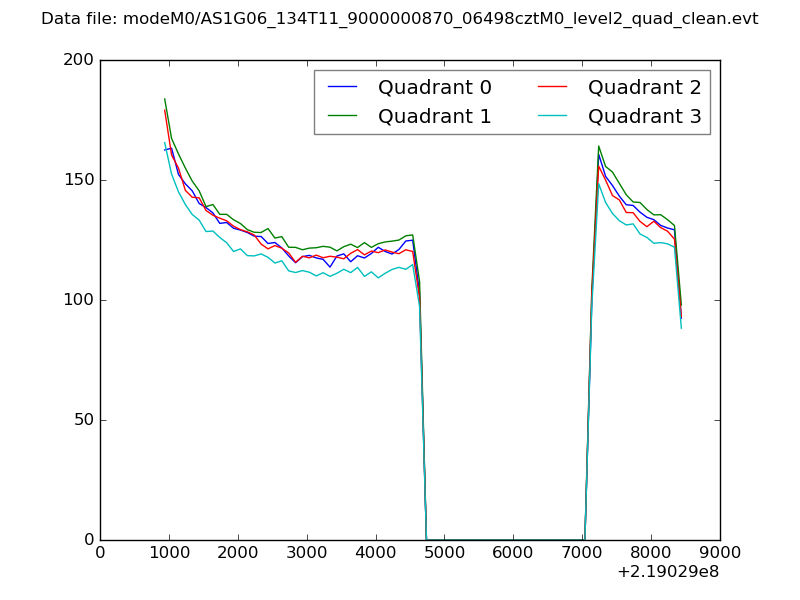
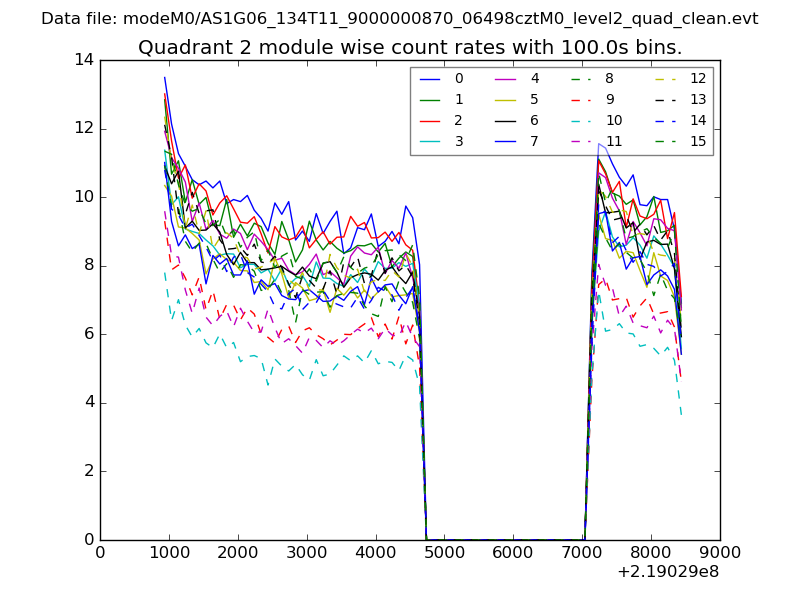
| Quadrant-wise count rates Data is divided into 100 sec bins |
 |
|
| Module-wise count rates for Quadrant A Data is divided into 100 sec bins |
 |
 |
| Module-wise count rates for Quadrant B Data is divided into 100 sec bins |
 |
 |
| Module-wise count rates for Quadrant C Data is divided into 100 sec bins |
 |
 |
| Module-wise count rates for Quadrant D Data is divided into 100 sec bins |
 |
 |
| Parameter | Plot |
|---|---|
| CZT HV Monitor | 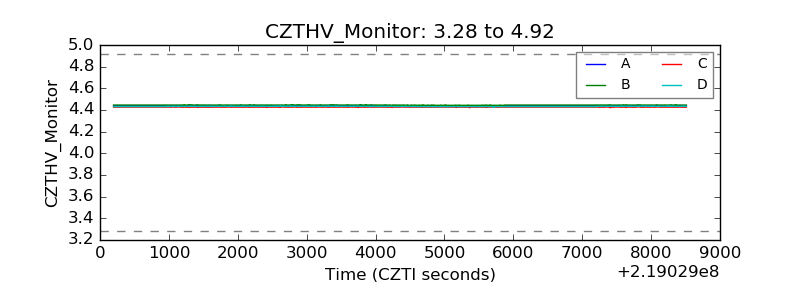 |
| D_VDD | 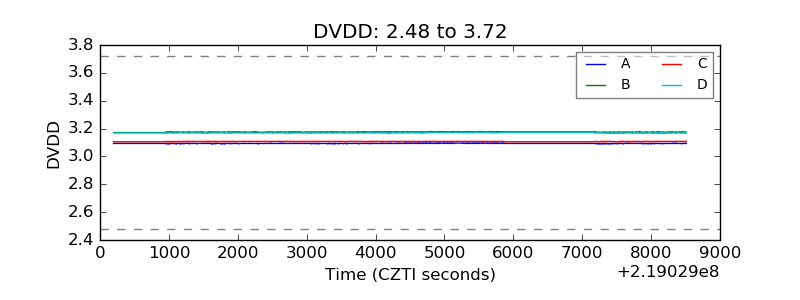 |
| Temperature 1 | 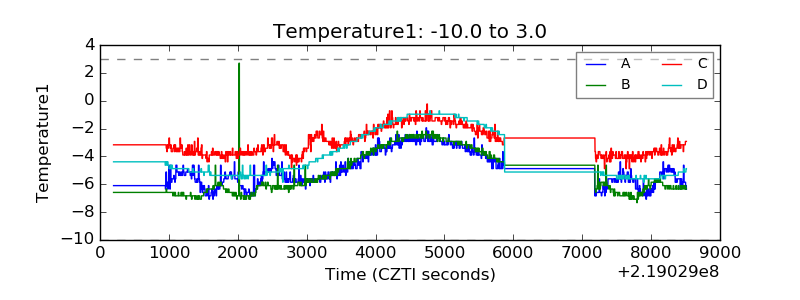 |
| Veto HV Monitor | 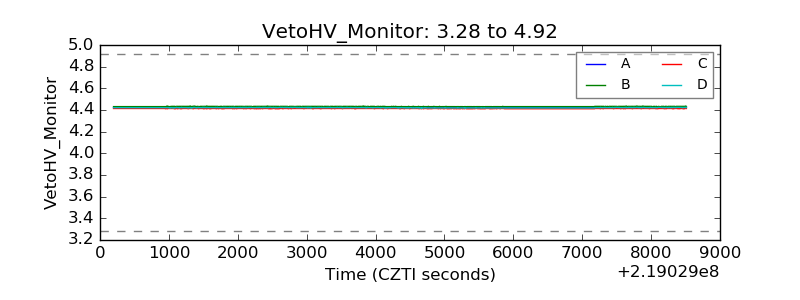 |
| Veto LLD | 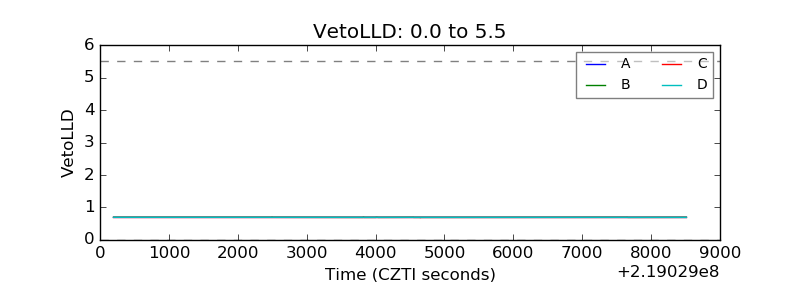 |
| Alpha Counter | 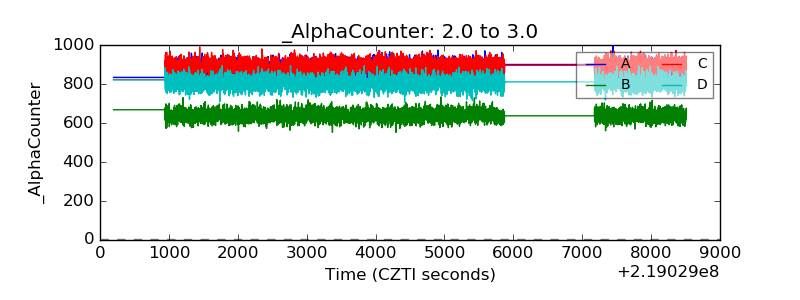 |
| _CPM_Rate | 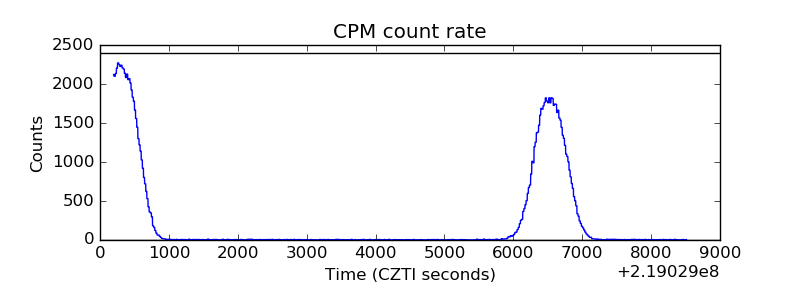 |
| CZT Counter | 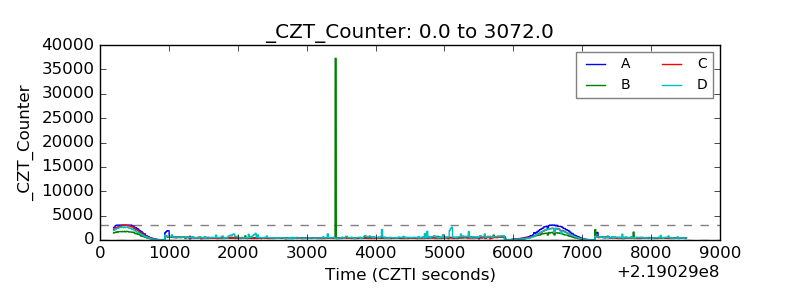 |
| +2.5 Volts monitor |  |
| +5 Volts monitor |  |
| _ROLL_ROT | 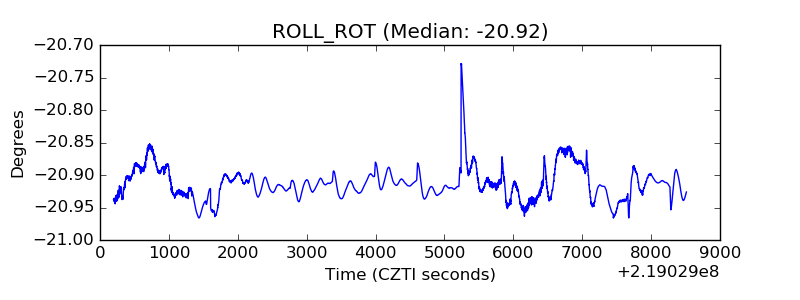 |
| _Roll_DEC | 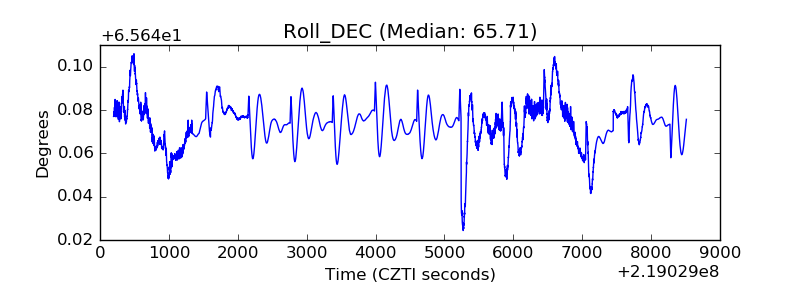 |
| _Roll_RA | 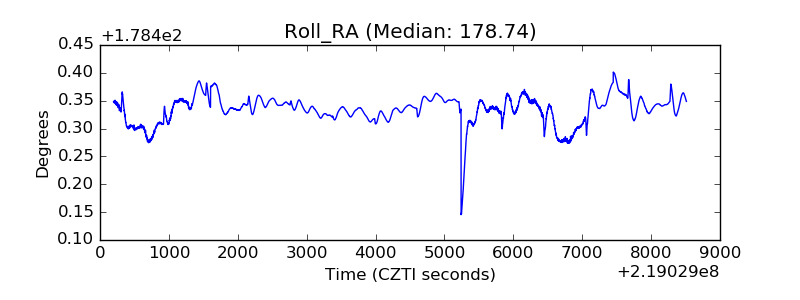 |
| Veto Counter | 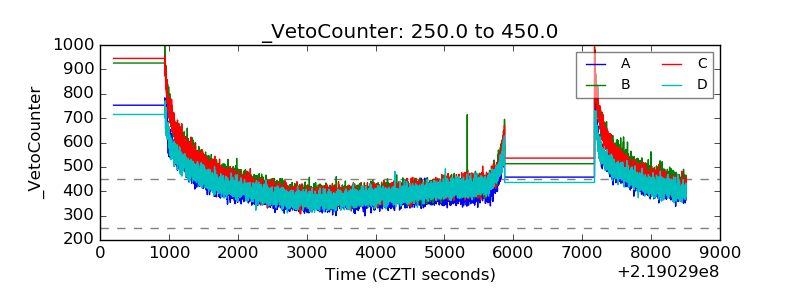 |