| Param | Original file | Final file |
|---|---|---|
| Filename | modeM0/AS1G06_134T11_9000000870_06500cztM0_level2.evt | modeM0/AS1G06_134T11_9000000870_06500cztM0_level2_quad_clean.evt |
| Size (bytes) | 733,789,440 | 168,747,840 |
| Size | 699.8 MB | 160.9 MB |
| Events in quadrant A | 5,254,085 | 1,089,950 |
| Events in quadrant B | 5,313,875 | 1,121,490 |
| Events in quadrant C | 5,098,127 | 1,078,043 |
| Events in quadrant D | 5,775,538 | 1,024,703 |
| Mode M0 | |||
|---|---|---|---|
| Quadrant | BADHDUFLAG | Total packets | Discarded packets |
| A | 0 | 23728 | 4 |
| B | 0 | 23749 | 3 |
| C | 0 | 23695 | 3 |
| D | 0 | 25557 | 3 |
| Mode M9 | |||
|---|---|---|---|
| Quadrant | BADHDUFLAG | Total packets | Discarded packets |
| A | 0 | 25 | 0 |
| B | 0 | 25 | 0 |
| C | 0 | 25 | 0 |
| D | 0 | 26 | 0 |
| Mode SS | |||
|---|---|---|---|
| Quadrant | BADHDUFLAG | Total packets | Discarded packets |
| A | 0 | 236 | 0 |
| B | 0 | 236 | 0 |
| C | 0 | 236 | 0 |
| D | 0 | 236 | 0 |
| Quadrant | Total seconds | Saturated seconds | Saturation percentage |
|---|---|---|---|
| A | 11511 | 108 | 0.938233% |
| B | 11511 | 85 | 0.738424% |
| C | 11511 | 32 | 0.277995% |
| D | 11511 | 105 | 0.912171% |
Noise dominated data is calculated using 1-second bins in cleaned event files. If a bin has >2000 counts, and if more than 50% of those come from <1% of pixels, then it is considered to be noise-dominated and hence unusable.
| Quadrant | # 1 sec bins | Bins with >0 counts | Bins with >2000 counts | High rate bins dominated by noise | Noise dominated (total time) | Noise dominated (detector-on time) | Marked lightcurve |
|---|---|---|---|---|---|---|---|
| A | 13931 | 11513 | 0 | 0 | 0.00% | 0.00% | 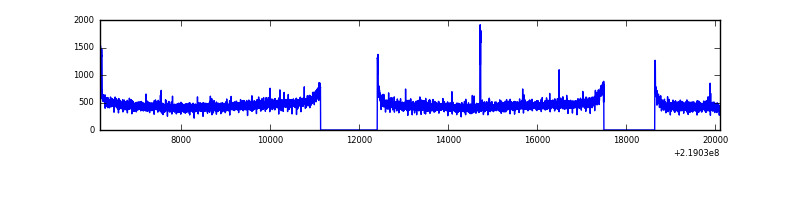 |
| B | 13931 | 11513 | 1 | 1 | 0.01% | 0.01% | 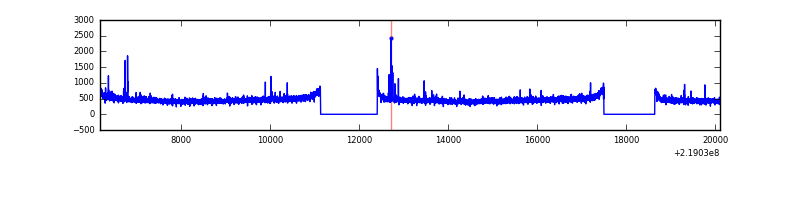 |
| C | 13931 | 11513 | 0 | 0 | 0.00% | 0.00% | 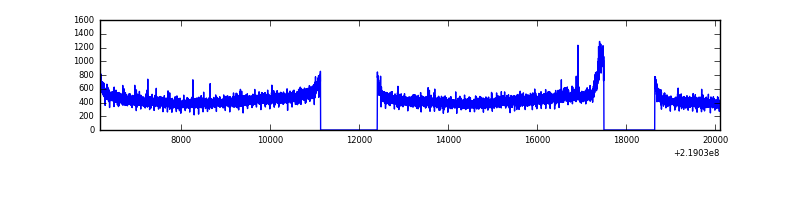 |
| D | 13931 | 11513 | 48 | 48 | 0.34% | 0.42% | 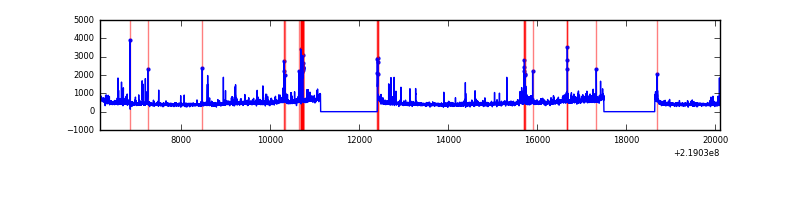 |
Top three noisy pixels from each quadrant. If the there are fewer than three noisy pixels in the level2.evt file, extra rows are filled as -1
| Pixel properties | Quadrant properties | ||||||
|---|---|---|---|---|---|---|---|
| Quadrant | DetID | PixID | Counts | Sigma | Mean | Median | Sigma |
| A | 15 | 236 | 69001 | 252.18 | 1343 | 1316 | 268.4 |
| A | 0 | 226 | 13198 | 44.27 | 1343 | 1316 | 268.4 |
| A | 8 | 15 | 12396 | 41.28 | 1343 | 1316 | 268.4 |
| B | 0 | 219 | 46079 | 178.21 | 1351 | 1322 | 251.1 |
| B | 12 | 111 | 25134 | 94.81 | 1351 | 1322 | 251.1 |
| B | 11 | 111 | 19693 | 73.15 | 1351 | 1322 | 251.1 |
| C | 1 | 16 | 67336 | 227.17 | 1282 | 1286 | 290.8 |
| C | 14 | 67 | 19345 | 62.11 | 1282 | 1286 | 290.8 |
| C | 13 | 61 | 10258 | 30.86 | 1282 | 1286 | 290.8 |
| D | 8 | 195 | 286024 | 926.09 | 1280 | 1240 | 307.5 |
| D | 2 | 152 | 186828 | 603.51 | 1280 | 1240 | 307.5 |
| D | 5 | 97 | 113581 | 365.32 | 1280 | 1240 | 307.5 |
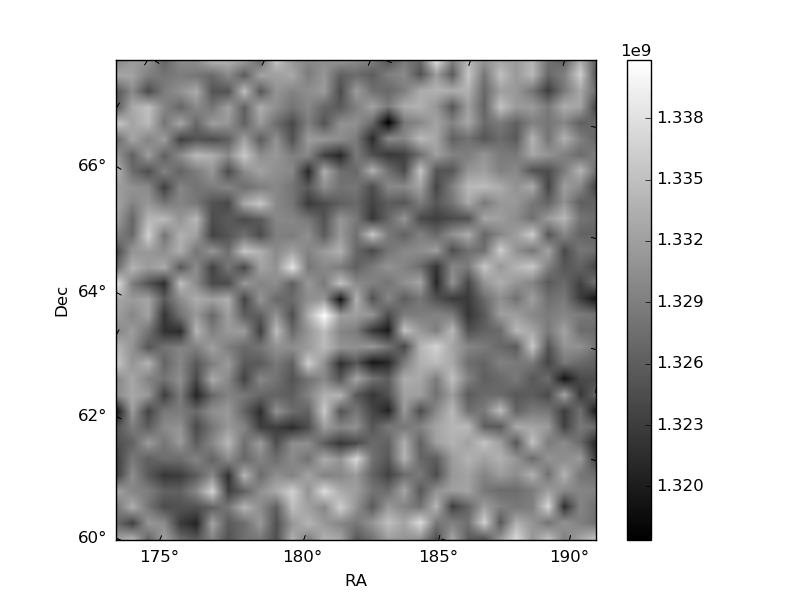
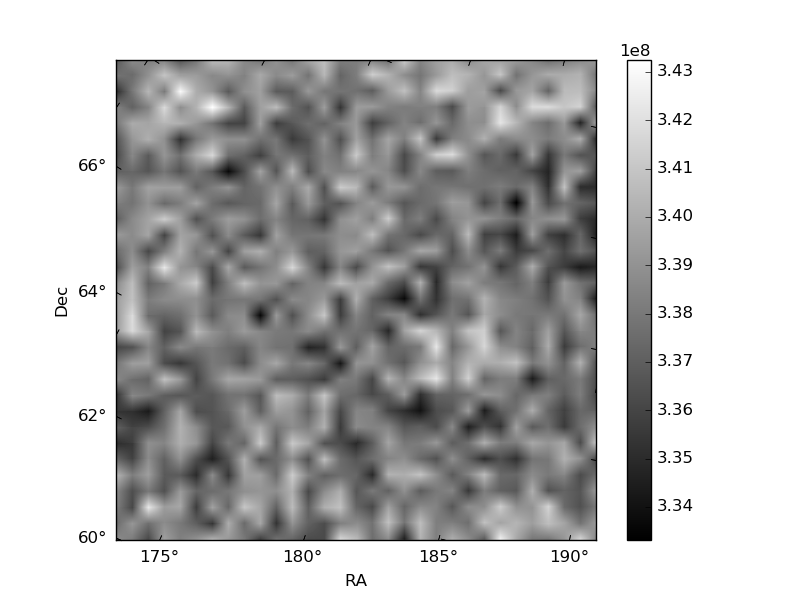
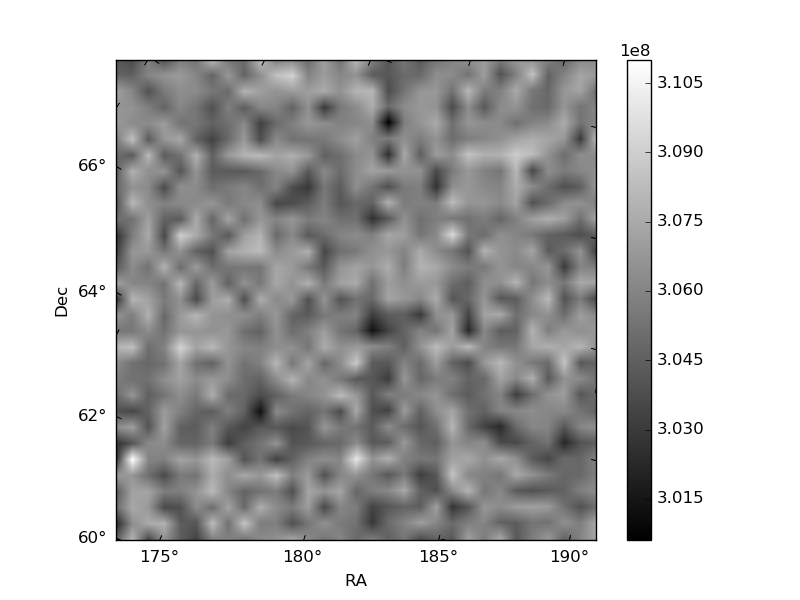
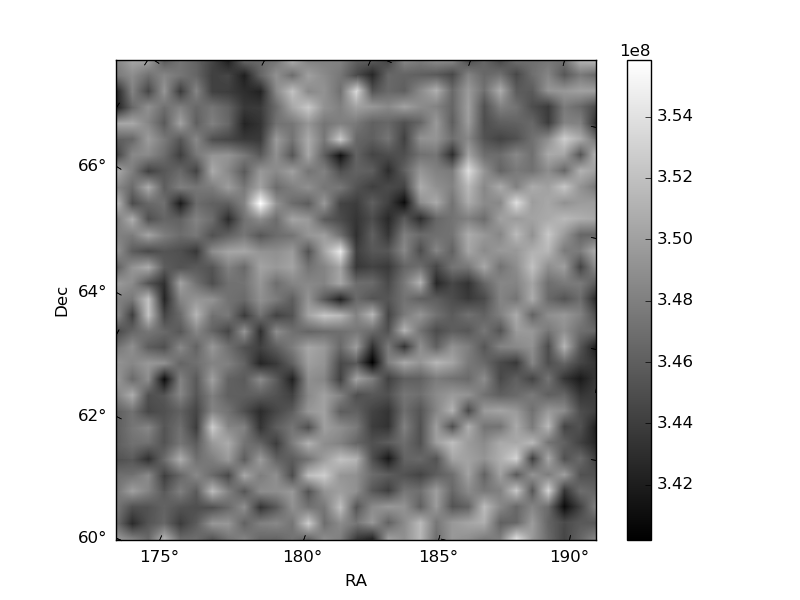
Histogram calculated using DETX and DETY for each event in the final _common_clean file
| Quadrant A | 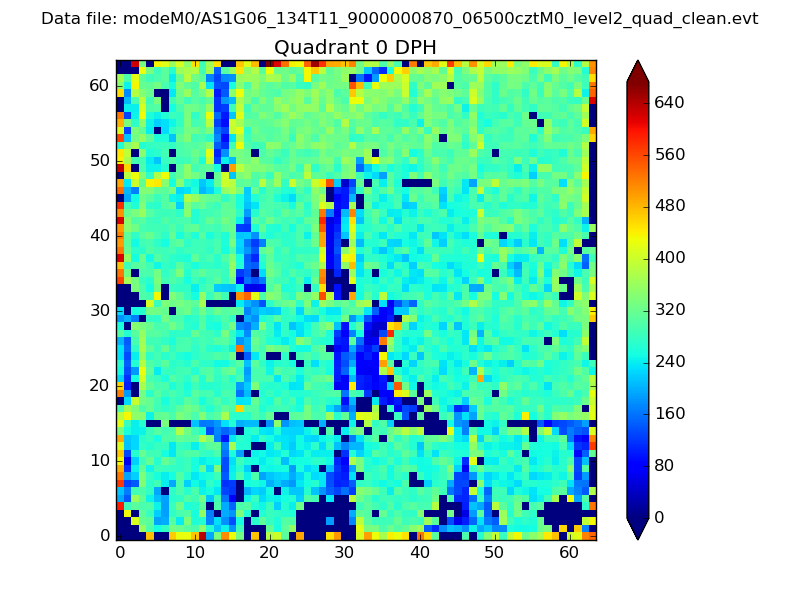 |
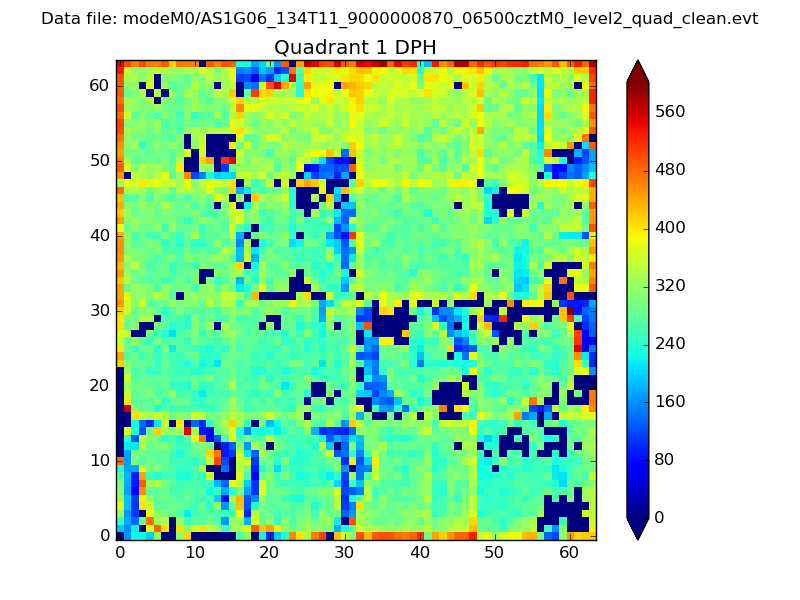 |
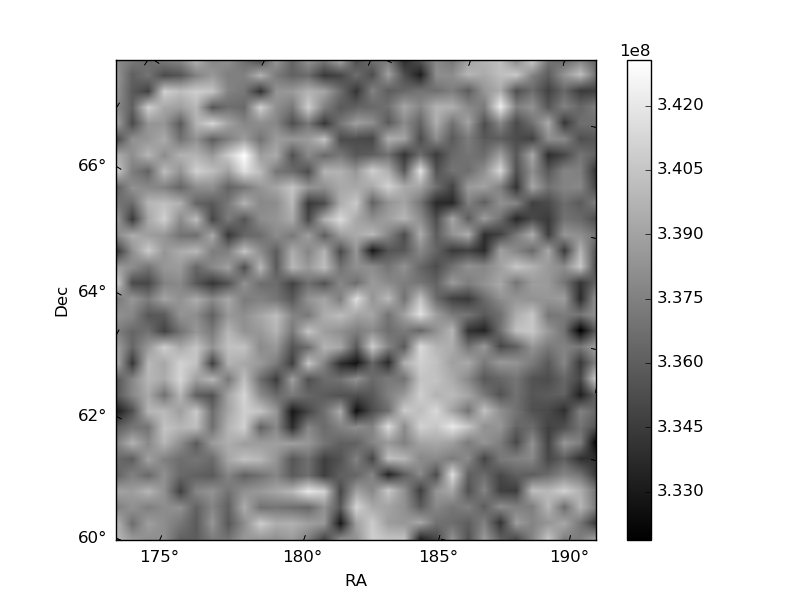
Quadrant B |
|---|---|---|---|
| Quadrant D | 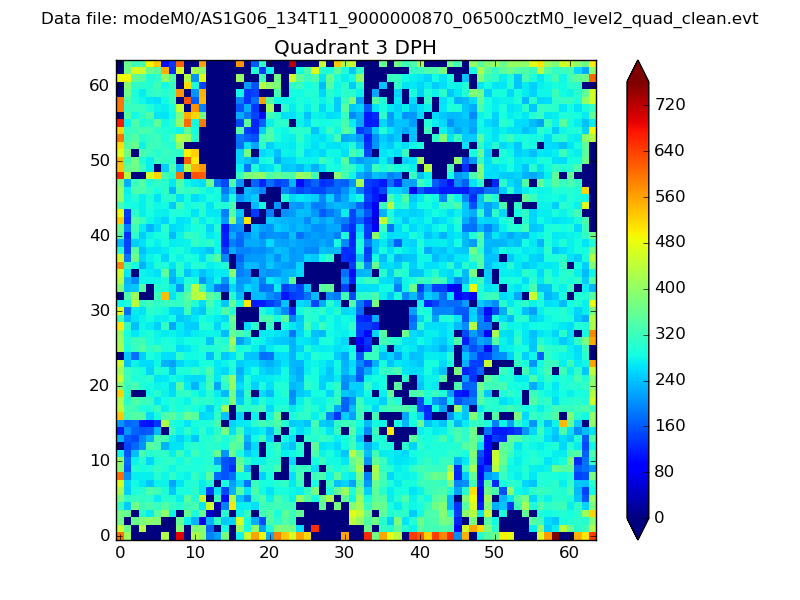 |
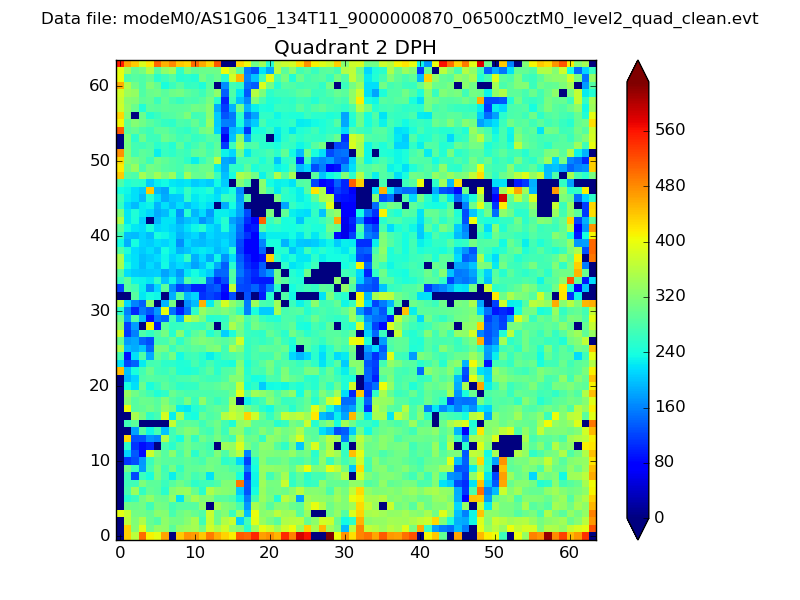 |
Quadrant C |
| Plot type | Count rate plots | Images |
|---|---|---|
| Comparison with Poisson distribution Blue bars denote a histogram of data divided into 1 sec bins. Red curve is a Poisson curve with rate = median count rate of data. |
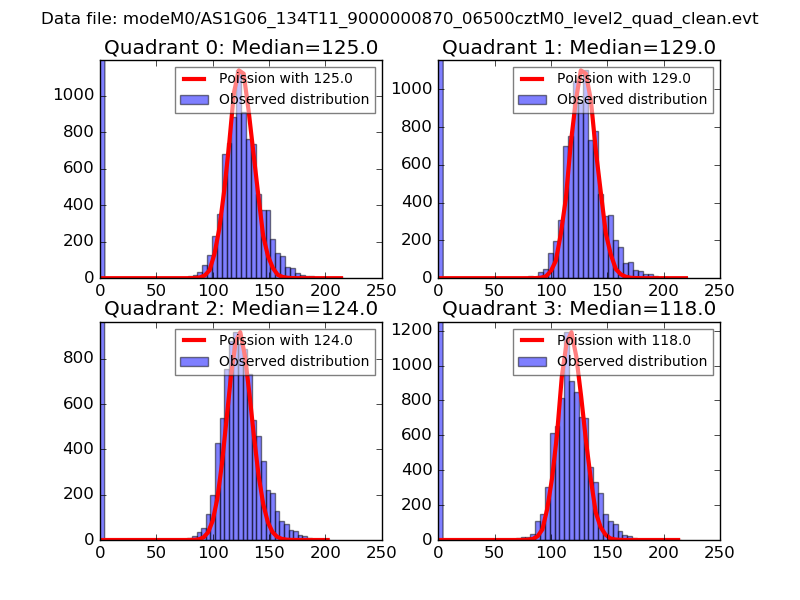 |
 |
| Quadrant-wise count rates Data is divided into 100 sec bins |
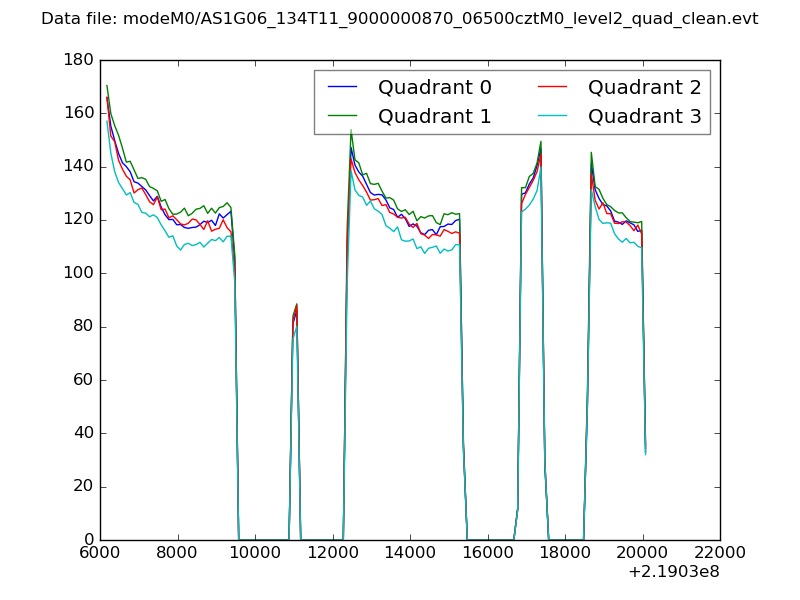 |
|
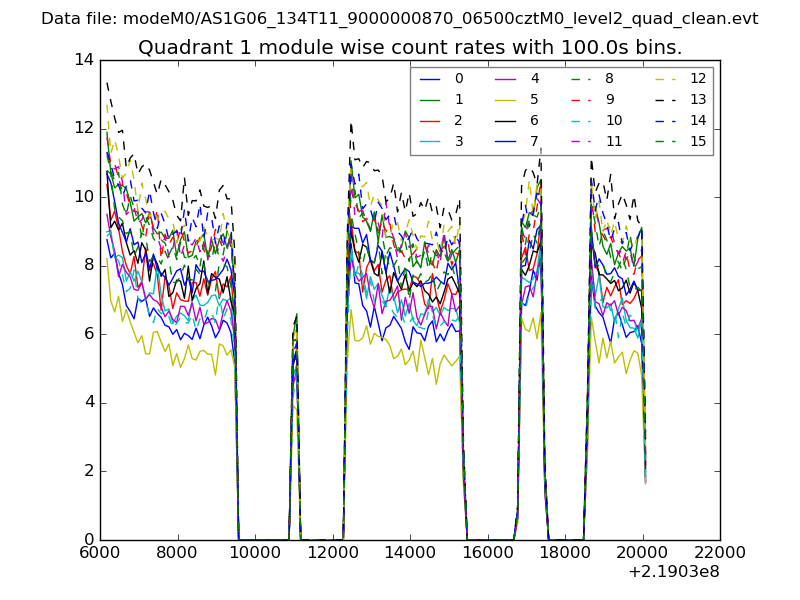
| Module-wise count rates for Quadrant A Data is divided into 100 sec bins |
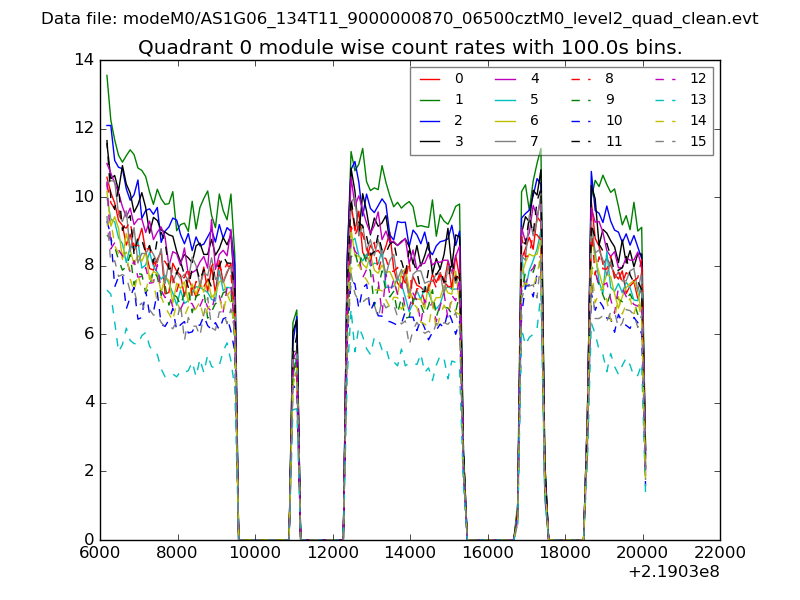 |
 |
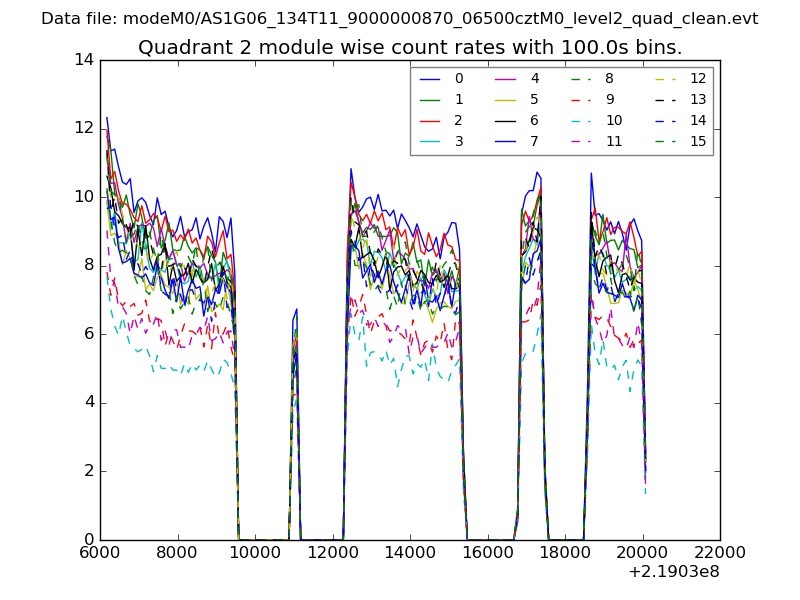
| Module-wise count rates for Quadrant B Data is divided into 100 sec bins |
 |
 |
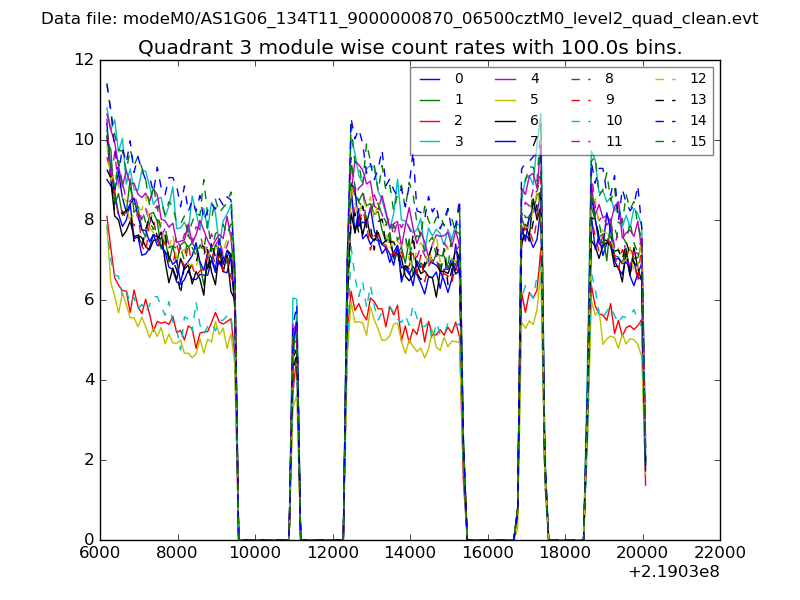
| Module-wise count rates for Quadrant C Data is divided into 100 sec bins |
 |
 |
| Module-wise count rates for Quadrant D Data is divided into 100 sec bins |
 |
 |
| Parameter | Plot |
|---|---|
| CZT HV Monitor | 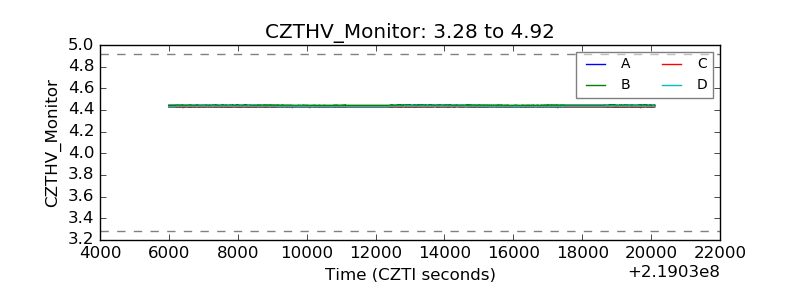 |
| D_VDD | 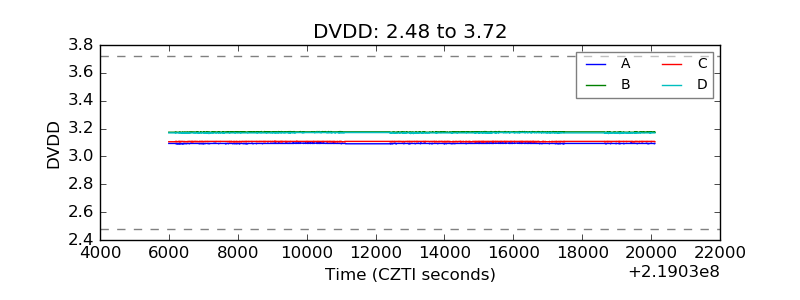 |
| Temperature 1 | 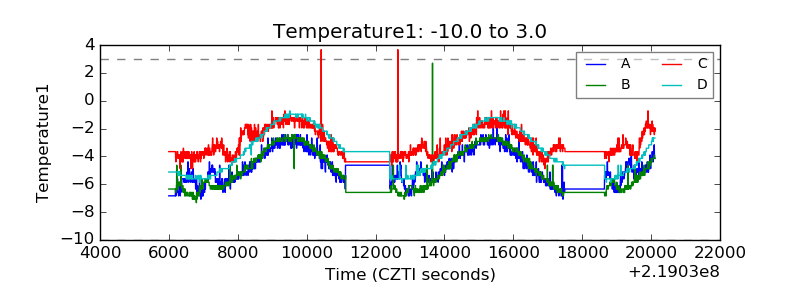 |
| Veto HV Monitor | 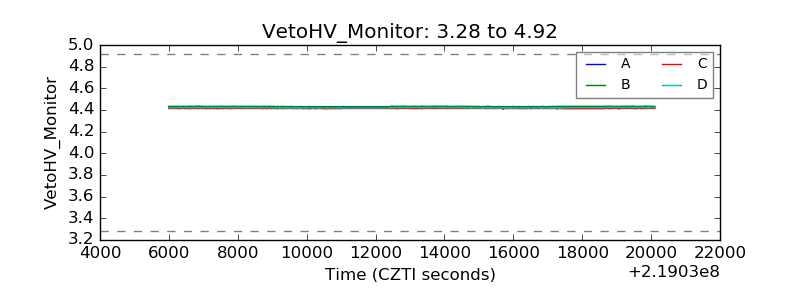 |
| Veto LLD | 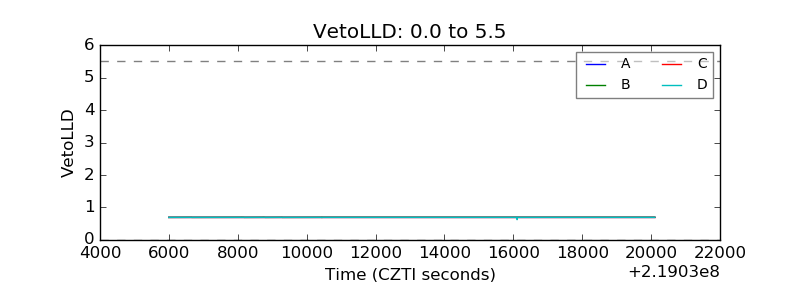 |
| Alpha Counter | 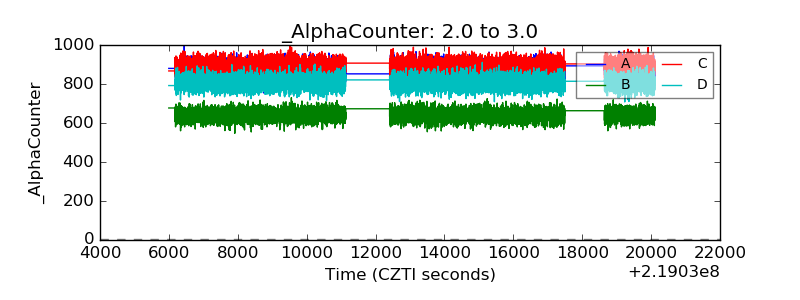 |
| _CPM_Rate | 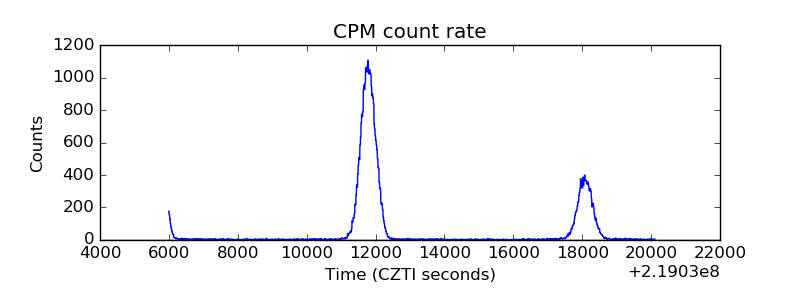 |
| CZT Counter | 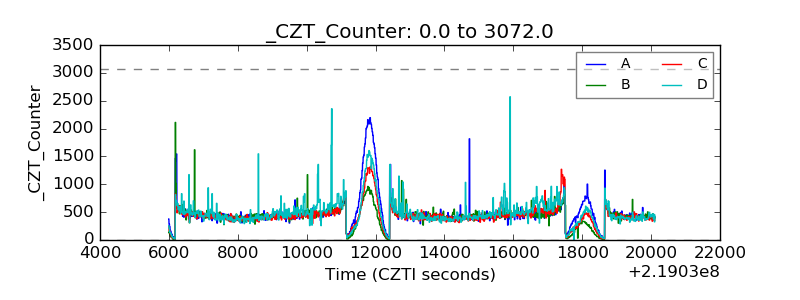 |
| +2.5 Volts monitor |  |
| +5 Volts monitor |  |
| _ROLL_ROT | 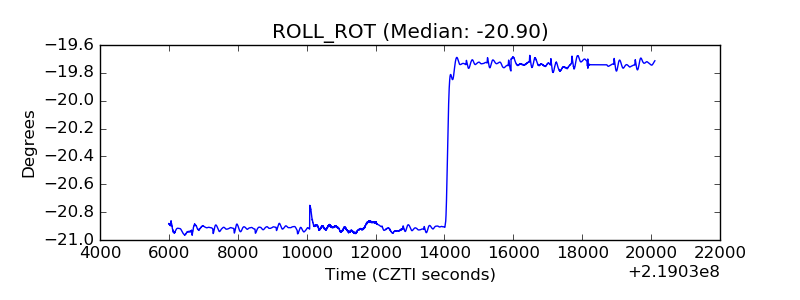 |
| _Roll_DEC | 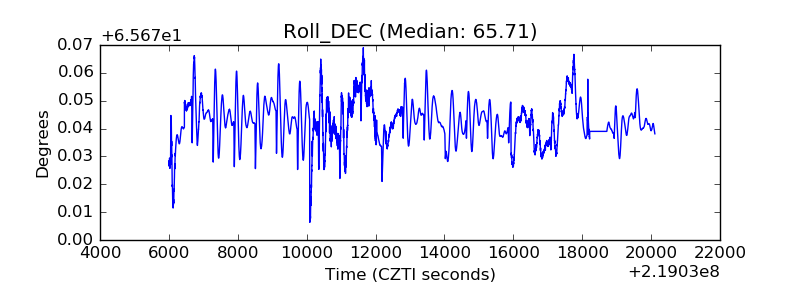 |
| _Roll_RA | 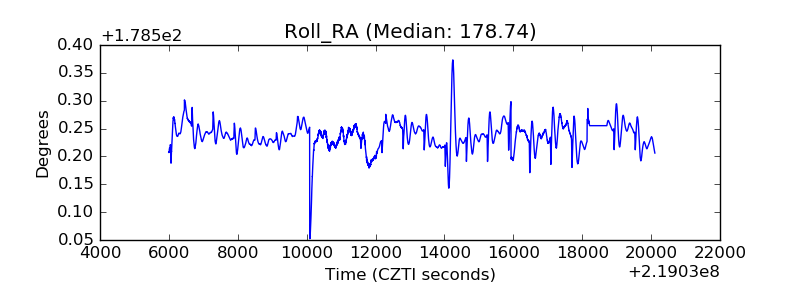 |
| Veto Counter | 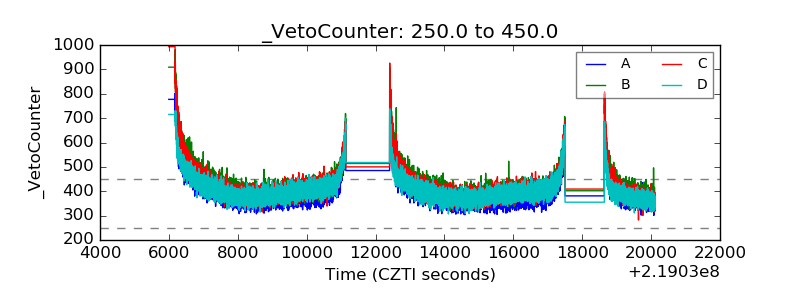 |