| Param | Original file | Final file |
|---|---|---|
| Filename | modeM0/AS1G06_134T11_9000000870_06502cztM0_level2.evt | modeM0/AS1G06_134T11_9000000870_06502cztM0_level2_quad_clean.evt |
| Size (bytes) | 250,643,520 | 47,900,160 |
| Size | 239.0 MB | 45.7 MB |
| Events in quadrant A | 1,741,786 | 293,824 |
| Events in quadrant B | 1,836,527 | 301,926 |
| Events in quadrant C | 1,651,097 | 293,207 |
| Events in quadrant D | 2,085,976 | 277,243 |
| Mode M0 | |||
|---|---|---|---|
| Quadrant | BADHDUFLAG | Total packets | Discarded packets |
| A | 0 | 8194 | 1 |
| B | 0 | 8299 | 1 |
| C | 0 | 8083 | 1 |
| D | 0 | 9053 | 1 |
| Mode SS | |||
|---|---|---|---|
| Quadrant | BADHDUFLAG | Total packets | Discarded packets |
| A | 0 | 82 | 0 |
| B | 0 | 82 | 0 |
| C | 0 | 82 | 0 |
| D | 0 | 82 | 0 |
| Quadrant | Total seconds | Saturated seconds | Saturation percentage |
|---|---|---|---|
| A | 4020 | 41 | 1.019900% |
| B | 4020 | 10 | 0.248756% |
| C | 4020 | 1 | 0.024876% |
| D | 4020 | 44 | 1.094527% |
Noise dominated data is calculated using 1-second bins in cleaned event files. If a bin has >2000 counts, and if more than 50% of those come from <1% of pixels, then it is considered to be noise-dominated and hence unusable.
| Quadrant | # 1 sec bins | Bins with >0 counts | Bins with >2000 counts | High rate bins dominated by noise | Noise dominated (total time) | Noise dominated (detector-on time) | Marked lightcurve |
|---|---|---|---|---|---|---|---|
| A | 4020 | 4020 | 0 | 0 | 0.00% | 0.00% | 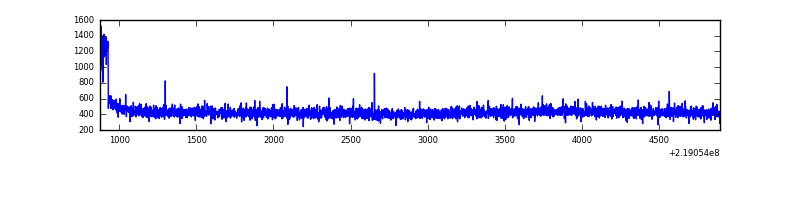 |
| B | 4020 | 4020 | 0 | 0 | 0.00% | 0.00% | 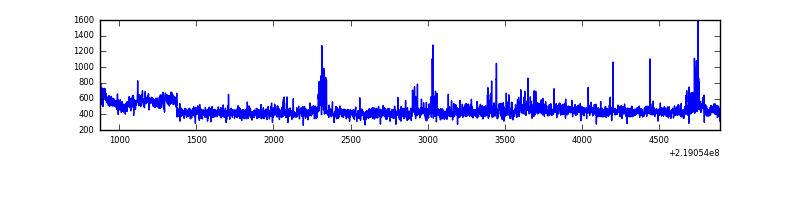 |
| C | 4020 | 4020 | 0 | 0 | 0.00% | 0.00% | 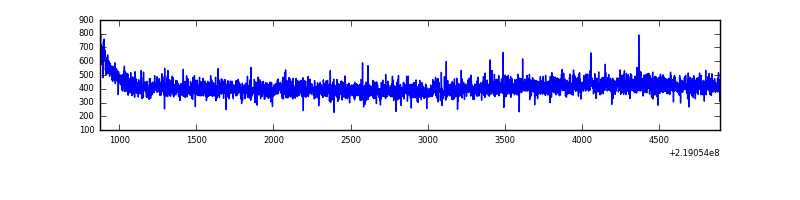 |
| D | 4020 | 4020 | 25 | 25 | 0.62% | 0.62% | 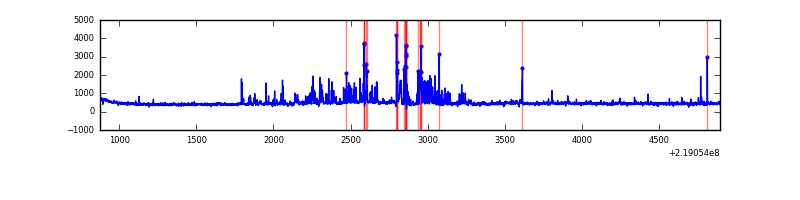 |
Top three noisy pixels from each quadrant. If the there are fewer than three noisy pixels in the level2.evt file, extra rows are filled as -1
| Pixel properties | Quadrant properties | ||||||
|---|---|---|---|---|---|---|---|
| Quadrant | DetID | PixID | Counts | Sigma | Mean | Median | Sigma |
| A | 15 | 236 | 37438 | 407.88 | 440 | 429 | 90.7 |
| A | 8 | 15 | 9118 | 95.76 | 440 | 429 | 90.7 |
| A | 0 | 226 | 4253 | 42.14 | 440 | 429 | 90.7 |
| B | 4 | 81 | 61346 | 719.27 | 440 | 429 | 84.7 |
| B | 0 | 214 | 13940 | 159.53 | 440 | 429 | 84.7 |
| B | 4 | 48 | 13852 | 158.49 | 440 | 429 | 84.7 |
| C | 8 | 222 | 3625 | 32.84 | 421 | 423 | 97.5 |
| C | 13 | 61 | 3267 | 29.17 | 421 | 423 | 97.5 |
| C | 1 | 16 | 1426 | 10.29 | 421 | 423 | 97.5 |
| D | 2 | 152 | 312449 | 2988.4 | 424 | 410 | 104.4 |
| D | 13 | 137 | 51114 | 485.59 | 424 | 410 | 104.4 |
| D | 11 | 241 | 31683 | 299.5 | 424 | 410 | 104.4 |
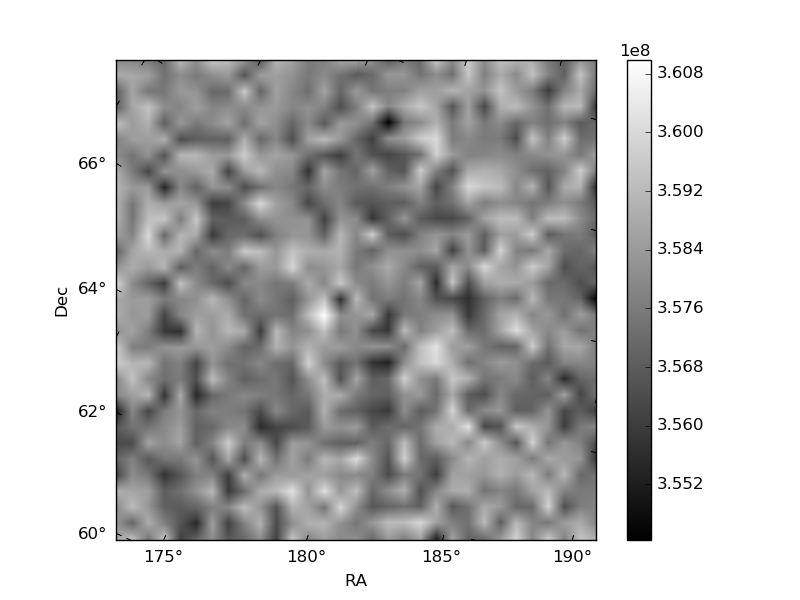
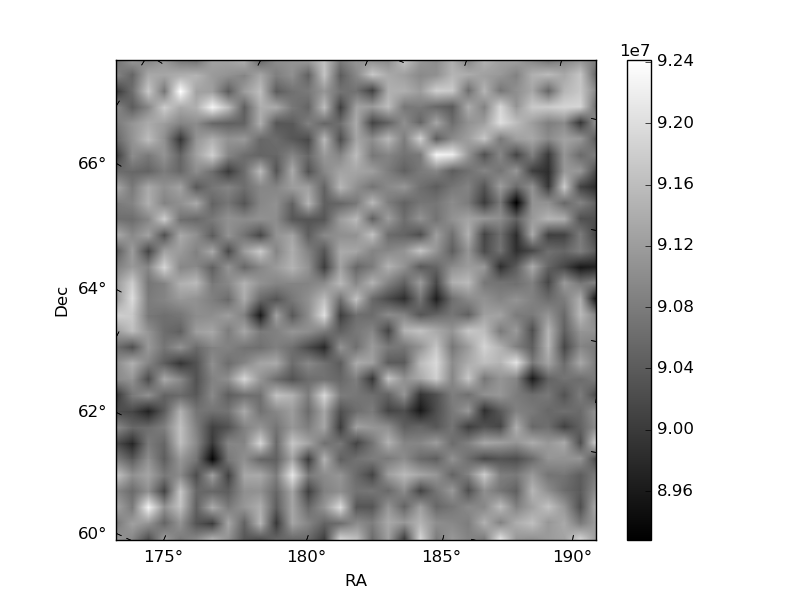
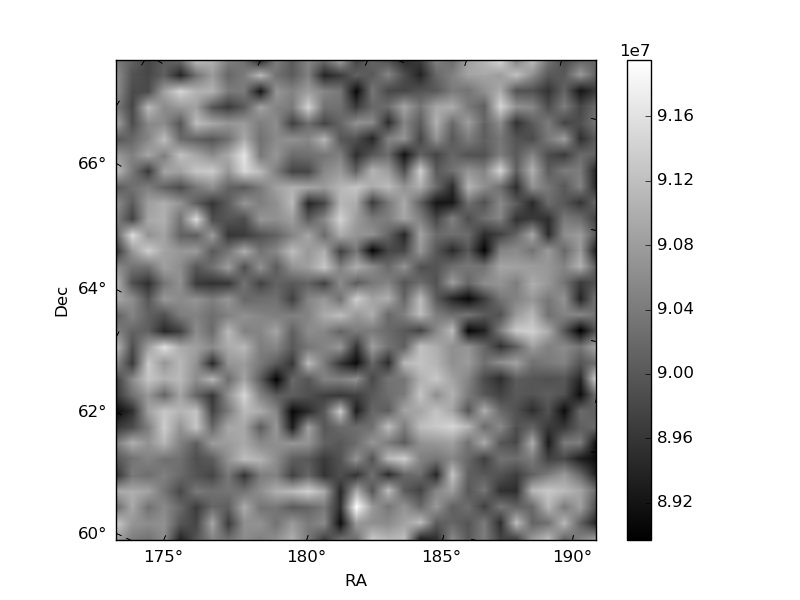
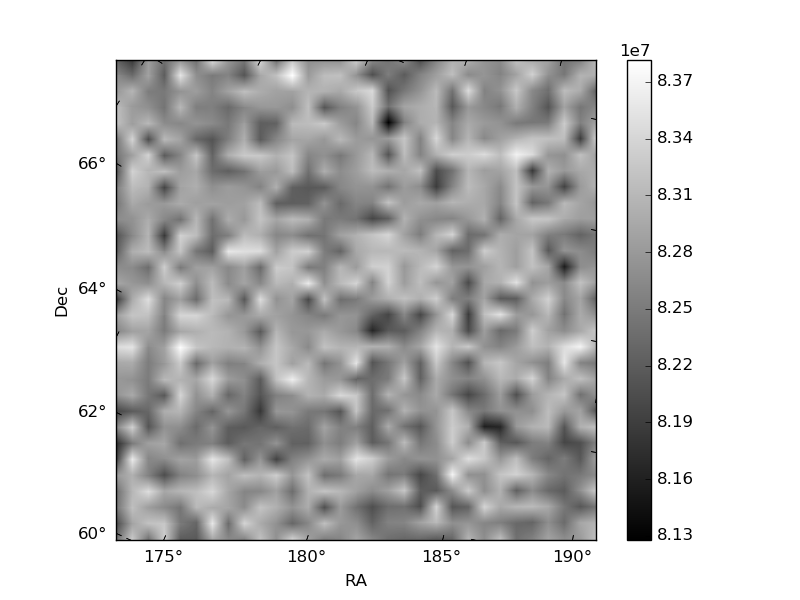
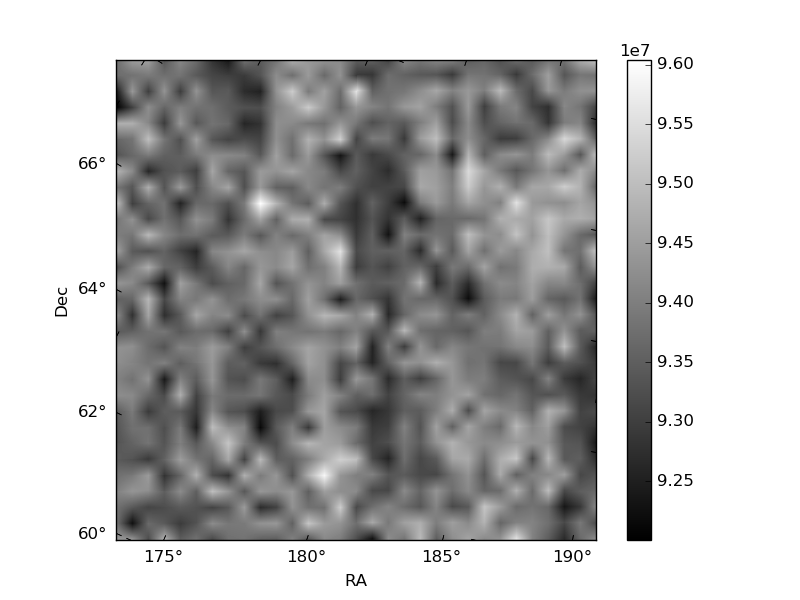
Histogram calculated using DETX and DETY for each event in the final _common_clean file
| Quadrant A | 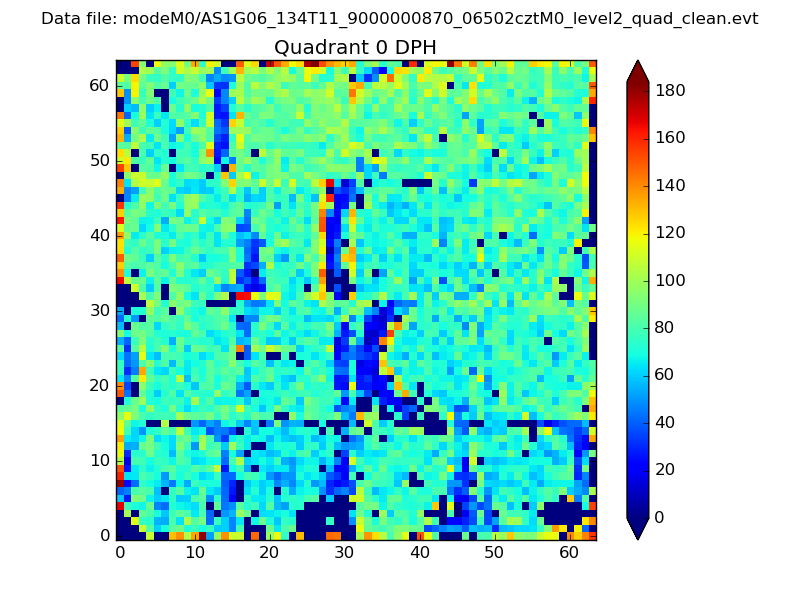 |
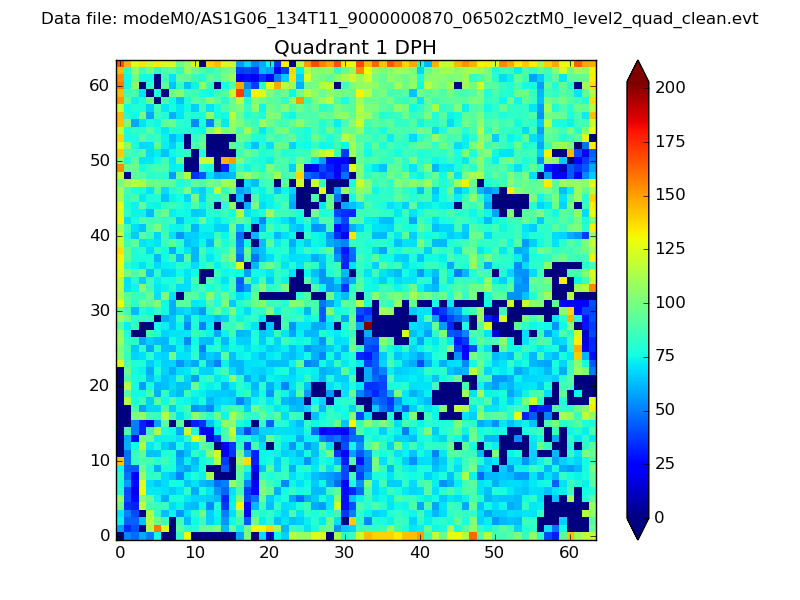 |
Quadrant B |
|---|---|---|---|
| Quadrant D | 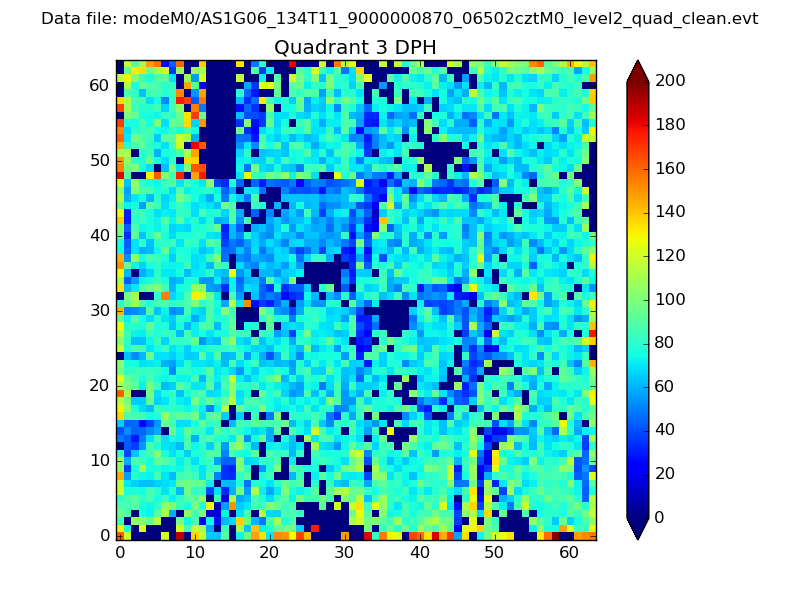 |
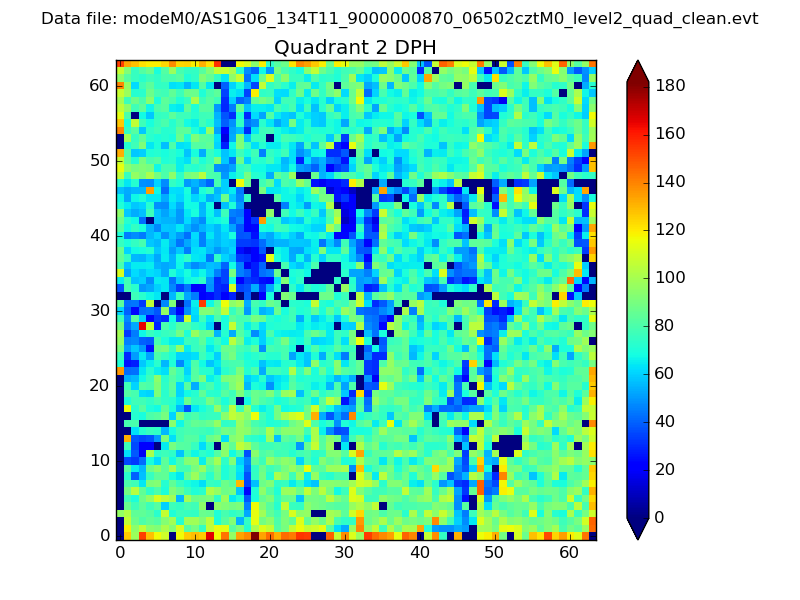 |
Quadrant C |
| Plot type | Count rate plots | Images |
|---|---|---|
| Comparison with Poisson distribution Blue bars denote a histogram of data divided into 1 sec bins. Red curve is a Poisson curve with rate = median count rate of data. |
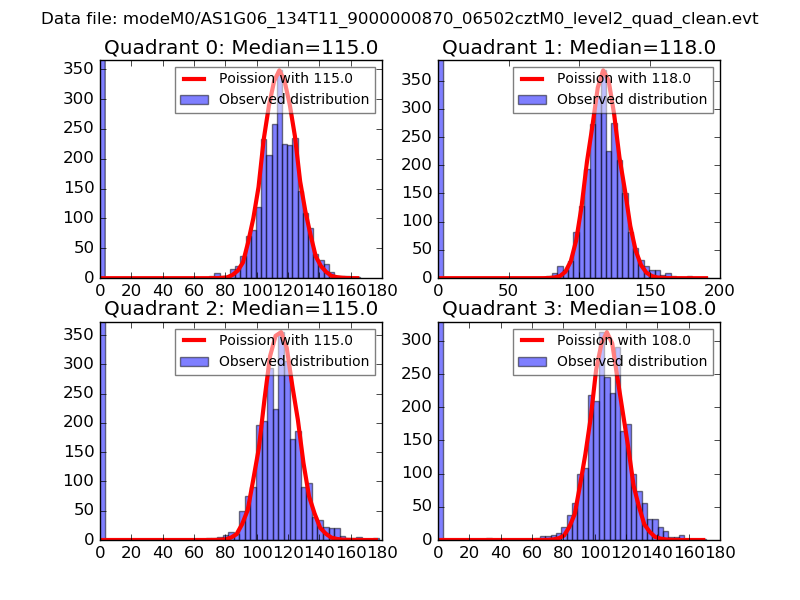 |
 |
| Quadrant-wise count rates Data is divided into 100 sec bins |
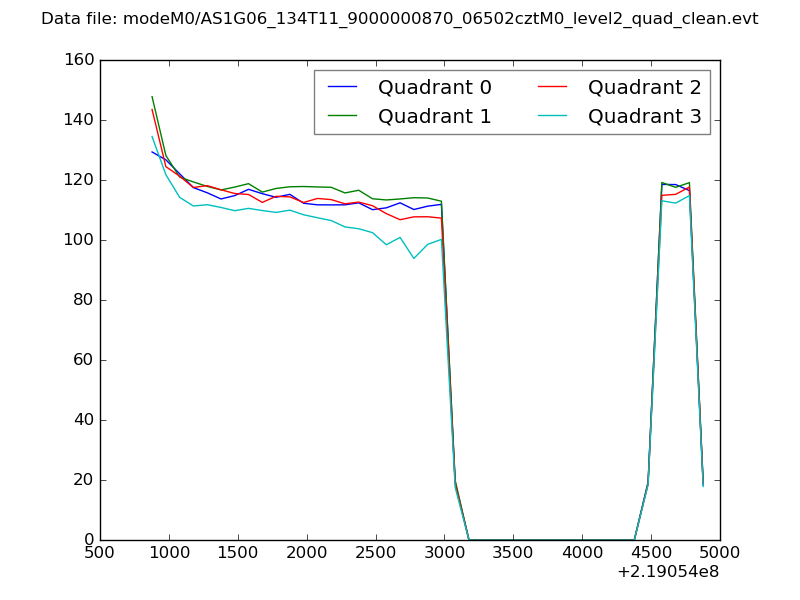 |
|
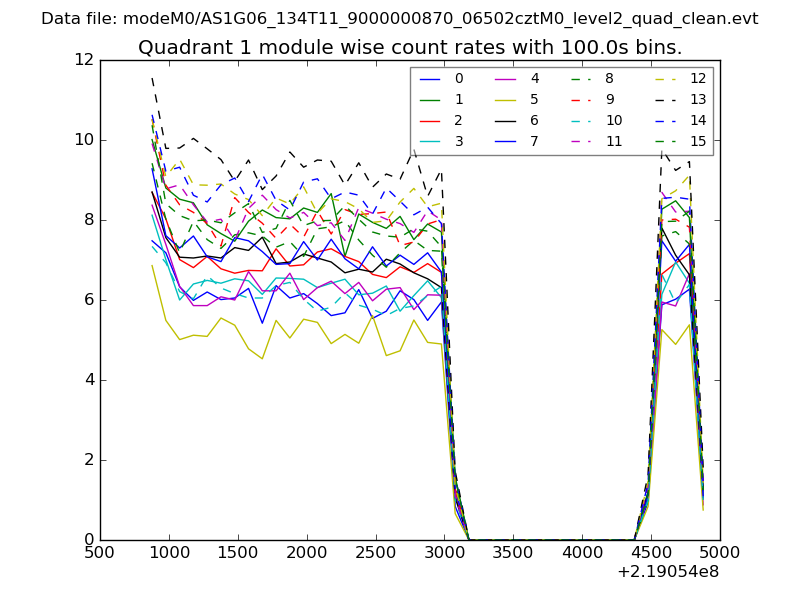
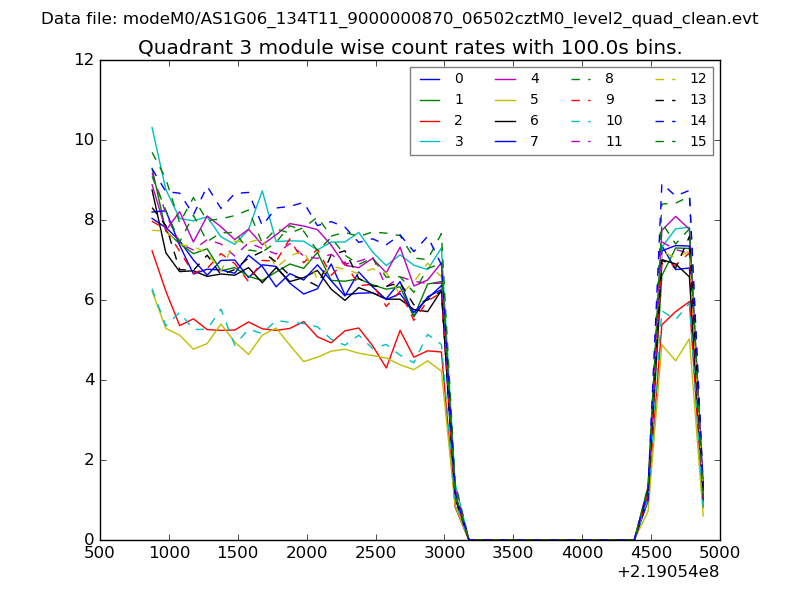
| Module-wise count rates for Quadrant A Data is divided into 100 sec bins |
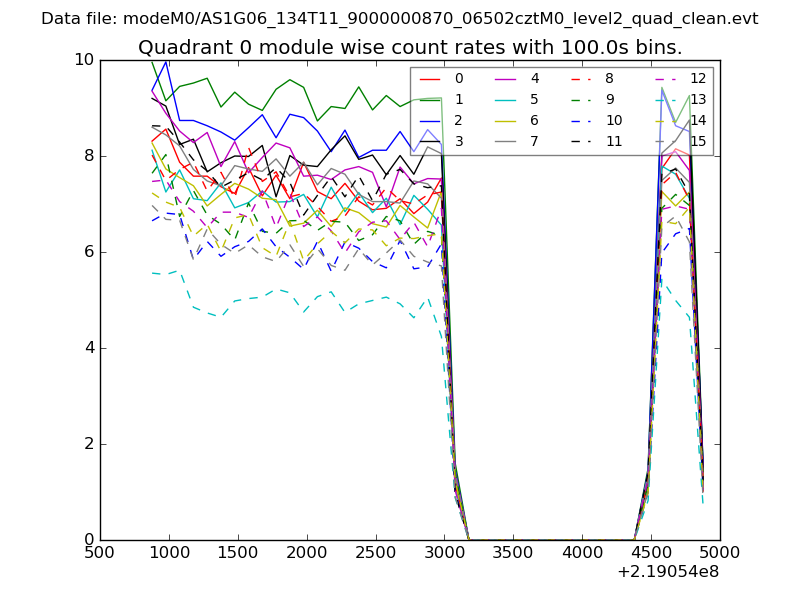 |
 |
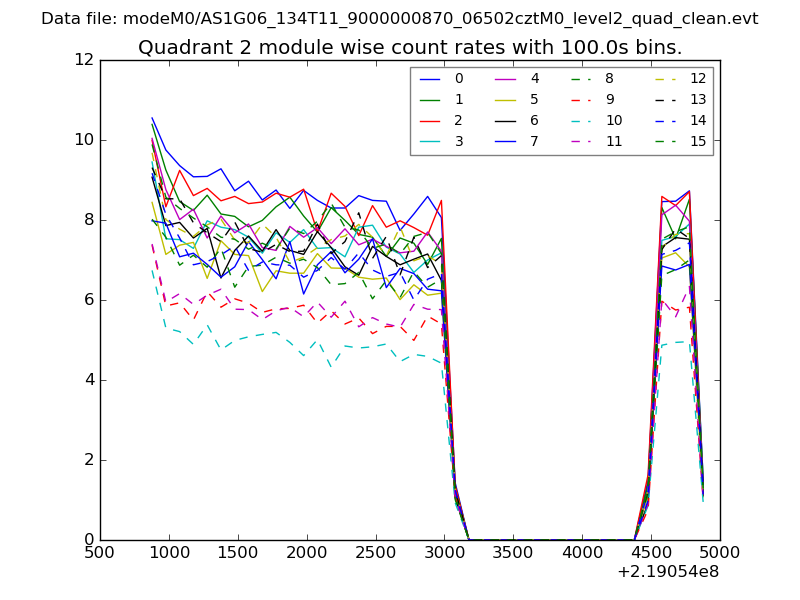
| Module-wise count rates for Quadrant B Data is divided into 100 sec bins |
 |
 |
| Module-wise count rates for Quadrant C Data is divided into 100 sec bins |
 |
 |
| Module-wise count rates for Quadrant D Data is divided into 100 sec bins |
 |
 |
| Parameter | Plot |
|---|---|
| CZT HV Monitor | 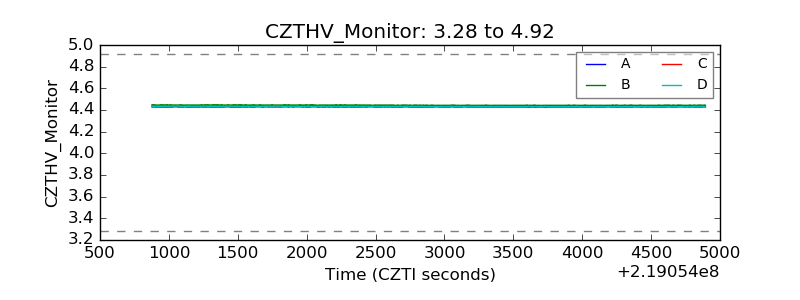 |
| D_VDD | 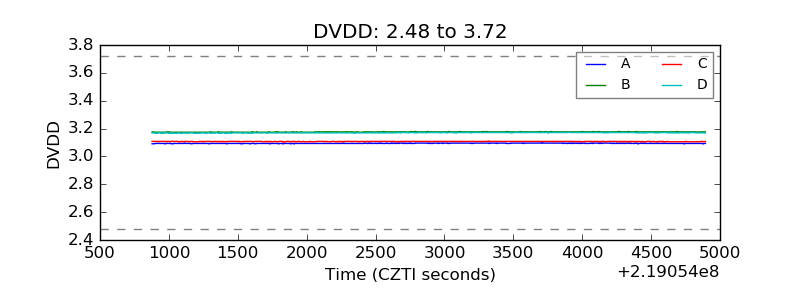 |
| Temperature 1 | 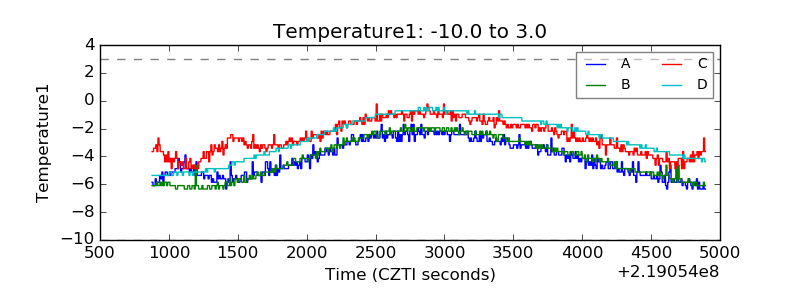 |
| Veto HV Monitor |  |
| Veto LLD | 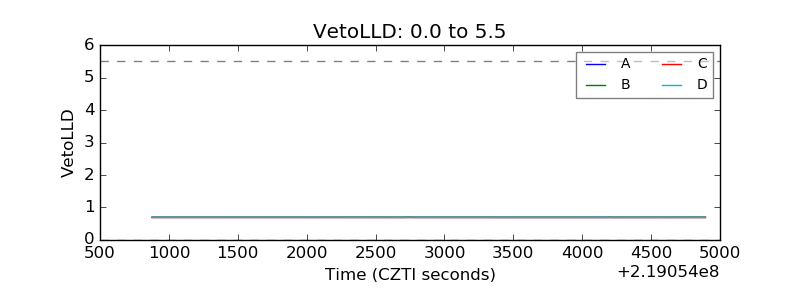 |
| Alpha Counter | 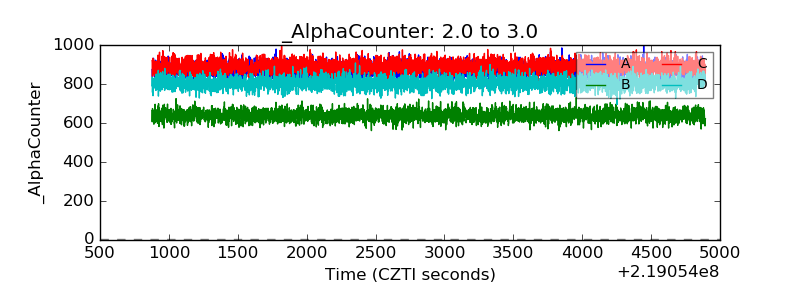 |
| _CPM_Rate | 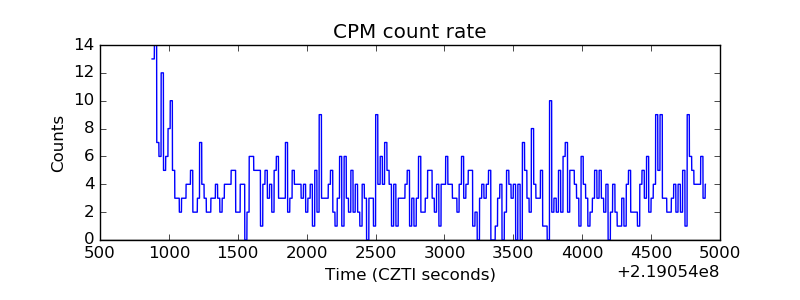 |
| CZT Counter | 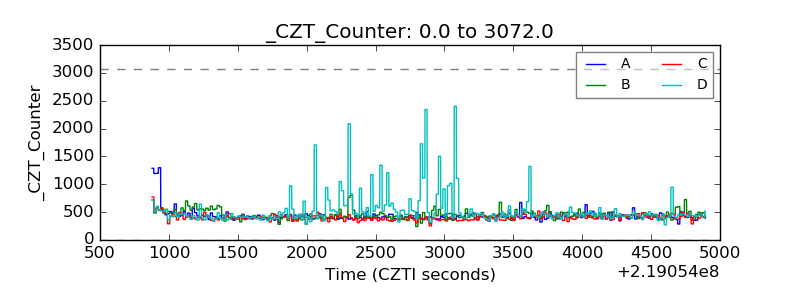 |
| +2.5 Volts monitor | 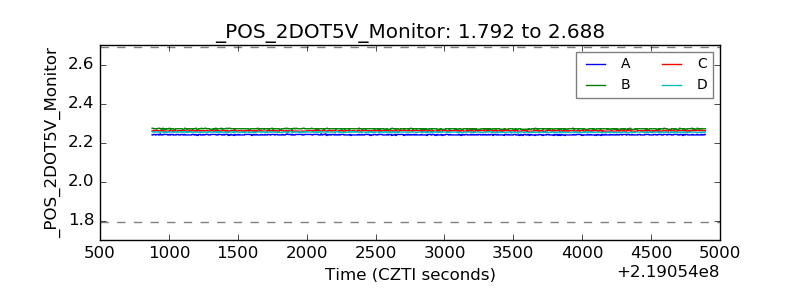 |
| +5 Volts monitor |  |
| _ROLL_ROT | 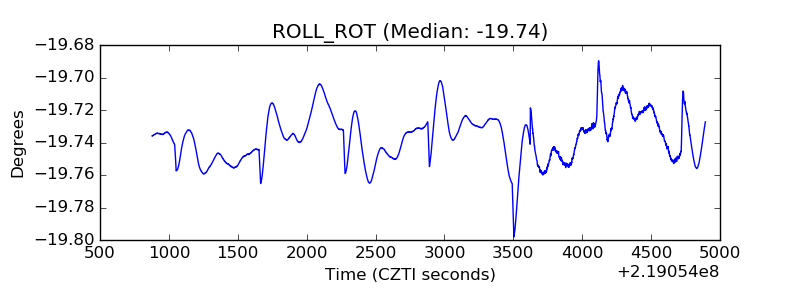 |
| _Roll_DEC | 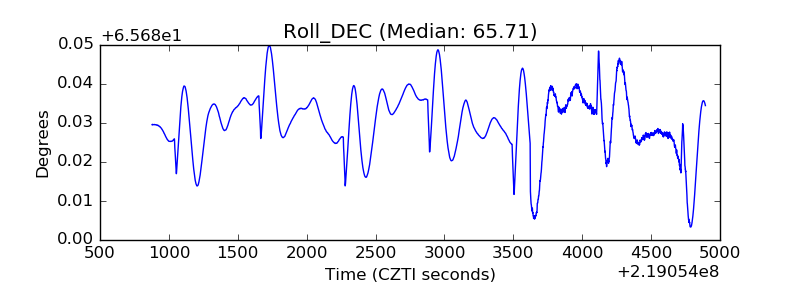 |
| _Roll_RA | 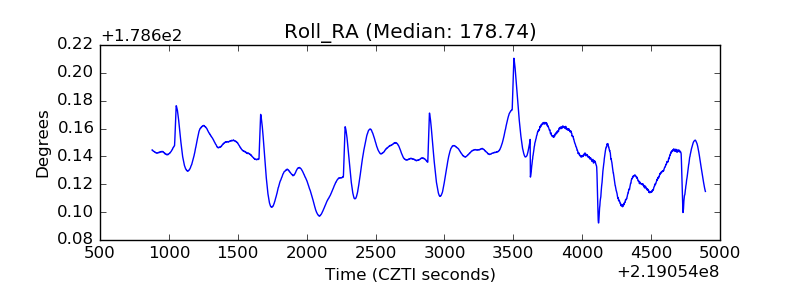 |
| Veto Counter | 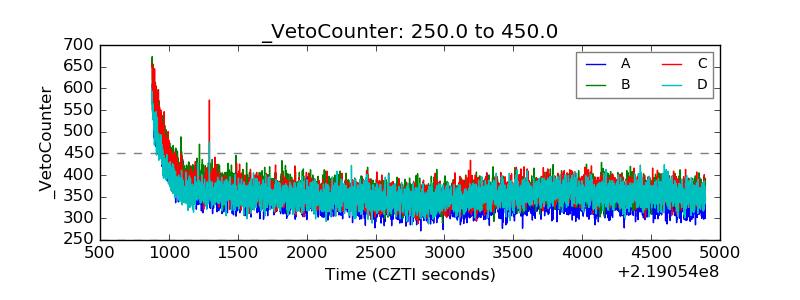 |