| Param | Original file | Final file |
|---|---|---|
| Filename | modeM0/AS1G06_164T01_9000000866cztM0_level2.fits | modeM0/AS1G06_164T01_9000000866cztM0_level2_quad_clean.evt |
| Size (bytes) | 253,008,000 | 308,067,840 |
| Size | 241.3 MB | 293.8 MB |
| Events in quadrant A | 1,495,430 | 1,940,423 |
| Events in quadrant B | 1,444,678 | 1,883,720 |
| Events in quadrant C | 1,470,678 | 1,814,891 |
| Events in quadrant D | 1,274,350 | 1,714,756 |
| Mode M0 | |||
|---|---|---|---|
| Quadrant | BADHDUFLAG | Total packets | Discarded packets |
| A | 0 | 60222 | 0 |
| B | 0 | 60943 | 0 |
| C | 0 | 58730 | 0 |
| D | 0 | 64080 | 0 |
| Mode SS | |||
|---|---|---|---|
| Quadrant | BADHDUFLAG | Total packets | Discarded packets |
| A | 0 | 582 | 0 |
| B | 0 | 582 | 0 |
| C | 0 | 582 | 0 |
| D | 0 | 582 | 0 |
| Mode M9 | |||
|---|---|---|---|
| Quadrant | BADHDUFLAG | Total packets | Discarded packets |
| A | 0 | 16 | 0 |
| B | 0 | 16 | 0 |
| C | 0 | 16 | 0 |
| D | 0 | 16 | 0 |
| Quadrant | Total seconds | Saturated seconds | Saturation percentage |
|---|---|---|---|
| A | 28758 | 769 | 2.674039% |
| B | 28758 | 813 | 2.827039% |
| C | 28758 | 505 | 1.756033% |
| D | 28758 | 727 | 2.527992% |
Noise dominated data is calculated using 1-second bins in cleaned event files. If a bin has >2000 counts, and if more than 50% of those come from <1% of pixels, then it is considered to be noise-dominated and hence unusable.
| Quadrant | # 1 sec bins | Bins with >0 counts | Bins with >2000 counts | High rate bins dominated by noise | Noise dominated (total time) | Noise dominated (detector-on time) | Marked lightcurve |
|---|---|---|---|---|---|---|---|
| A | 30228 | 28759 | 0 | 0 | 0.00% | 0.00% |  |
| B | 30228 | 28755 | 0 | 0 | 0.00% | 0.00% |  |
| C | 30228 | 28759 | 0 | 0 | 0.00% | 0.00% |  |
| D | 30228 | 28757 | 0 | 0 | 0.00% | 0.00% | 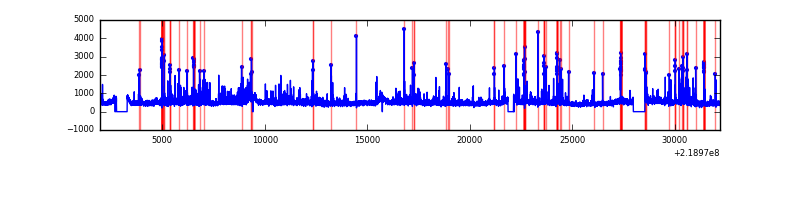 |
Top three noisy pixels from each quadrant. If the there are fewer than three noisy pixels in the level2.evt file, extra rows are filled as -1
| Pixel properties | Quadrant properties | ||||||
|---|---|---|---|---|---|---|---|
| Quadrant | DetID | PixID | Counts | Sigma | Mean | Median | Sigma |
| A | 0 | 29 | 1524 | 11.59 | 388 | 363 | 100.2 |
| A | 14 | 188 | 1474 | 11.09 | 388 | 363 | 100.2 |
| A | 14 | 204 | 1312 | 9.47 | 388 | 363 | 100.2 |
| B | 2 | 9 | 1241 | 11.61 | 380 | 361 | 75.8 |
| B | 14 | 254 | 1000 | 8.43 | 380 | 361 | 75.8 |
| B | 12 | 226 | 995 | 8.37 | 380 | 361 | 75.8 |
| C | 1 | 80 | 1175 | 7.89 | 388 | 360 | 103.3 |
| C | 1 | 81 | 1147 | 7.62 | 388 | 360 | 103.3 |
| C | 3 | 158 | 999 | 6.19 | 388 | 360 | 103.3 |
| D | 3 | 14 | 970 | 6.42 | 363 | 329 | 99.8 |
| D | 4 | 160 | 965 | 6.37 | 363 | 329 | 99.8 |
| D | 6 | 231 | 934 | 6.06 | 363 | 329 | 99.8 |
Histogram calculated using DETX and DETY for each event in the final _common_clean file
| Quadrant A | 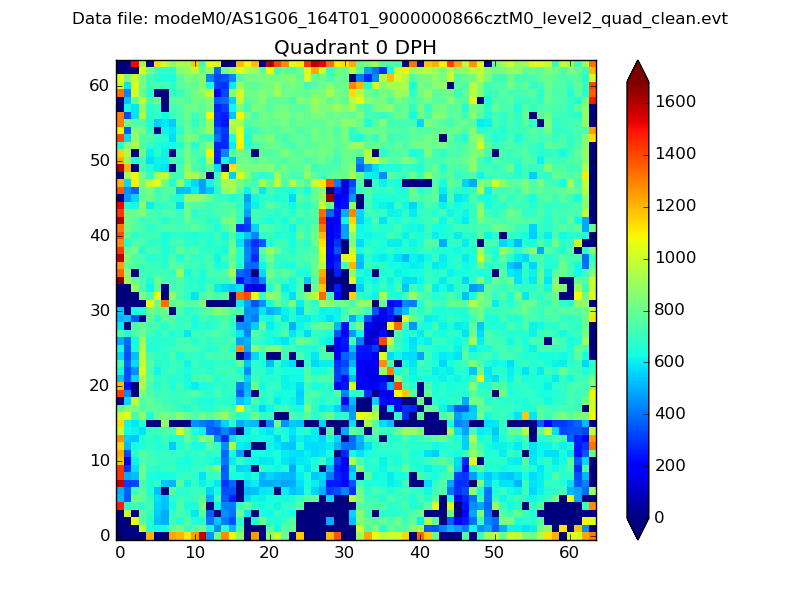 |
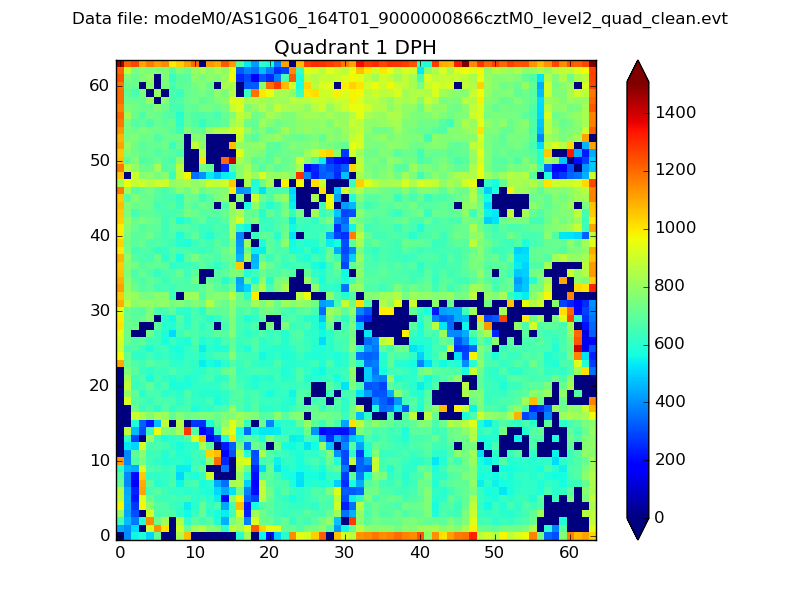 |
Quadrant B |
|---|---|---|---|
| Quadrant D | 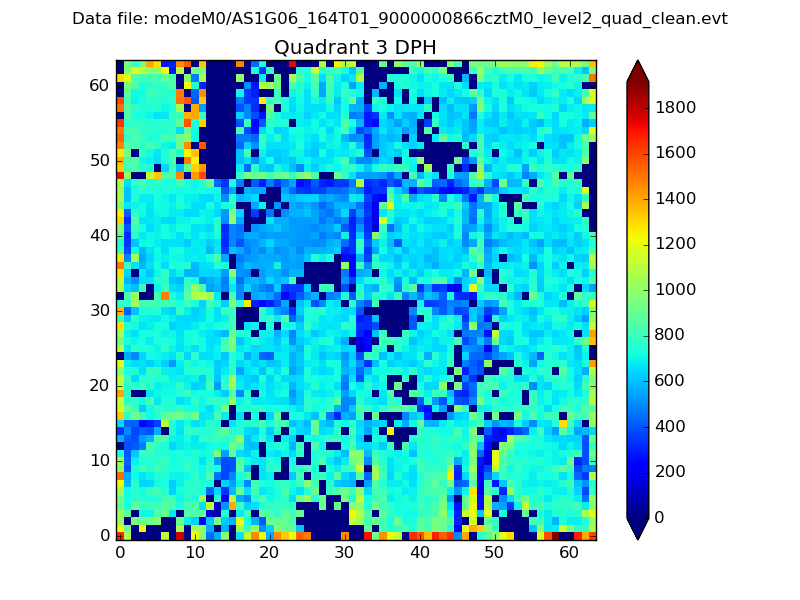 |
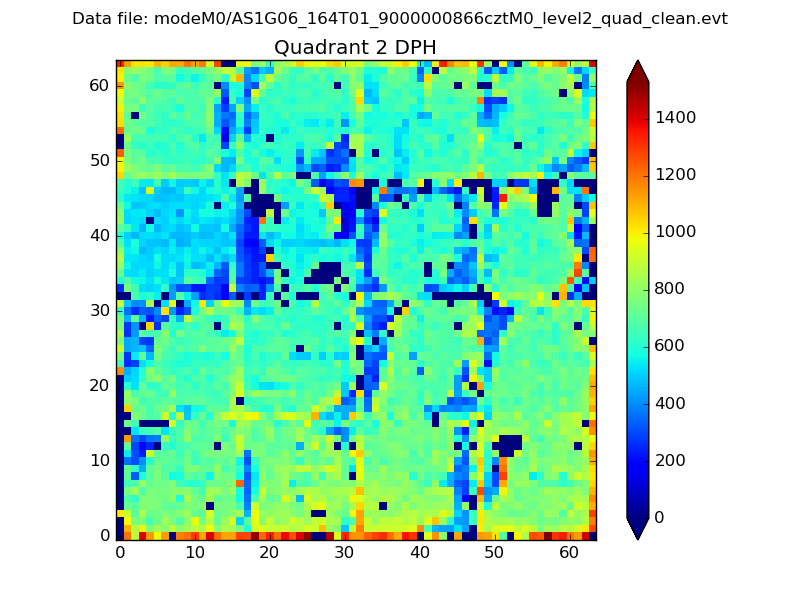 |
Quadrant C |
| Plot type | Count rate plots | Images |
|---|---|---|
| Comparison with Poisson distribution Blue bars denote a histogram of data divided into 1 sec bins. Red curve is a Poisson curve with rate = median count rate of data. |
 |
 |
| Quadrant-wise count rates Data is divided into 100 sec bins |
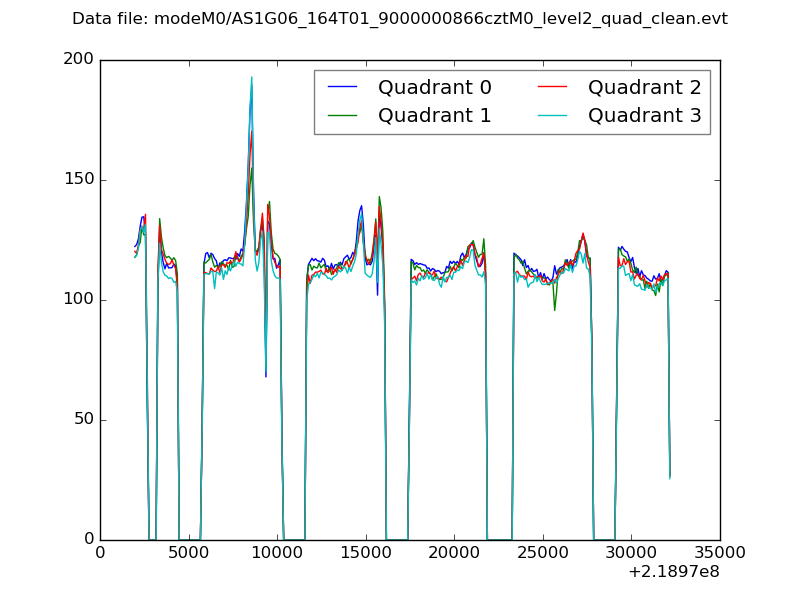 |
|
| Module-wise count rates for Quadrant A Data is divided into 100 sec bins |
 |
 |
| Module-wise count rates for Quadrant B Data is divided into 100 sec bins |
 |
 |
| Module-wise count rates for Quadrant C Data is divided into 100 sec bins |
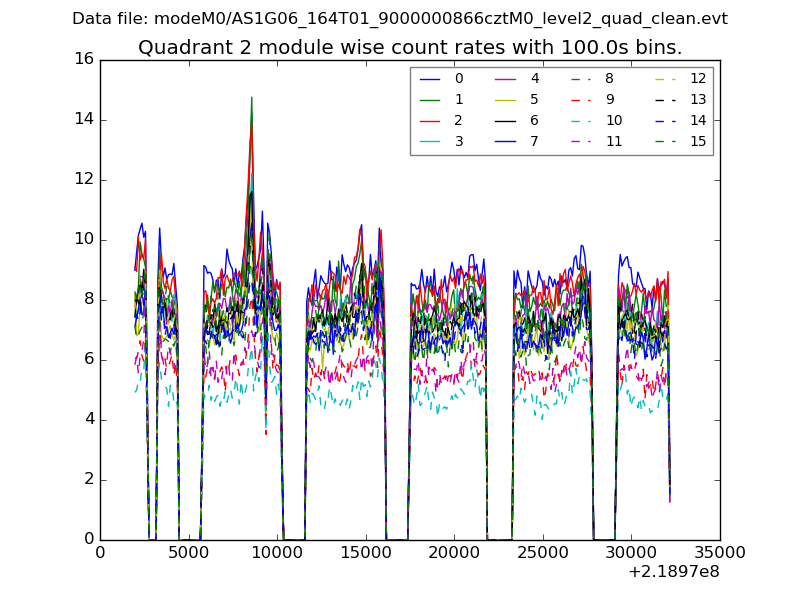 |
 |
| Module-wise count rates for Quadrant D Data is divided into 100 sec bins |
 |
 |
| Parameter | Plot |
|---|---|
| CZT HV Monitor |  |
| D_VDD |  |
| Temperature 1 |  |
| Veto HV Monitor |  |
| Veto LLD | 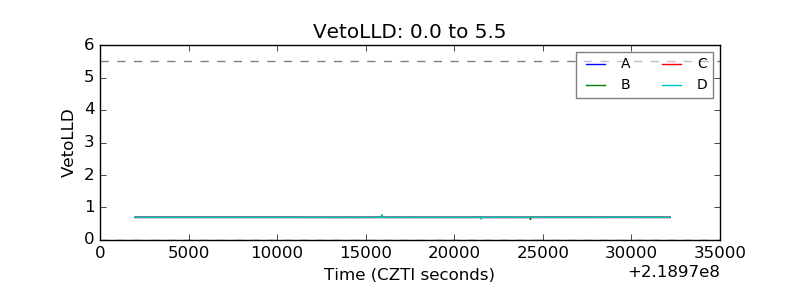 |
| Alpha Counter | 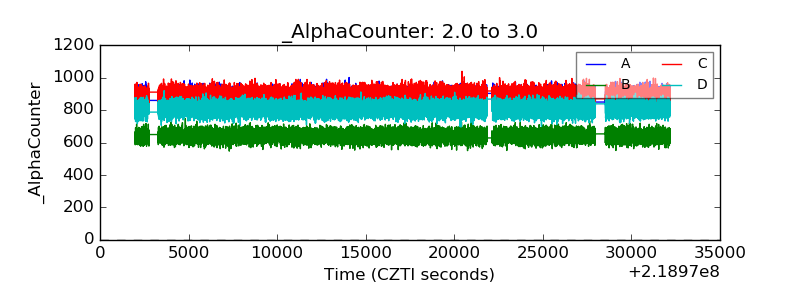 |
| _CPM_Rate |  |
| CZT Counter |  |
| +2.5 Volts monitor |  |
| +5 Volts monitor |  |
| _ROLL_ROT |  |
| _Roll_DEC |  |
| _Roll_RA |  |
| Veto Counter | 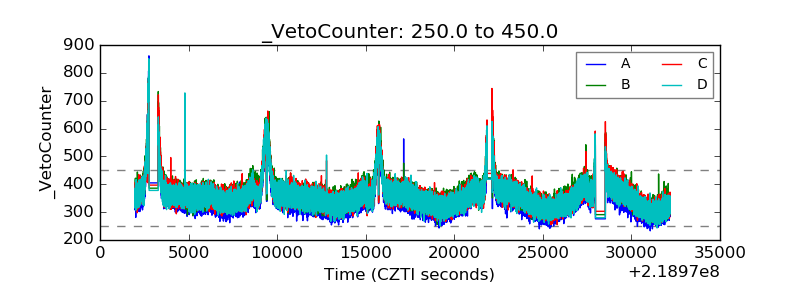 |