| Param | Original file | Final file |
|---|---|---|
| Filename | modeM0/AS1G06_164T01_9000000866_06487cztM0_level2.evt | modeM0/AS1G06_164T01_9000000866_06487cztM0_level2_quad_clean.evt |
| Size (bytes) | 148,098,240 | 36,063,360 |
| Size | 141.2 MB | 34.4 MB |
| Events in quadrant A | 1,066,679 | 234,252 |
| Events in quadrant B | 1,134,832 | 235,543 |
| Events in quadrant C | 1,011,006 | 236,076 |
| Events in quadrant D | 1,121,141 | 227,491 |
| Mode M0 | |||
|---|---|---|---|
| Quadrant | BADHDUFLAG | Total packets | Discarded packets |
| A | 0 | 4693 | 2 |
| B | 0 | 4885 | 1 |
| C | 0 | 4629 | 1 |
| D | 0 | 4760 | 1 |
| Mode SS | |||
|---|---|---|---|
| Quadrant | BADHDUFLAG | Total packets | Discarded packets |
| A | 0 | 48 | 0 |
| B | 0 | 48 | 0 |
| C | 0 | 48 | 0 |
| D | 0 | 48 | 0 |
| Mode M9 | |||
|---|---|---|---|
| Quadrant | BADHDUFLAG | Total packets | Discarded packets |
| A | 0 | 6 | 0 |
| B | 0 | 6 | 0 |
| C | 0 | 6 | 0 |
| D | 0 | 6 | 0 |
| Quadrant | Total seconds | Saturated seconds | Saturation percentage |
|---|---|---|---|
| A | 2185 | 167 | 7.643021% |
| B | 2185 | 167 | 7.643021% |
| C | 2185 | 119 | 5.446224% |
| D | 2185 | 133 | 6.086957% |
Noise dominated data is calculated using 1-second bins in cleaned event files. If a bin has >2000 counts, and if more than 50% of those come from <1% of pixels, then it is considered to be noise-dominated and hence unusable.
| Quadrant | # 1 sec bins | Bins with >0 counts | Bins with >2000 counts | High rate bins dominated by noise | Noise dominated (total time) | Noise dominated (detector-on time) | Marked lightcurve |
|---|---|---|---|---|---|---|---|
| A | 2740 | 2187 | 1 | 1 | 0.04% | 0.05% | 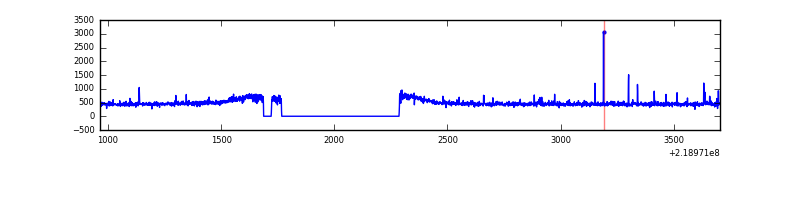 |
| B | 2740 | 2187 | 9 | 9 | 0.33% | 0.41% |  |
| C | 2740 | 2187 | 0 | 0 | 0.00% | 0.00% | 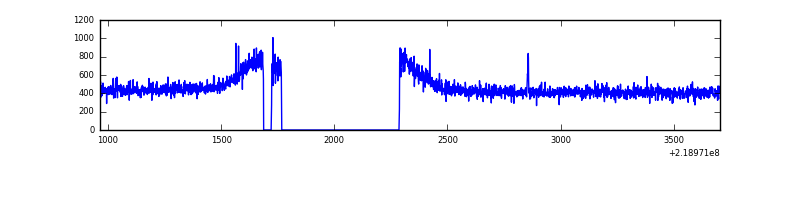 |
| D | 2740 | 2187 | 2 | 2 | 0.07% | 0.09% | 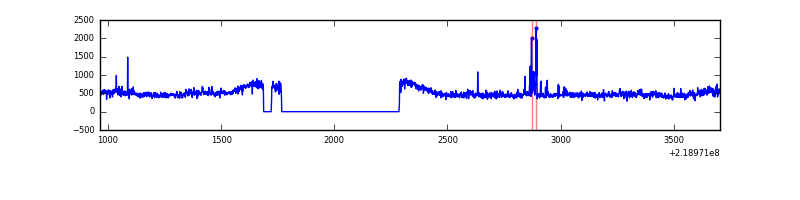 |
Top three noisy pixels from each quadrant. If the there are fewer than three noisy pixels in the level2.evt file, extra rows are filled as -1
| Pixel properties | Quadrant properties | ||||||
|---|---|---|---|---|---|---|---|
| Quadrant | DetID | PixID | Counts | Sigma | Mean | Median | Sigma |
| A | 8 | 15 | 23125 | 396.48 | 268 | 261 | 57.7 |
| A | 15 | 236 | 4303 | 70.09 | 268 | 261 | 57.7 |
| A | 10 | 133 | 3523 | 56.57 | 268 | 261 | 57.7 |
| B | 3 | 220 | 61028 | 1124.34 | 267 | 259 | 54.0 |
| B | 0 | 219 | 24013 | 439.49 | 267 | 259 | 54.0 |
| B | 12 | 111 | 5572 | 98.3 | 267 | 259 | 54.0 |
| C | 12 | 4 | 3382 | 51.43 | 257 | 256 | 60.8 |
| C | 13 | 61 | 2068 | 29.81 | 257 | 256 | 60.8 |
| C | 10 | 170 | 1260 | 16.52 | 257 | 256 | 60.8 |
| D | 8 | 195 | 88988 | 1351.6 | 259 | 248 | 65.7 |
| D | 5 | 97 | 28465 | 429.77 | 259 | 248 | 65.7 |
| D | 2 | 152 | 11269 | 167.86 | 259 | 248 | 65.7 |
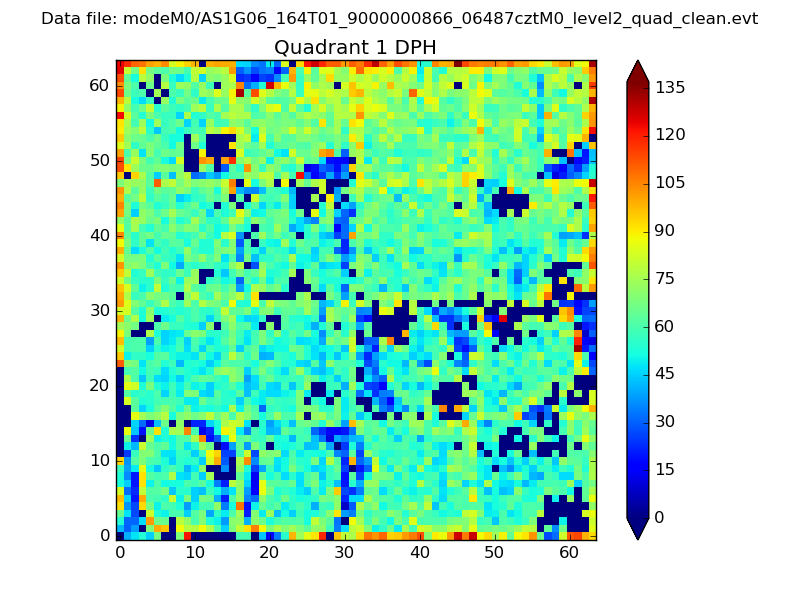
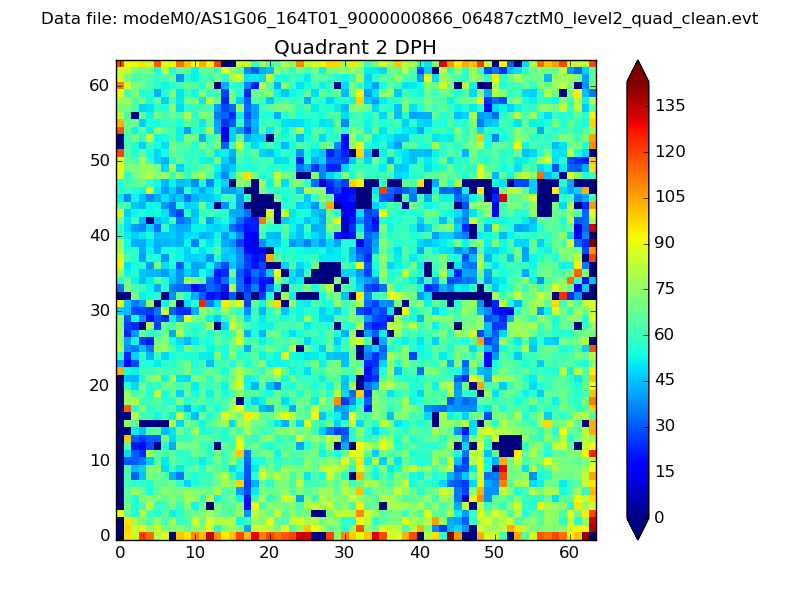
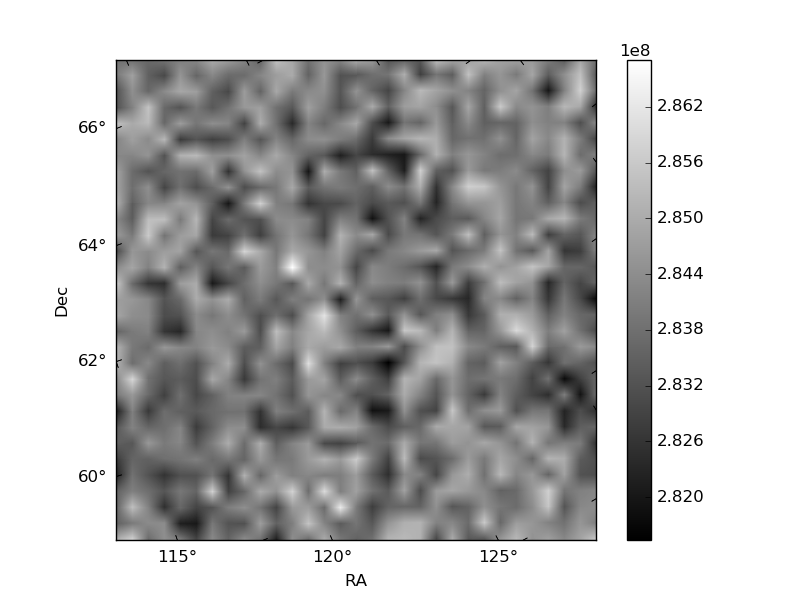
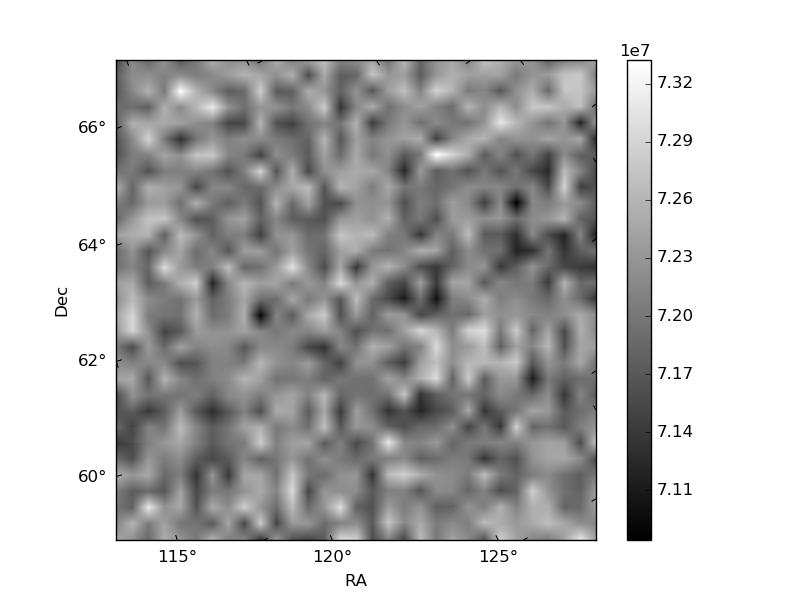
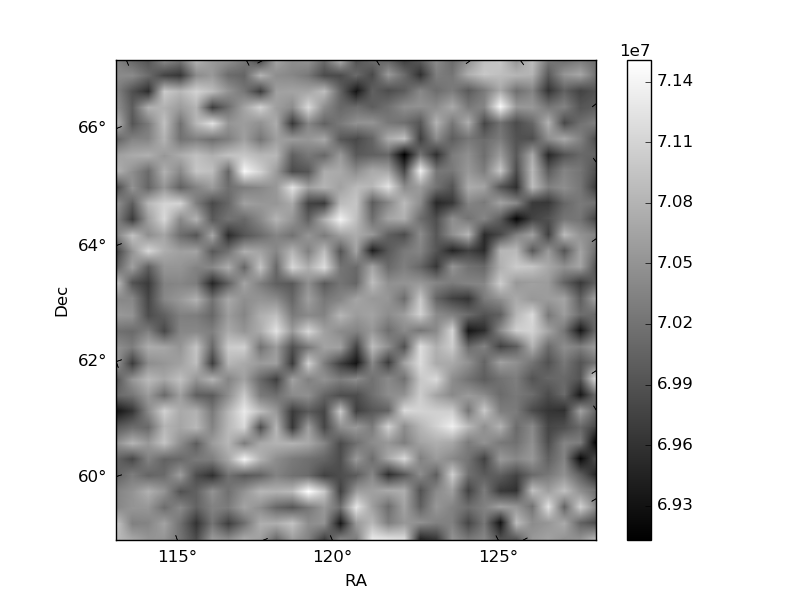
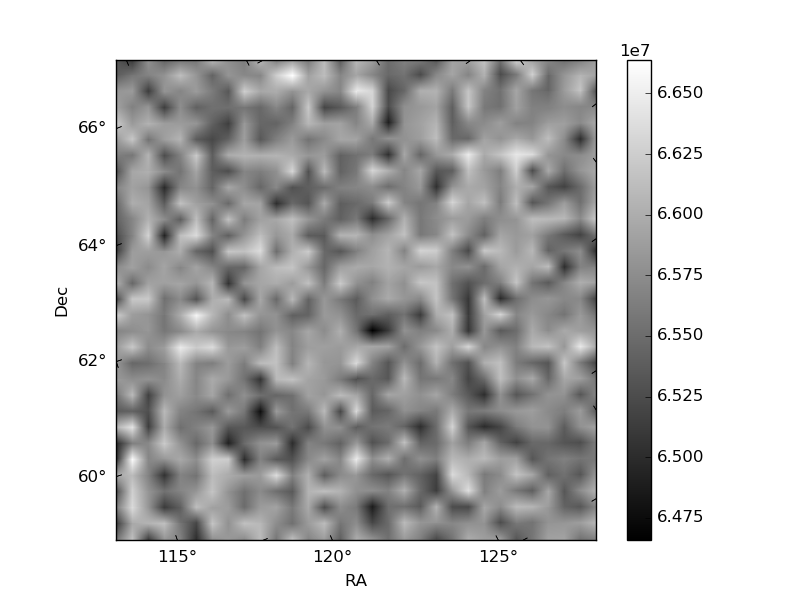
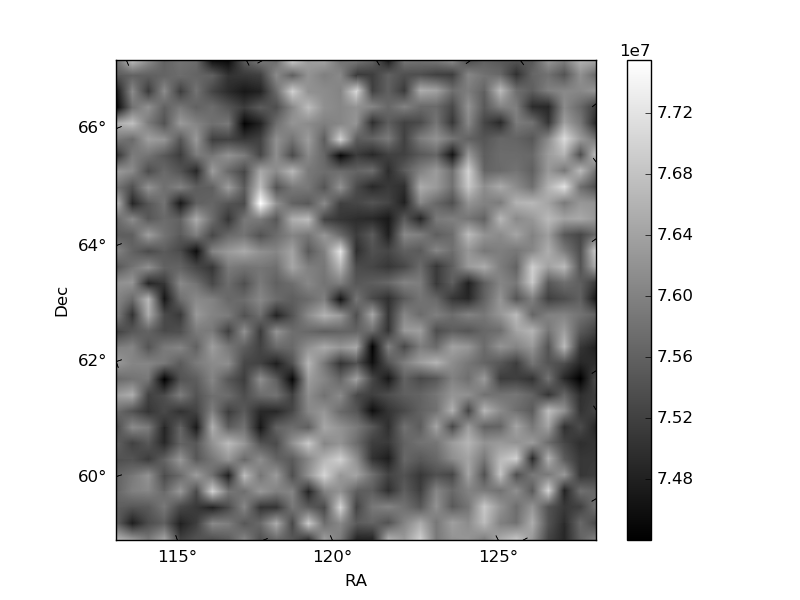
Histogram calculated using DETX and DETY for each event in the final _common_clean file
| Quadrant A | 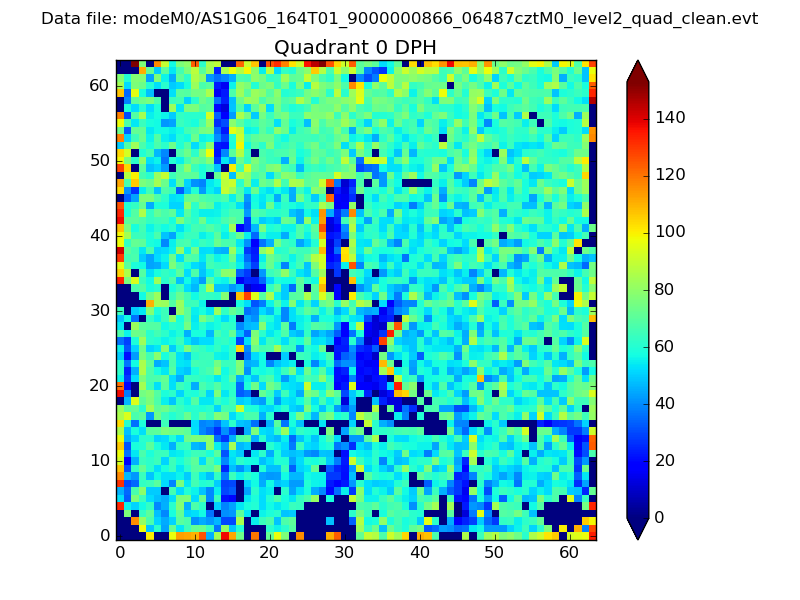 |
 |
Quadrant B |
|---|---|---|---|
| Quadrant D | 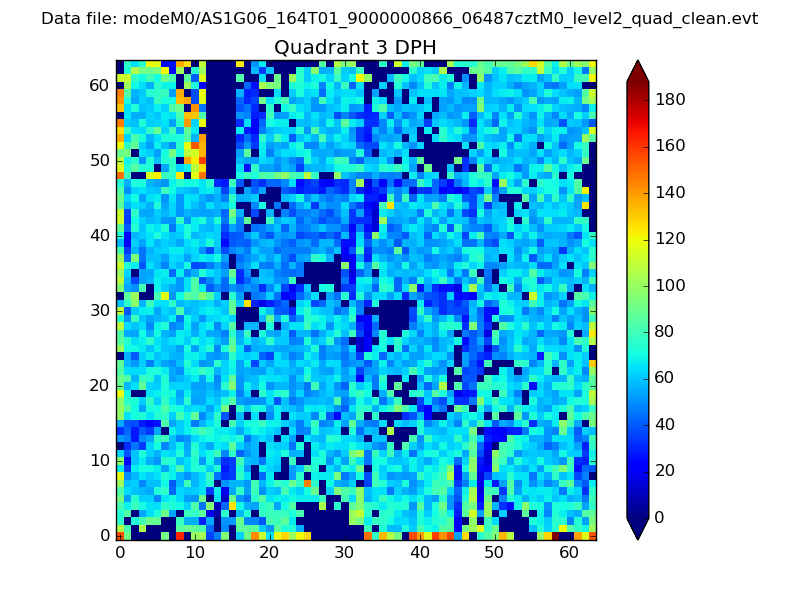 |
 |
Quadrant C |
| Plot type | Count rate plots | Images |
|---|---|---|
| Comparison with Poisson distribution Blue bars denote a histogram of data divided into 1 sec bins. Red curve is a Poisson curve with rate = median count rate of data. |
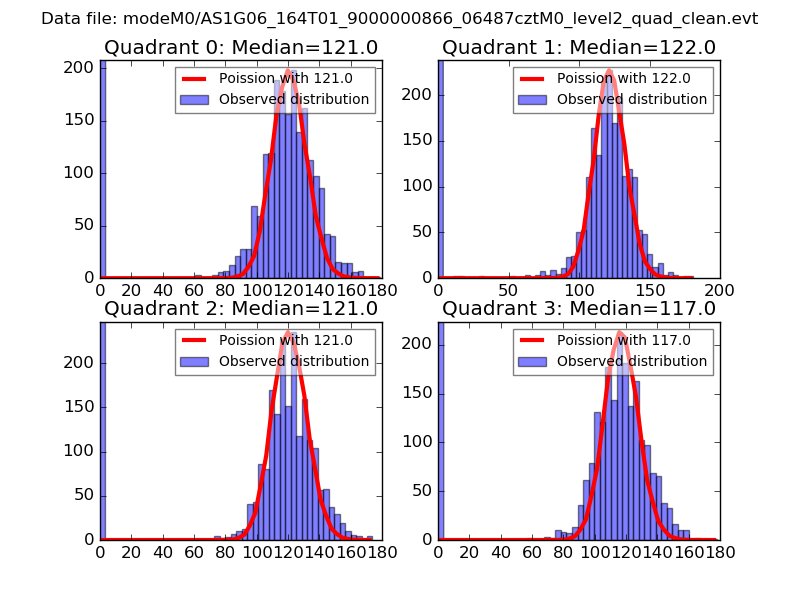 |
 |
| Quadrant-wise count rates Data is divided into 100 sec bins |
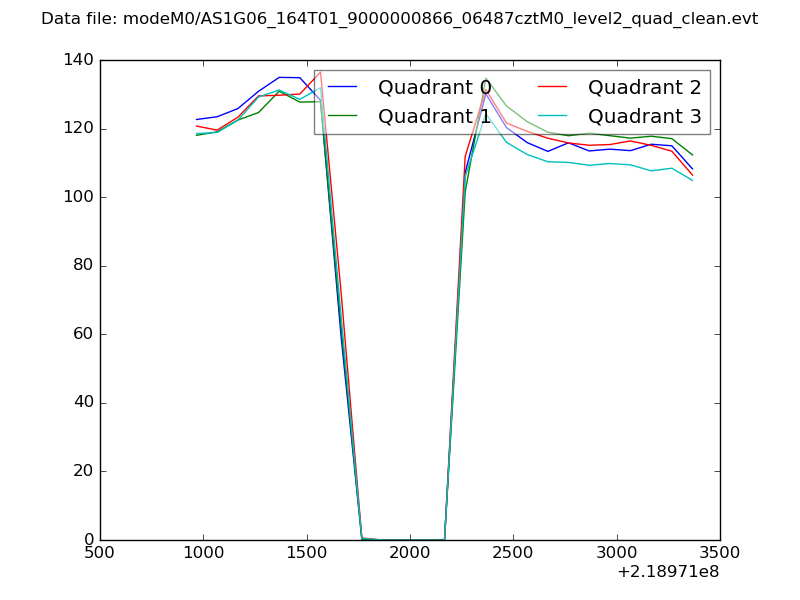 |
|
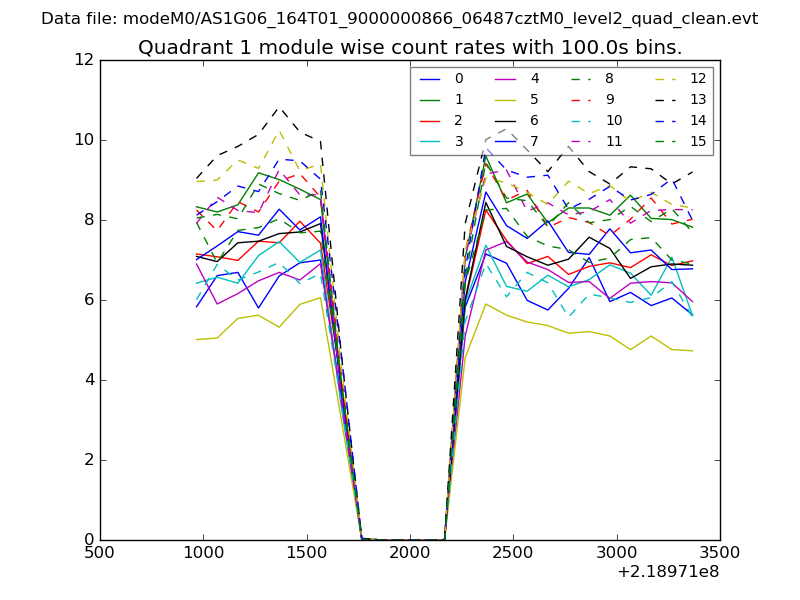
| Module-wise count rates for Quadrant A Data is divided into 100 sec bins |
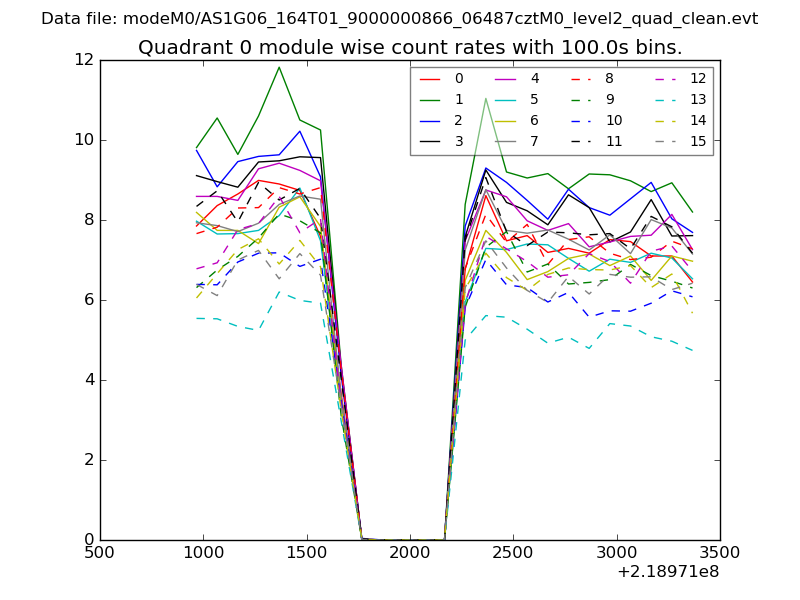 |
 |
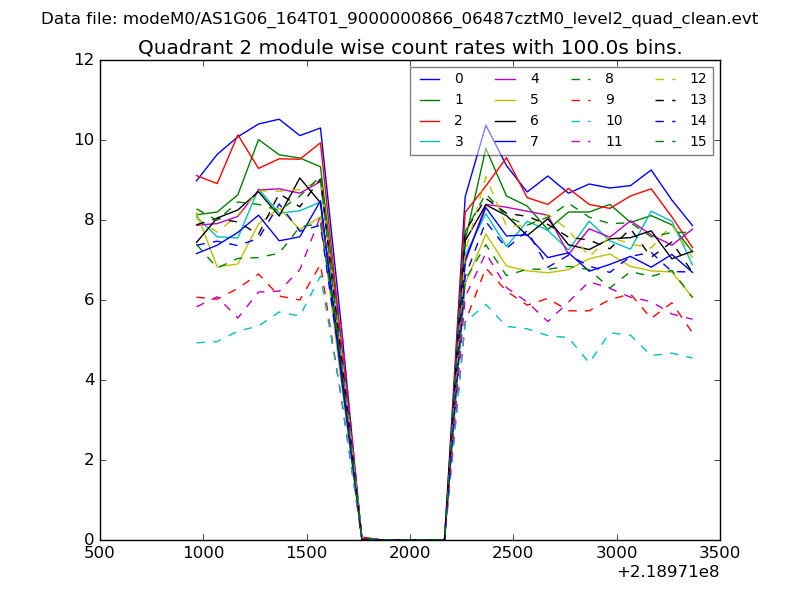
| Module-wise count rates for Quadrant B Data is divided into 100 sec bins |
 |
 |
| Module-wise count rates for Quadrant C Data is divided into 100 sec bins |
 |
 |
| Module-wise count rates for Quadrant D Data is divided into 100 sec bins |
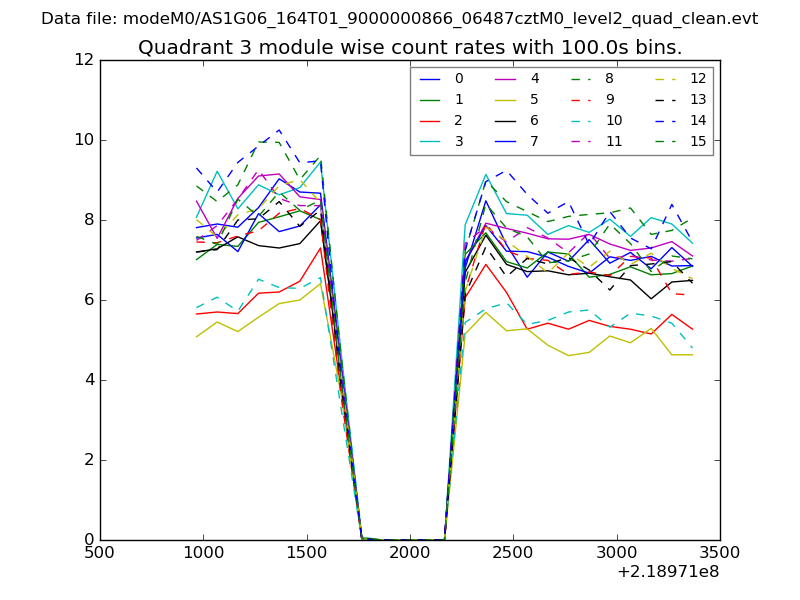 |
 |
| Parameter | Plot |
|---|---|
| CZT HV Monitor | 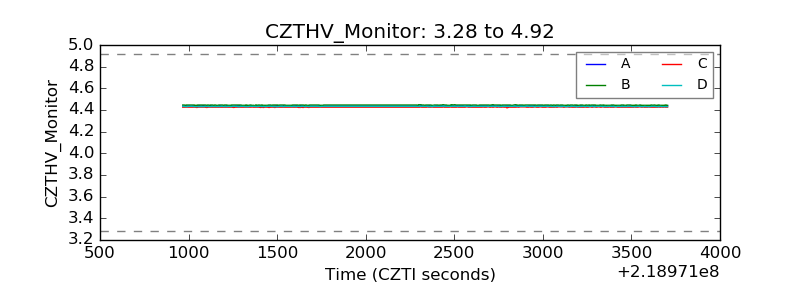 |
| D_VDD | 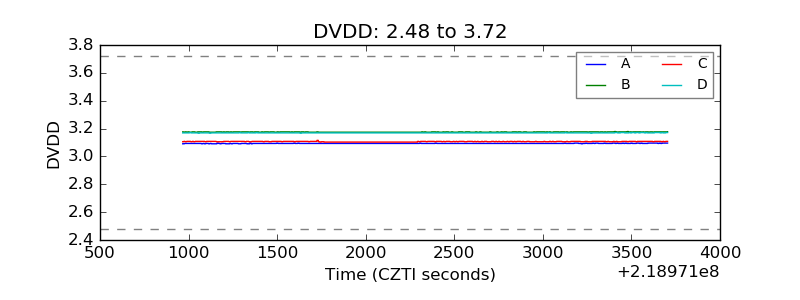 |
| Temperature 1 | 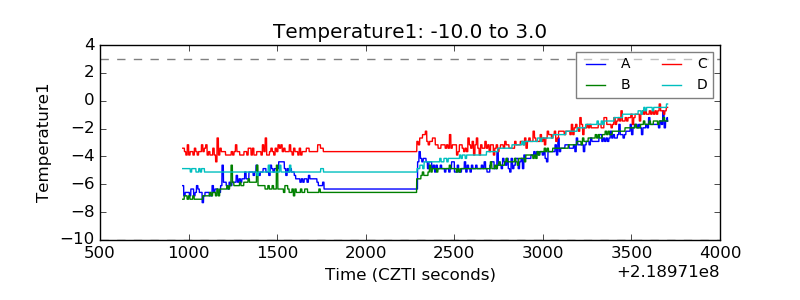 |
| Veto HV Monitor | 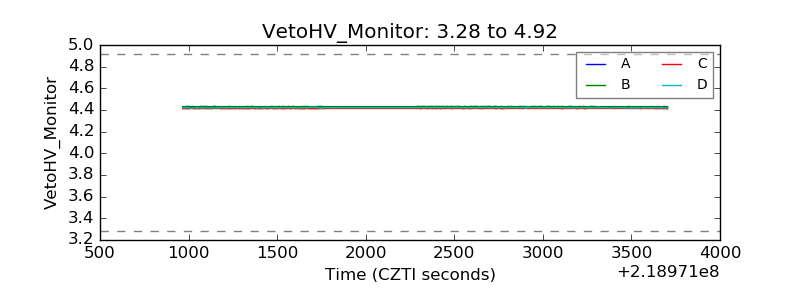 |
| Veto LLD | 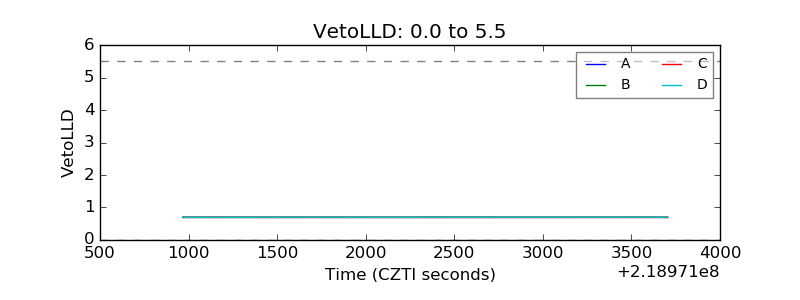 |
| Alpha Counter | 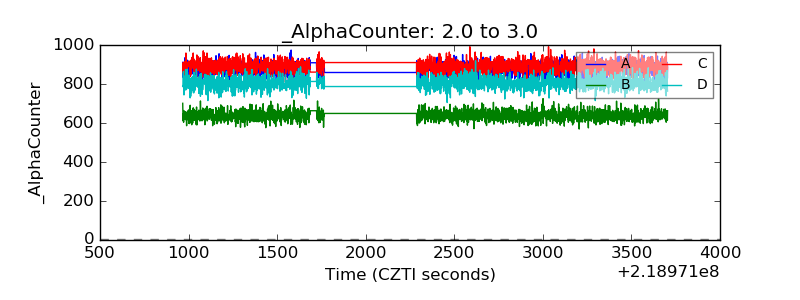 |
| _CPM_Rate | 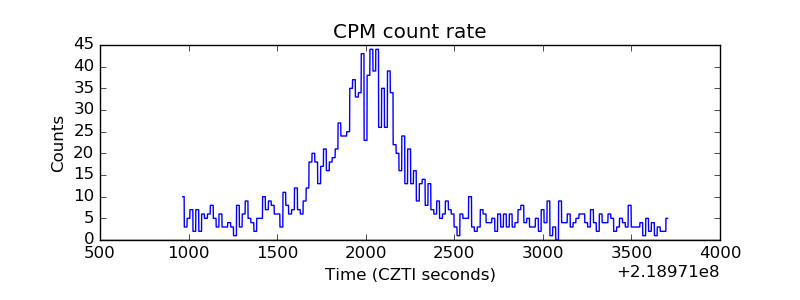 |
| CZT Counter | 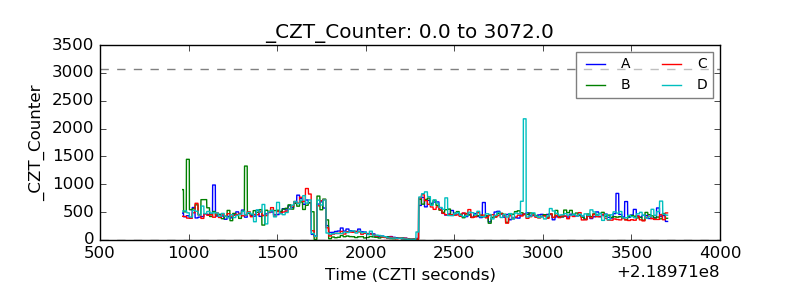 |
| +2.5 Volts monitor |  |
| +5 Volts monitor |  |
| _ROLL_ROT | 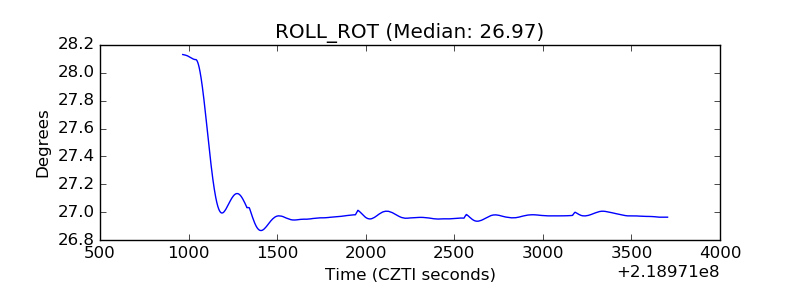 |
| _Roll_DEC | 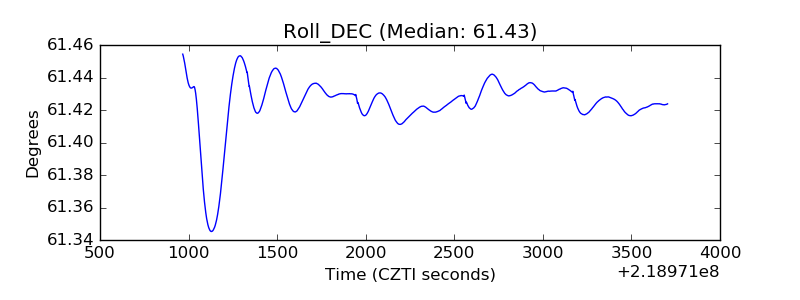 |
| _Roll_RA | 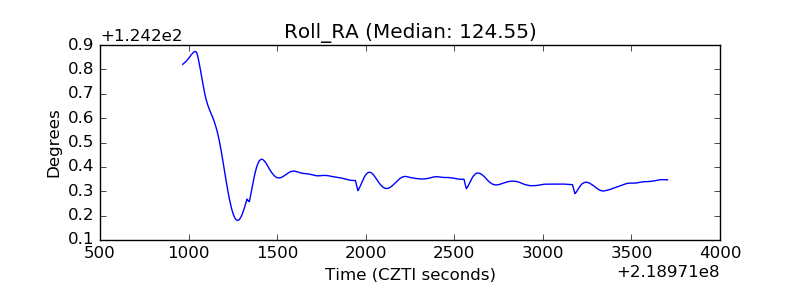 |
| Veto Counter | 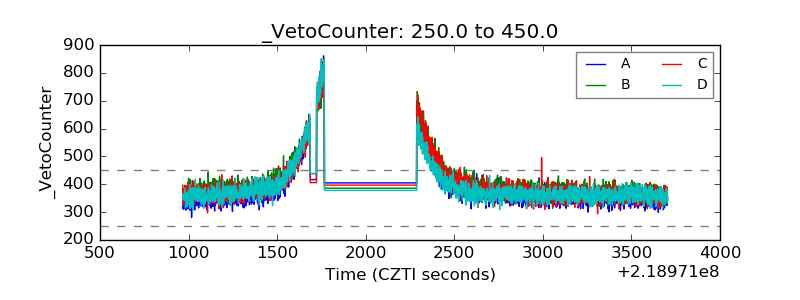 |