| Param | Original file | Final file |
|---|---|---|
| Filename | modeM0/AS1G06_164T01_9000000866_06490cztM0_level2.evt | modeM0/AS1G06_164T01_9000000866_06490cztM0_level2_quad_clean.evt |
| Size (bytes) | 502,392,960 | 95,486,400 |
| Size | 479.1 MB | 91.1 MB |
| Events in quadrant A | 3,639,007 | 598,867 |
| Events in quadrant B | 3,672,980 | 598,122 |
| Events in quadrant C | 3,360,625 | 586,004 |
| Events in quadrant D | 4,018,072 | 572,232 |
| Mode M0 | |||
|---|---|---|---|
| Quadrant | BADHDUFLAG | Total packets | Discarded packets |
| A | 0 | 16116 | 3 |
| B | 0 | 16166 | 2 |
| C | 0 | 15709 | 2 |
| D | 0 | 16890 | 2 |
| Mode SS | |||
|---|---|---|---|
| Quadrant | BADHDUFLAG | Total packets | Discarded packets |
| A | 0 | 156 | 0 |
| B | 0 | 156 | 0 |
| C | 0 | 156 | 0 |
| D | 0 | 156 | 0 |
| Mode M9 | |||
|---|---|---|---|
| Quadrant | BADHDUFLAG | Total packets | Discarded packets |
| A | 0 | 3 | 0 |
| B | 0 | 3 | 0 |
| C | 0 | 3 | 0 |
| D | 0 | 3 | 0 |
| Quadrant | Total seconds | Saturated seconds | Saturation percentage |
|---|---|---|---|
| A | 7714 | 139 | 1.801919% |
| B | 7714 | 146 | 1.892663% |
| C | 7714 | 91 | 1.179673% |
| D | 7714 | 136 | 1.763028% |
Noise dominated data is calculated using 1-second bins in cleaned event files. If a bin has >2000 counts, and if more than 50% of those come from <1% of pixels, then it is considered to be noise-dominated and hence unusable.
| Quadrant | # 1 sec bins | Bins with >0 counts | Bins with >2000 counts | High rate bins dominated by noise | Noise dominated (total time) | Noise dominated (detector-on time) | Marked lightcurve |
|---|---|---|---|---|---|---|---|
| A | 8009 | 7716 | 6 | 6 | 0.07% | 0.08% | 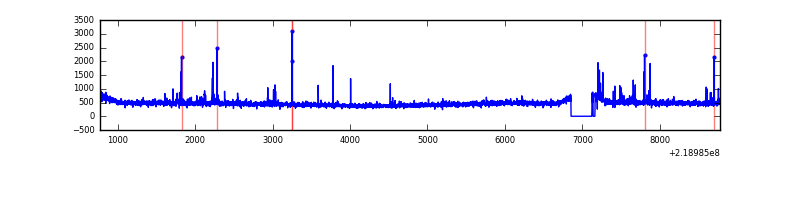 |
| B | 8009 | 7716 | 7 | 7 | 0.09% | 0.09% | 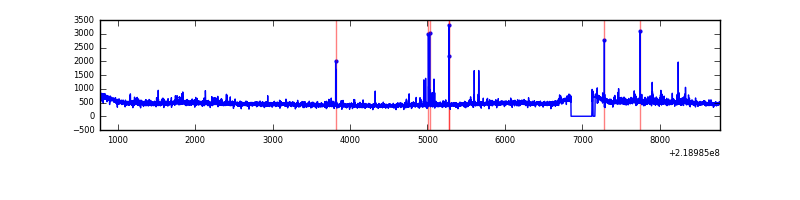 |
| C | 8009 | 7716 | 0 | 0 | 0.00% | 0.00% | 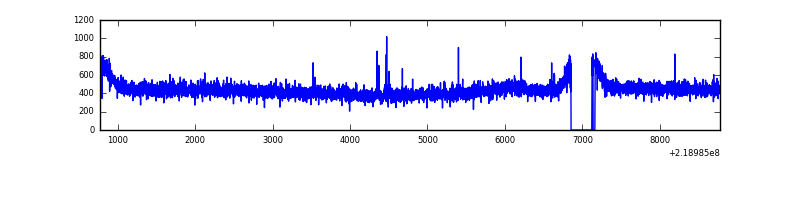 |
| D | 8009 | 7716 | 28 | 28 | 0.35% | 0.36% | 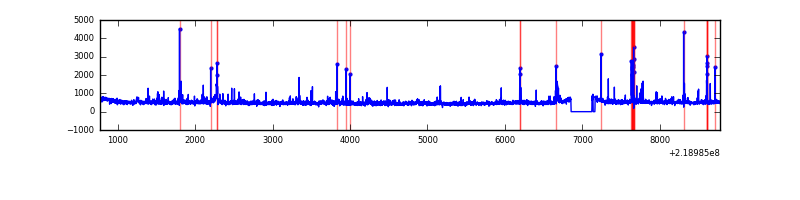 |
Top three noisy pixels from each quadrant. If the there are fewer than three noisy pixels in the level2.evt file, extra rows are filled as -1
| Pixel properties | Quadrant properties | ||||||
|---|---|---|---|---|---|---|---|
| Quadrant | DetID | PixID | Counts | Sigma | Mean | Median | Sigma |
| A | 8 | 15 | 97940 | 530.73 | 894 | 874 | 182.9 |
| A | 15 | 174 | 36454 | 194.54 | 894 | 874 | 182.9 |
| A | 15 | 236 | 30601 | 162.54 | 894 | 874 | 182.9 |
| B | 0 | 214 | 84325 | 486.56 | 895 | 872 | 171.5 |
| B | 15 | 204 | 26644 | 150.26 | 895 | 872 | 171.5 |
| B | 0 | 219 | 22607 | 126.72 | 895 | 872 | 171.5 |
| C | 7 | 247 | 12076 | 56.74 | 857 | 854 | 197.8 |
| C | 13 | 61 | 6828 | 30.2 | 857 | 854 | 197.8 |
| C | 1 | 16 | 3189 | 11.81 | 857 | 854 | 197.8 |
| D | 8 | 195 | 313737 | 1479.52 | 864 | 834 | 211.5 |
| D | 2 | 152 | 188082 | 885.37 | 864 | 834 | 211.5 |
| D | 2 | 14 | 67646 | 315.91 | 864 | 834 | 211.5 |
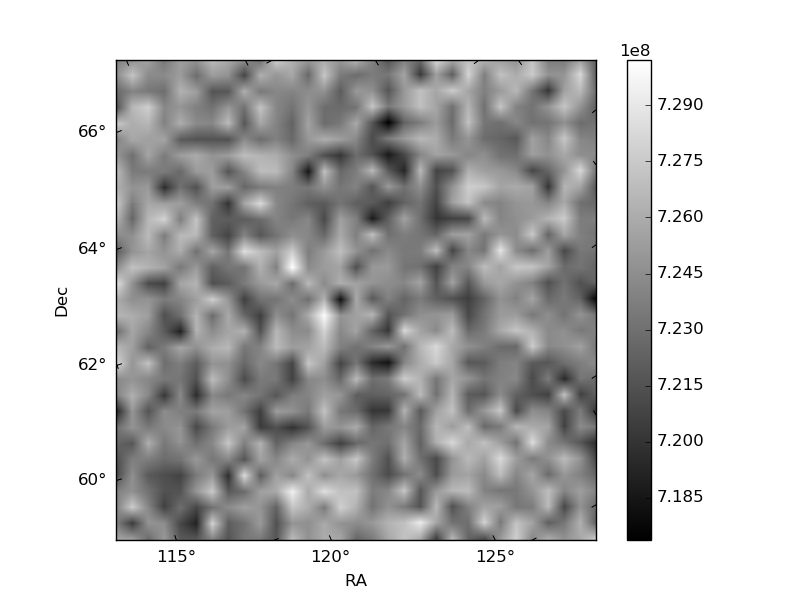
Histogram calculated using DETX and DETY for each event in the final _common_clean file
| Quadrant A | 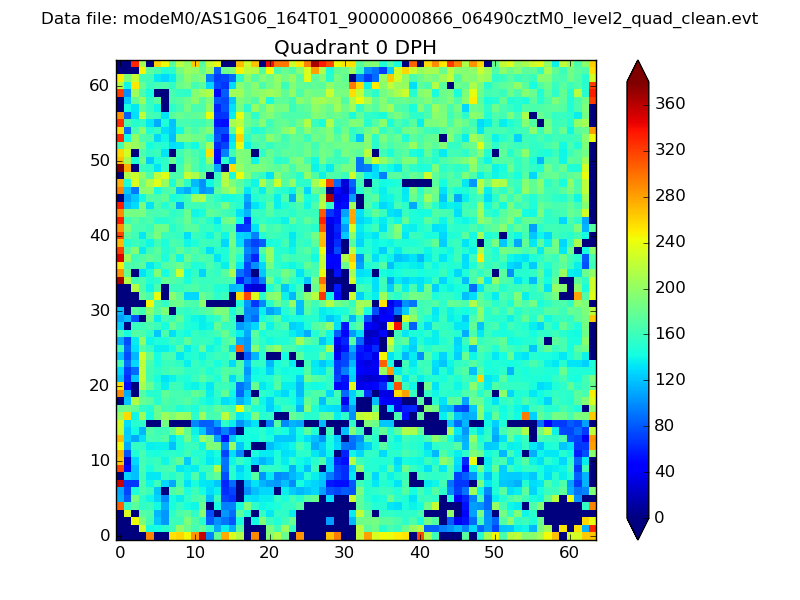 |
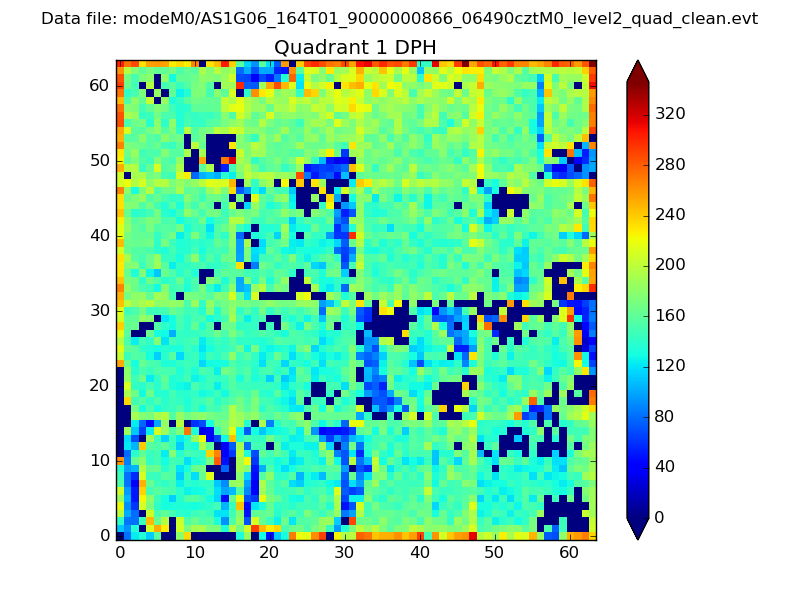 |
Quadrant B |
|---|---|---|---|
| Quadrant D | 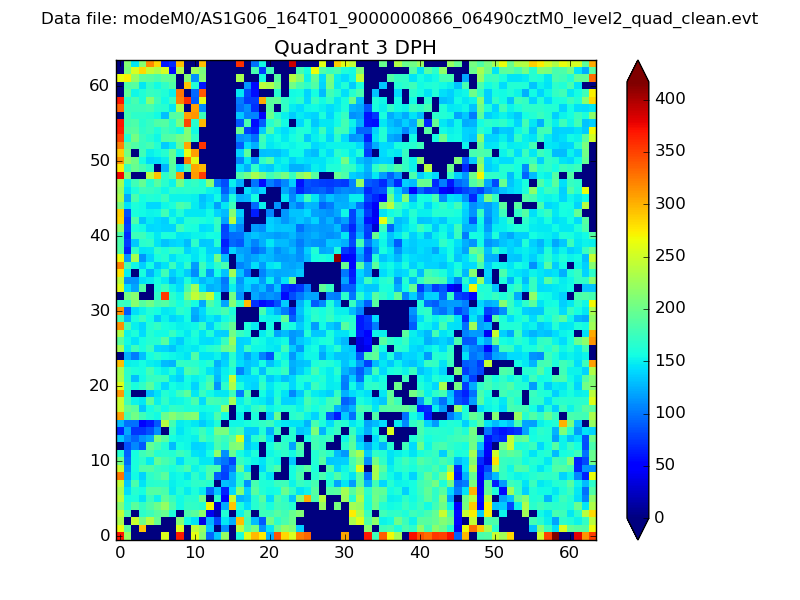 |
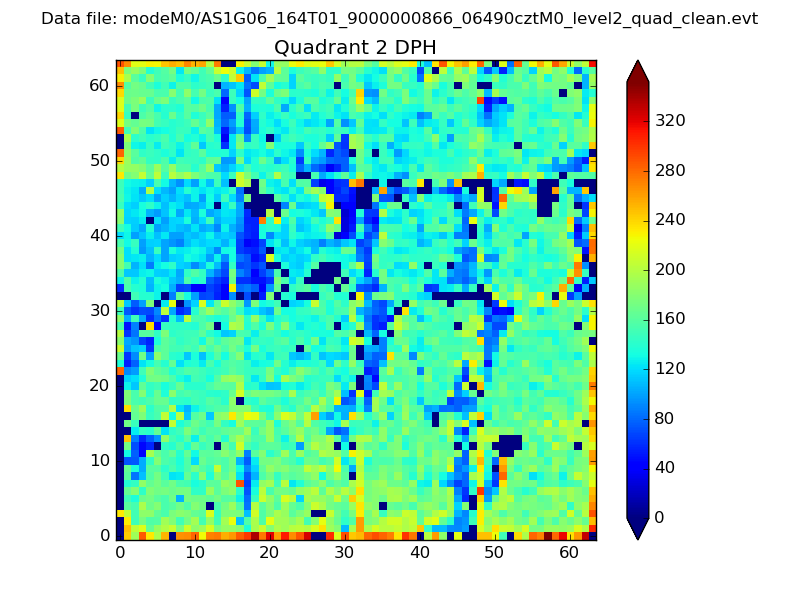 |
Quadrant C |
| Plot type | Count rate plots | Images |
|---|---|---|
| Comparison with Poisson distribution Blue bars denote a histogram of data divided into 1 sec bins. Red curve is a Poisson curve with rate = median count rate of data. |
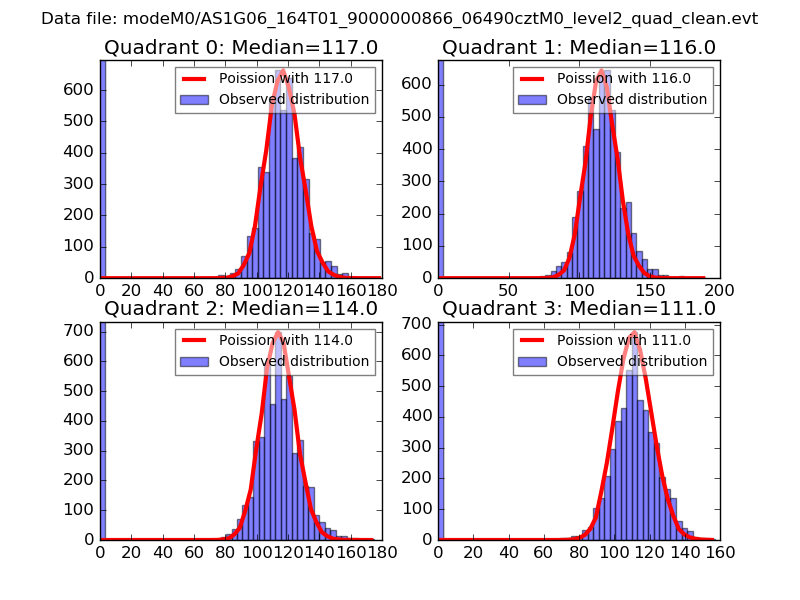 |
 |
| Quadrant-wise count rates Data is divided into 100 sec bins |
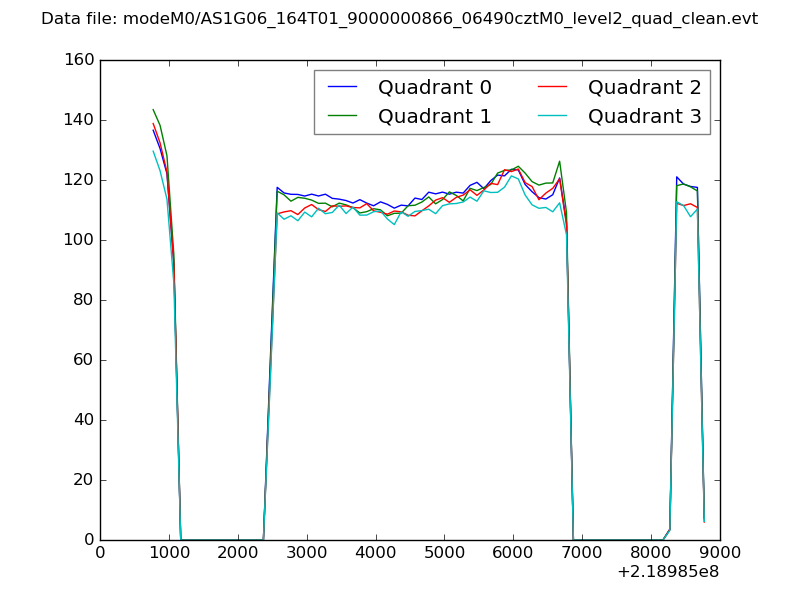 |
|
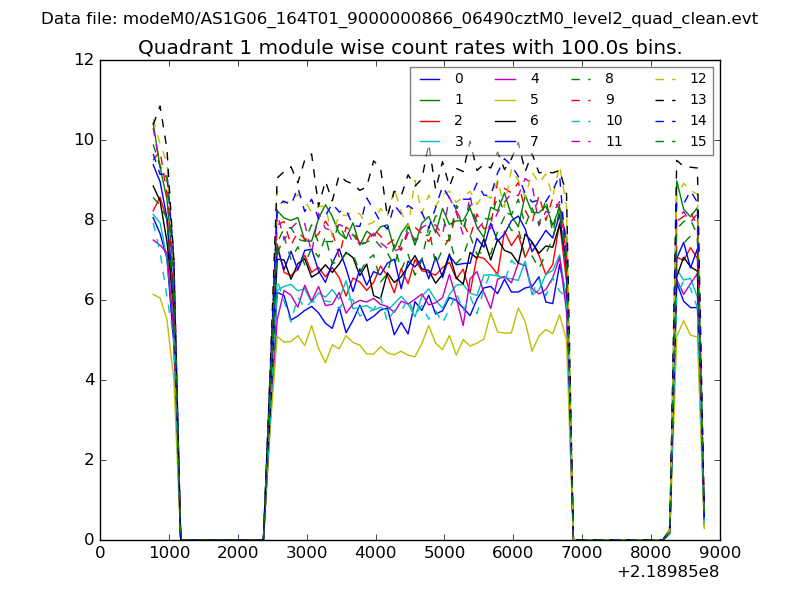
| Module-wise count rates for Quadrant A Data is divided into 100 sec bins |
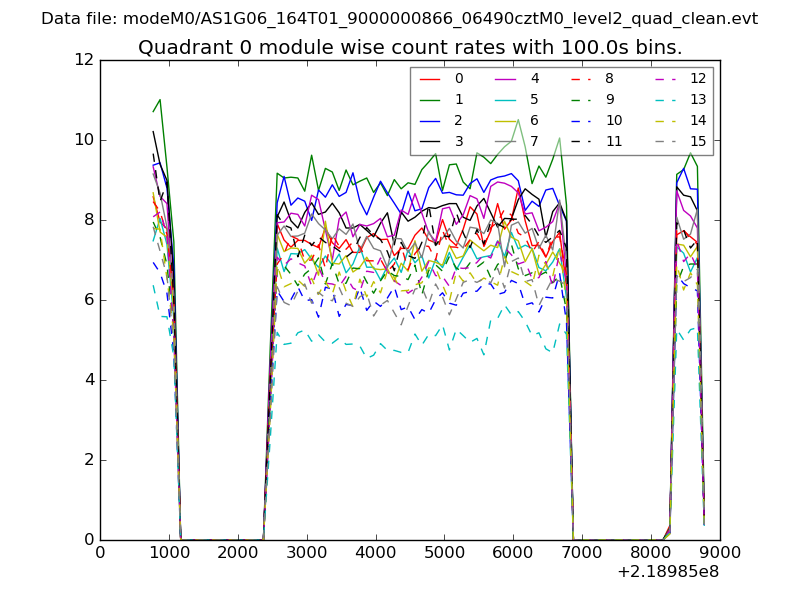 |
 |
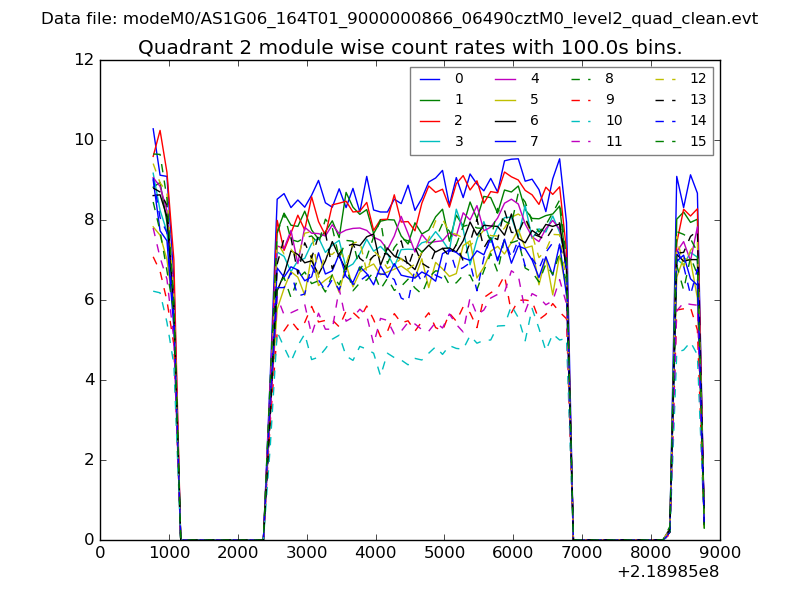
| Module-wise count rates for Quadrant B Data is divided into 100 sec bins |
 |
 |
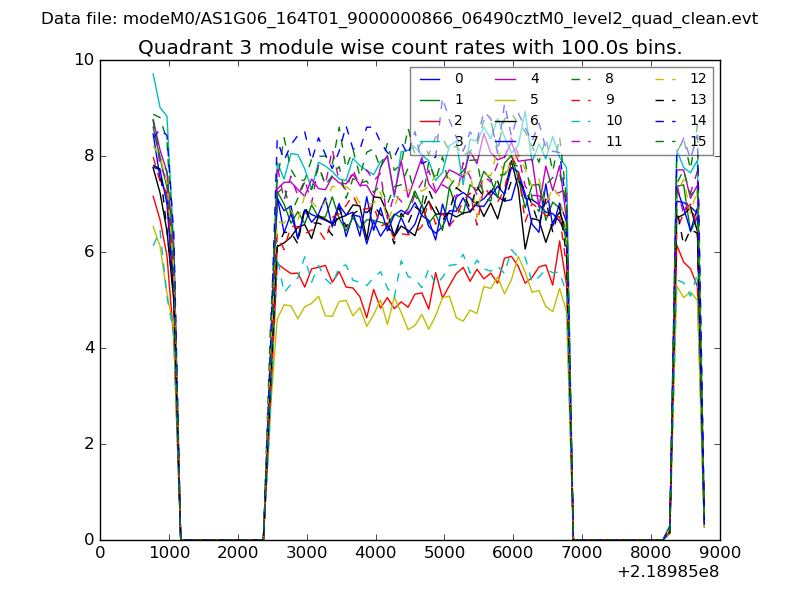
| Module-wise count rates for Quadrant C Data is divided into 100 sec bins |
 |
 |
| Module-wise count rates for Quadrant D Data is divided into 100 sec bins |
 |
 |
| Parameter | Plot |
|---|---|
| CZT HV Monitor | 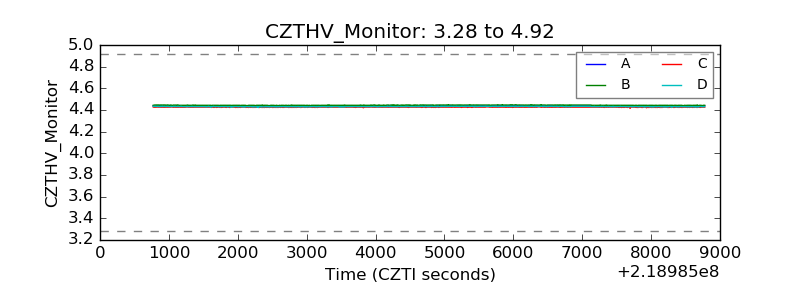 |
| D_VDD | 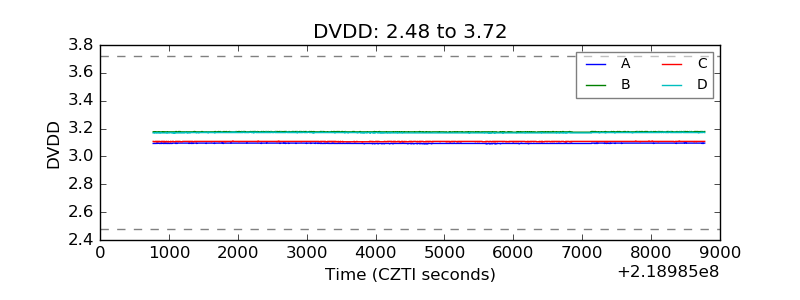 |
| Temperature 1 | 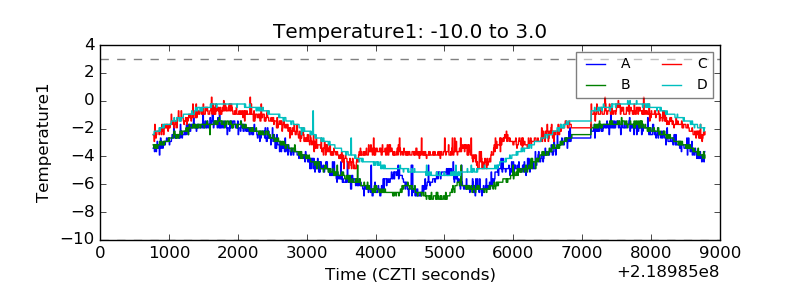 |
| Veto HV Monitor | 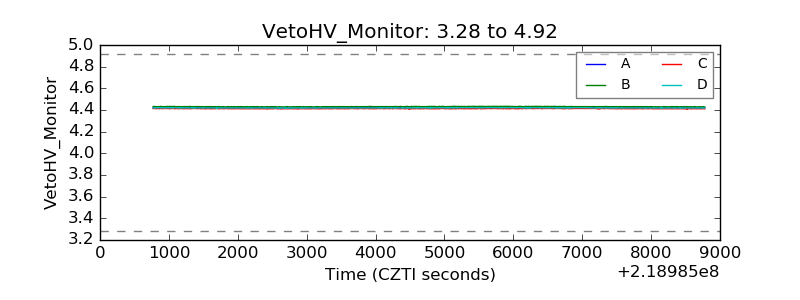 |
| Veto LLD | 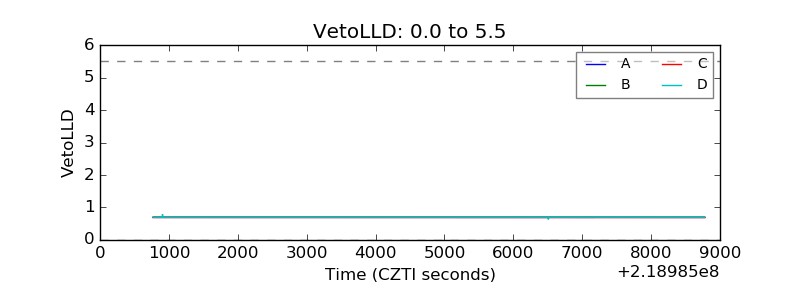 |
| Alpha Counter | 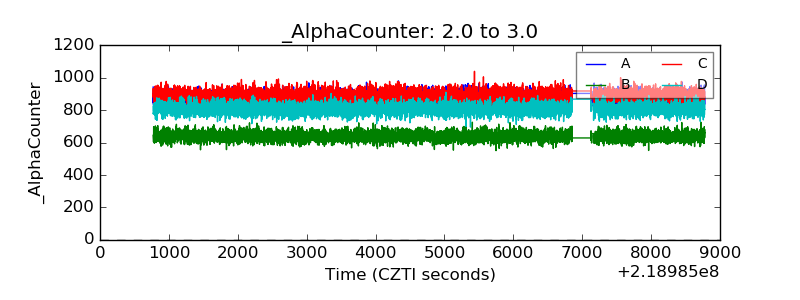 |
| _CPM_Rate | 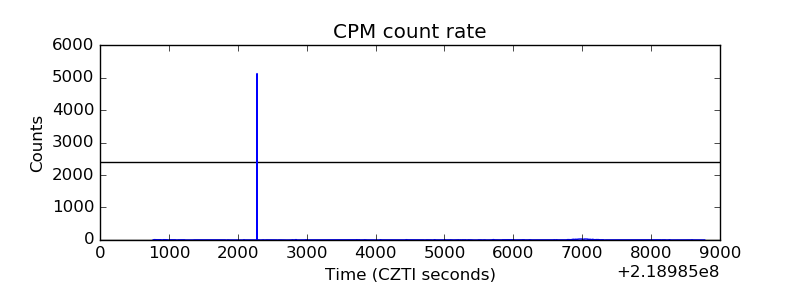 |
| CZT Counter | 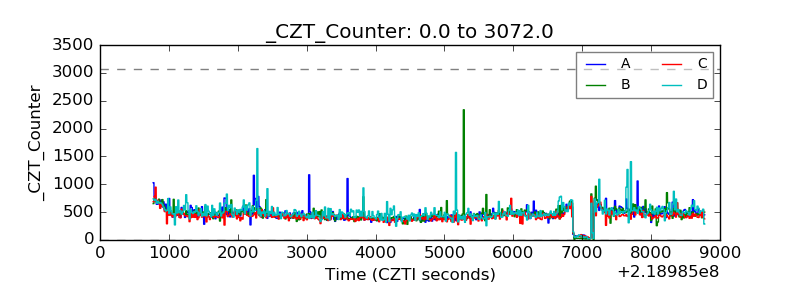 |
| +2.5 Volts monitor |  |
| +5 Volts monitor |  |
| _ROLL_ROT | 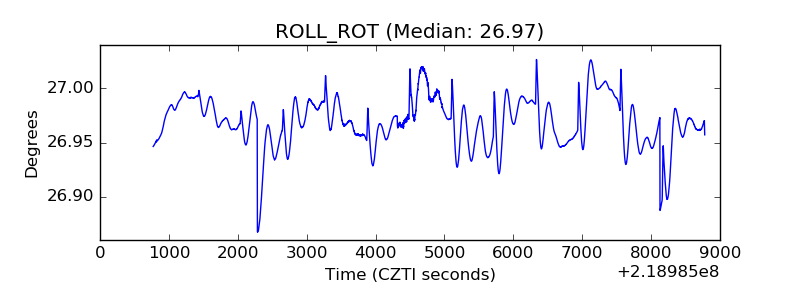 |
| _Roll_DEC | 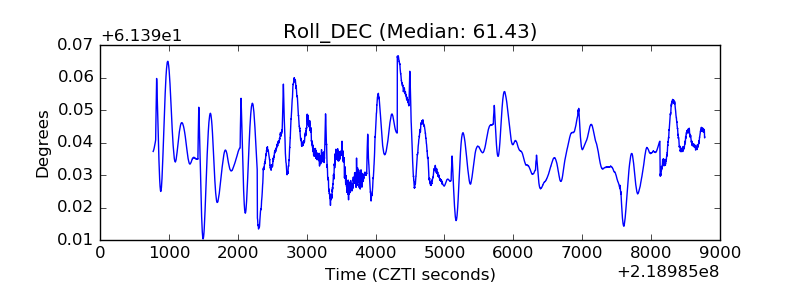 |
| _Roll_RA | 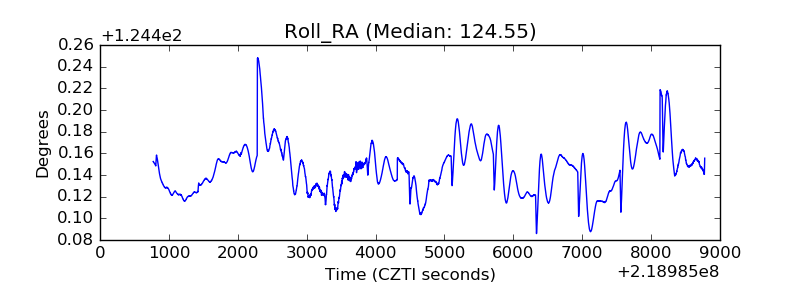 |
| Veto Counter | 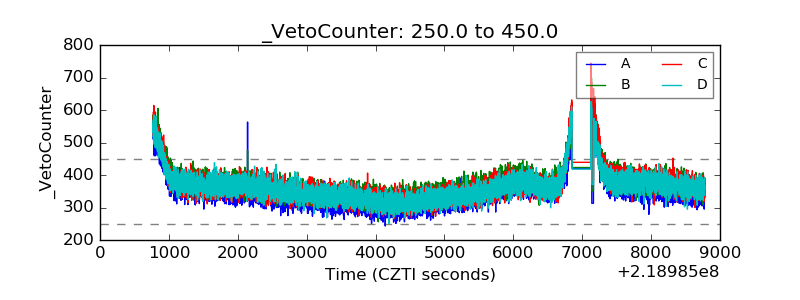 |