| Param | Original file | Final file |
|---|---|---|
| Filename | modeM0/AS1G06_164T01_9000000866_06492cztM0_level2.evt | modeM0/AS1G06_164T01_9000000866_06492cztM0_level2_quad_clean.evt |
| Size (bytes) | 393,073,920 | 83,580,480 |
| Size | 374.9 MB | 79.7 MB |
| Events in quadrant A | 2,810,750 | 536,070 |
| Events in quadrant B | 2,937,334 | 532,115 |
| Events in quadrant C | 2,594,384 | 527,174 |
| Events in quadrant D | 3,152,245 | 515,515 |
| Mode M0 | |||
|---|---|---|---|
| Quadrant | BADHDUFLAG | Total packets | Discarded packets |
| A | 0 | 12589 | 2 |
| B | 0 | 12873 | 1 |
| C | 0 | 12249 | 1 |
| D | 0 | 13420 | 1 |
| Mode SS | |||
|---|---|---|---|
| Quadrant | BADHDUFLAG | Total packets | Discarded packets |
| A | 0 | 124 | 0 |
| B | 0 | 124 | 0 |
| C | 0 | 124 | 0 |
| D | 0 | 124 | 0 |
| Mode M9 | |||
|---|---|---|---|
| Quadrant | BADHDUFLAG | Total packets | Discarded packets |
| A | 0 | 9 | 0 |
| B | 0 | 9 | 0 |
| C | 0 | 9 | 0 |
| D | 0 | 9 | 0 |
| Quadrant | Total seconds | Saturated seconds | Saturation percentage |
|---|---|---|---|
| A | 6017 | 100 | 1.661958% |
| B | 6017 | 117 | 1.944491% |
| C | 6017 | 76 | 1.263088% |
| D | 6017 | 140 | 2.326741% |
Noise dominated data is calculated using 1-second bins in cleaned event files. If a bin has >2000 counts, and if more than 50% of those come from <1% of pixels, then it is considered to be noise-dominated and hence unusable.
| Quadrant | # 1 sec bins | Bins with >0 counts | Bins with >2000 counts | High rate bins dominated by noise | Noise dominated (total time) | Noise dominated (detector-on time) | Marked lightcurve |
|---|---|---|---|---|---|---|---|
| A | 6877 | 6020 | 3 | 3 | 0.04% | 0.05% | 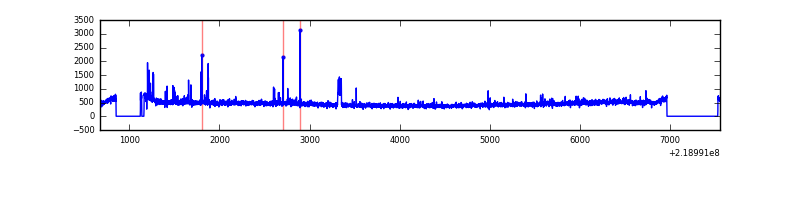 |
| B | 6877 | 6020 | 22 | 22 | 0.32% | 0.37% | 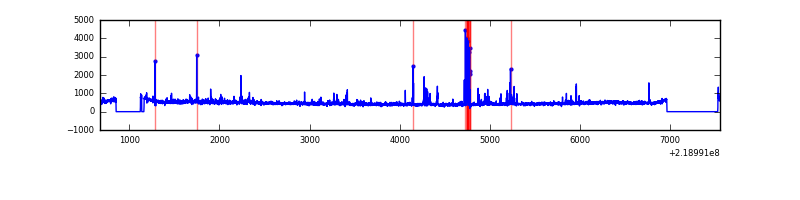 |
| C | 6877 | 6020 | 0 | 0 | 0.00% | 0.00% | 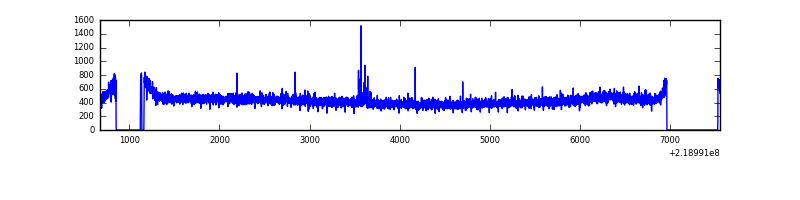 |
| D | 6877 | 6020 | 45 | 45 | 0.65% | 0.75% | 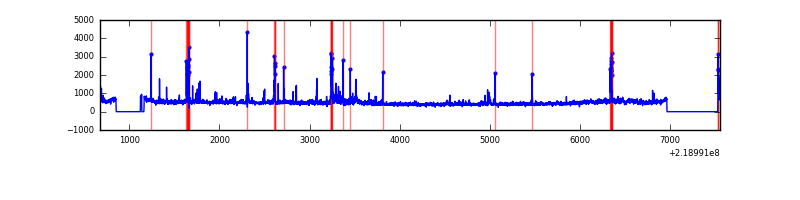 |
Top three noisy pixels from each quadrant. If the there are fewer than three noisy pixels in the level2.evt file, extra rows are filled as -1
| Pixel properties | Quadrant properties | ||||||
|---|---|---|---|---|---|---|---|
| Quadrant | DetID | PixID | Counts | Sigma | Mean | Median | Sigma |
| A | 8 | 15 | 93898 | 660.83 | 684 | 668 | 141.1 |
| A | 15 | 236 | 52532 | 367.62 | 684 | 668 | 141.1 |
| A | 15 | 234 | 18914 | 129.33 | 684 | 668 | 141.1 |
| B | 0 | 219 | 101567 | 762.02 | 685 | 670 | 132.4 |
| B | 0 | 214 | 52256 | 389.6 | 685 | 670 | 132.4 |
| B | 4 | 81 | 45084 | 335.44 | 685 | 670 | 132.4 |
| C | 12 | 4 | 12090 | 74.61 | 660 | 659 | 153.2 |
| C | 13 | 61 | 5192 | 29.59 | 660 | 659 | 153.2 |
| C | 1 | 16 | 2858 | 14.35 | 660 | 659 | 153.2 |
| D | 8 | 195 | 228416 | 1414.07 | 660 | 639 | 161.1 |
| D | 2 | 152 | 195834 | 1211.79 | 660 | 639 | 161.1 |
| D | 2 | 14 | 52699 | 323.19 | 660 | 639 | 161.1 |
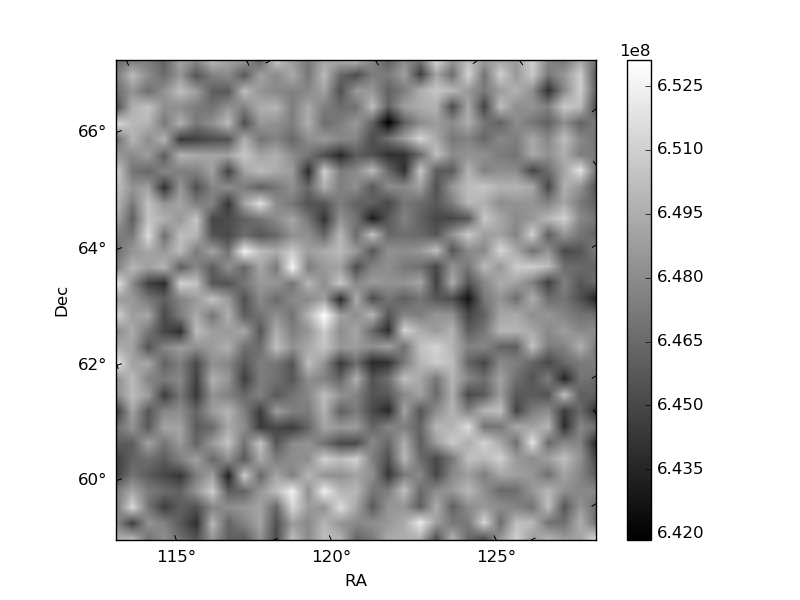
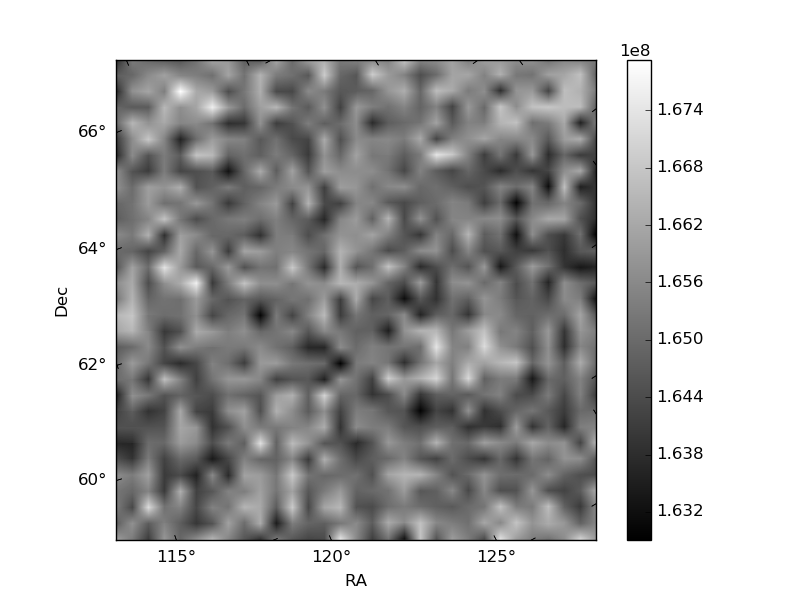
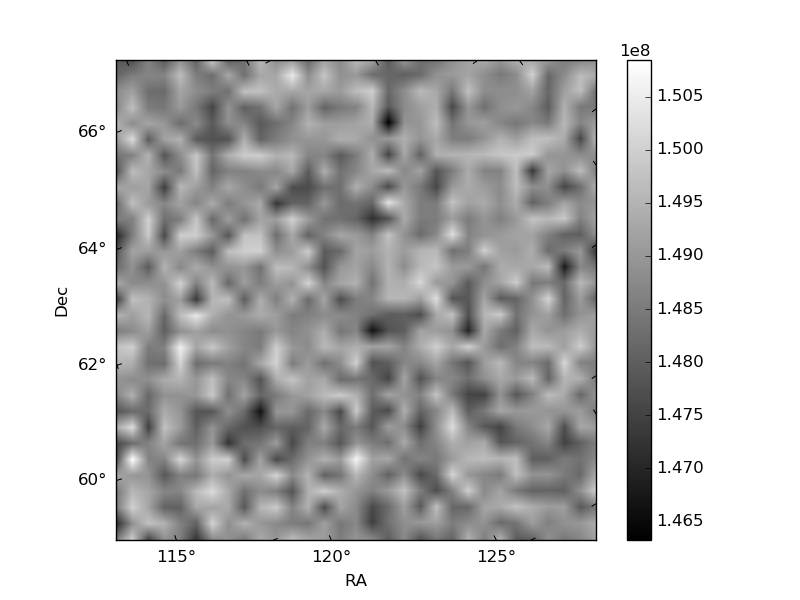
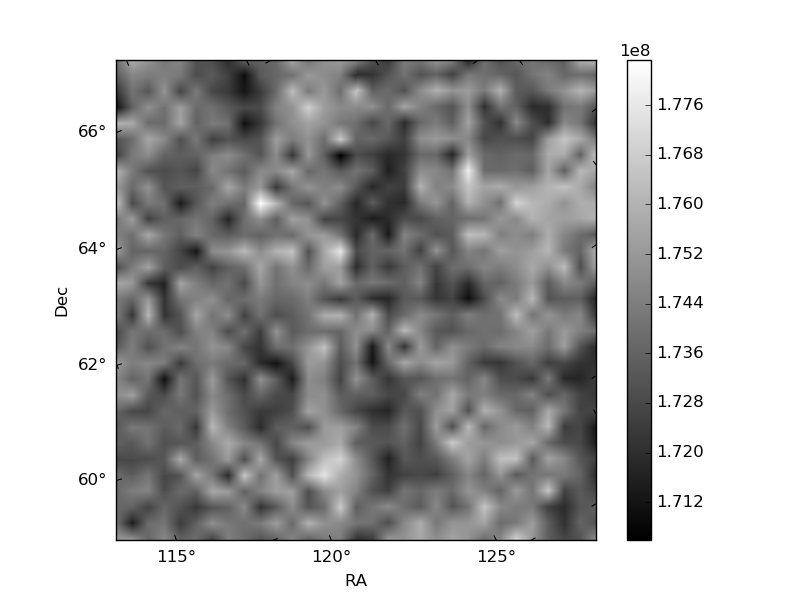
Histogram calculated using DETX and DETY for each event in the final _common_clean file
| Quadrant A | 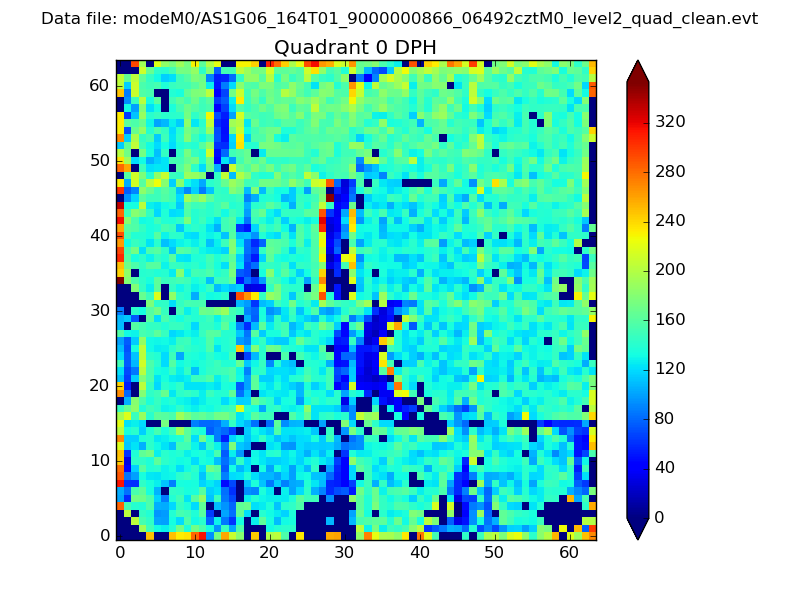 |
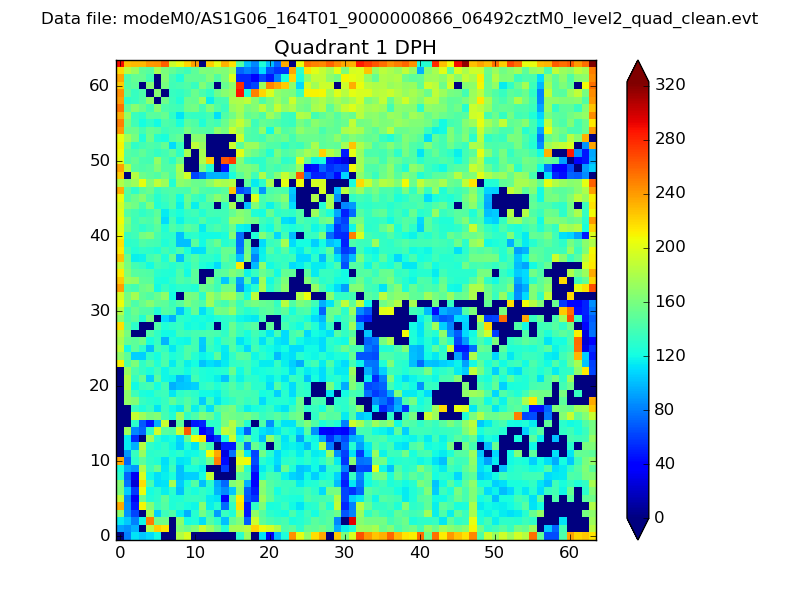 |
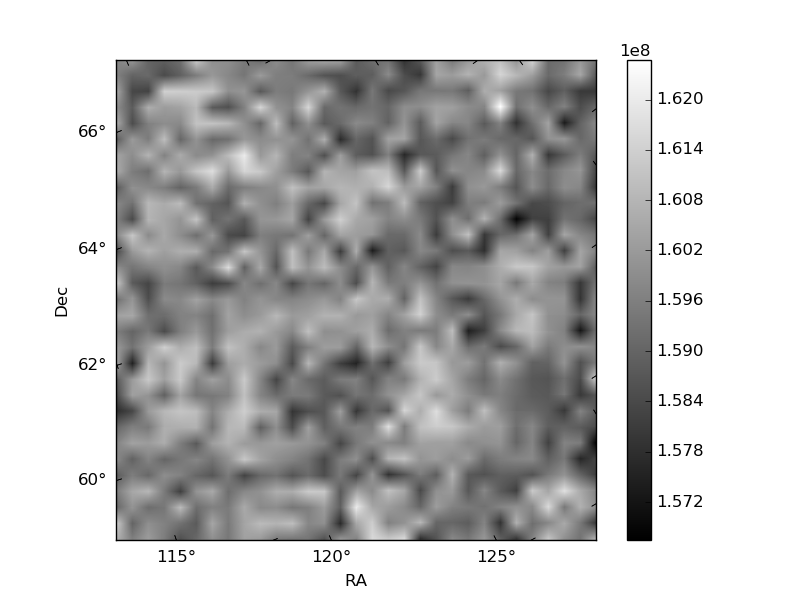
Quadrant B |
|---|---|---|---|
| Quadrant D | 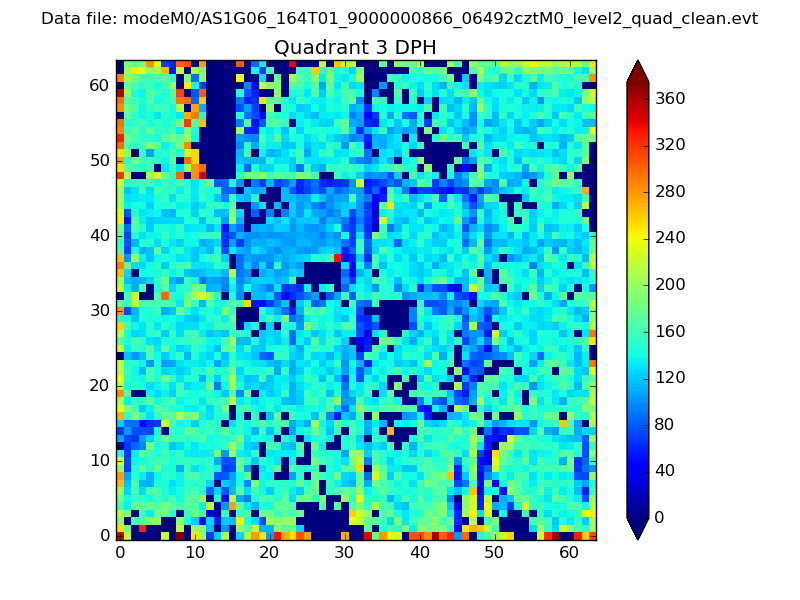 |
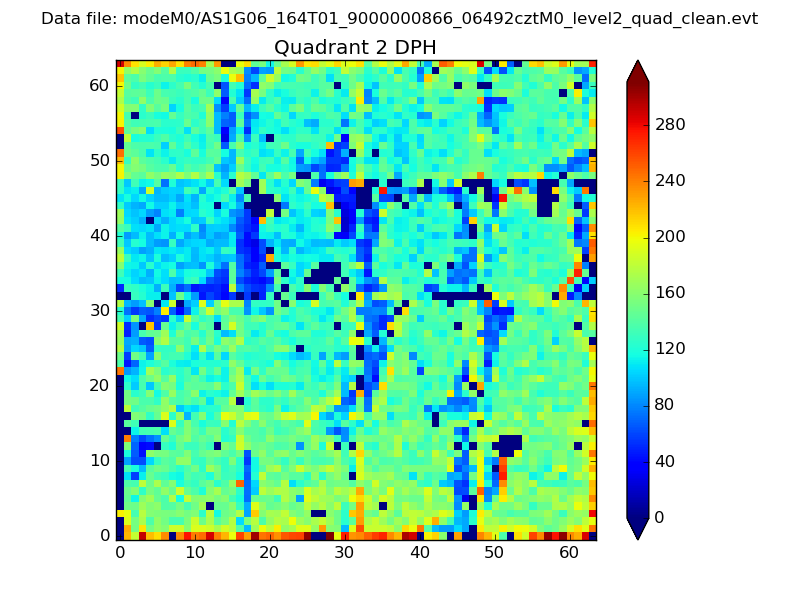 |
Quadrant C |
| Plot type | Count rate plots | Images |
|---|---|---|
| Comparison with Poisson distribution Blue bars denote a histogram of data divided into 1 sec bins. Red curve is a Poisson curve with rate = median count rate of data. |
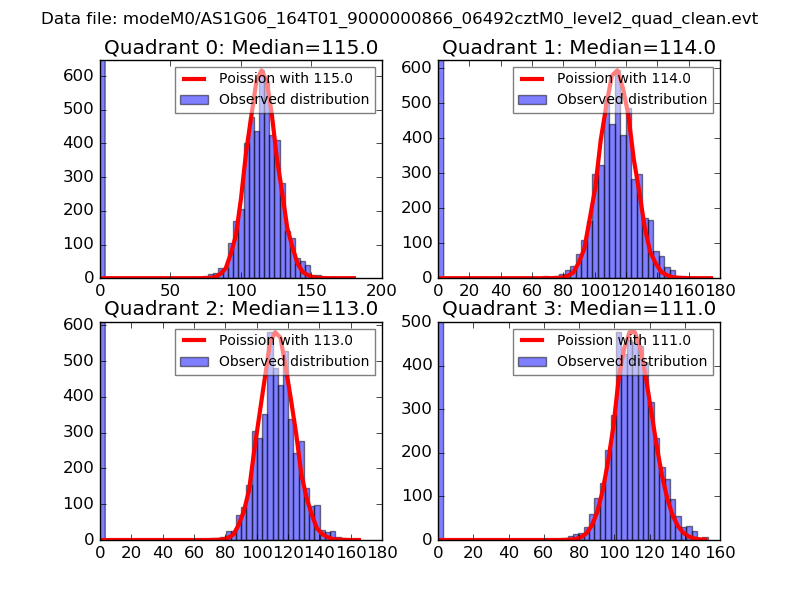 |
 |
| Quadrant-wise count rates Data is divided into 100 sec bins |
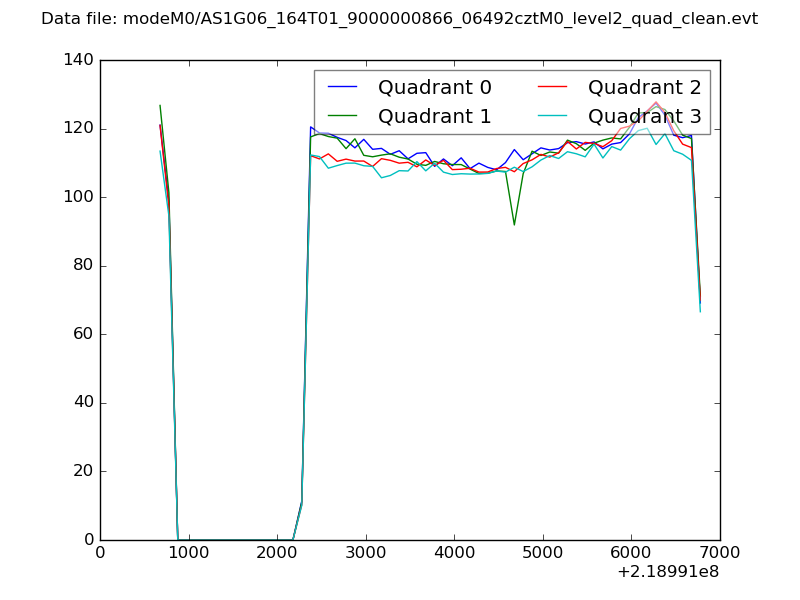 |
|
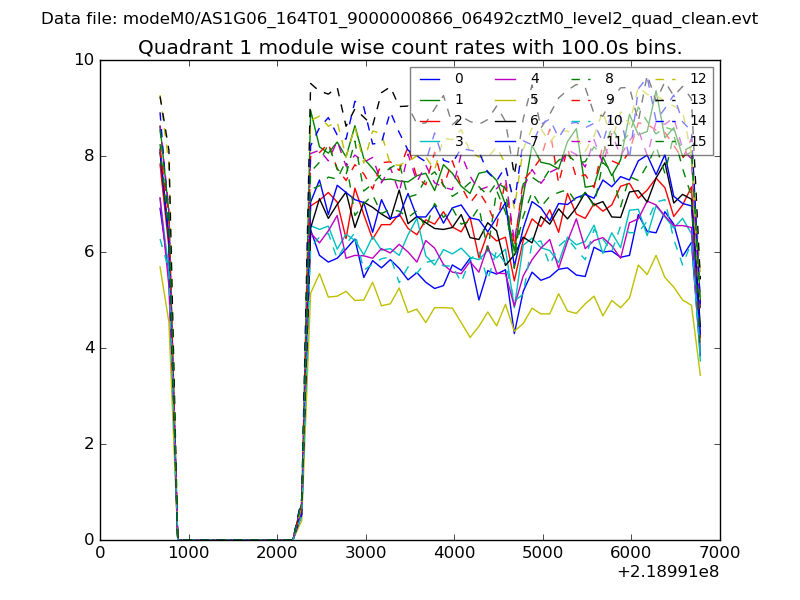
| Module-wise count rates for Quadrant A Data is divided into 100 sec bins |
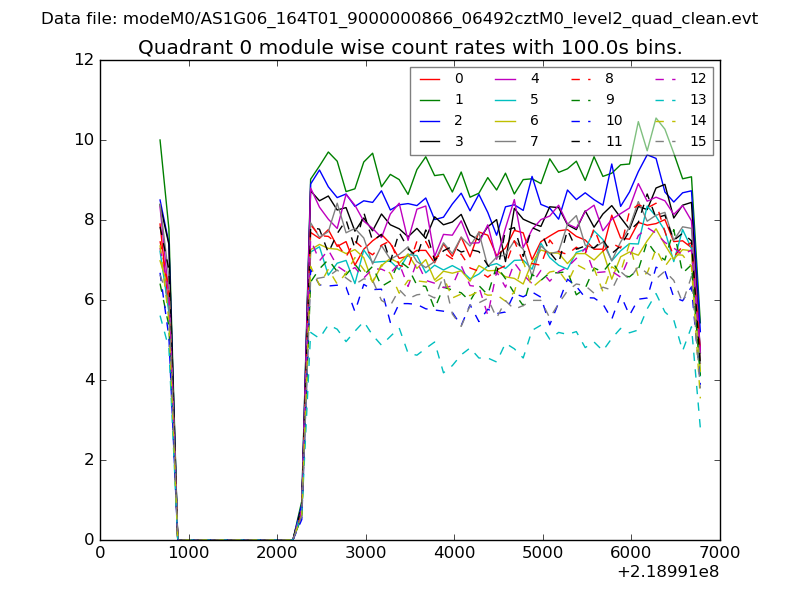 |
 |
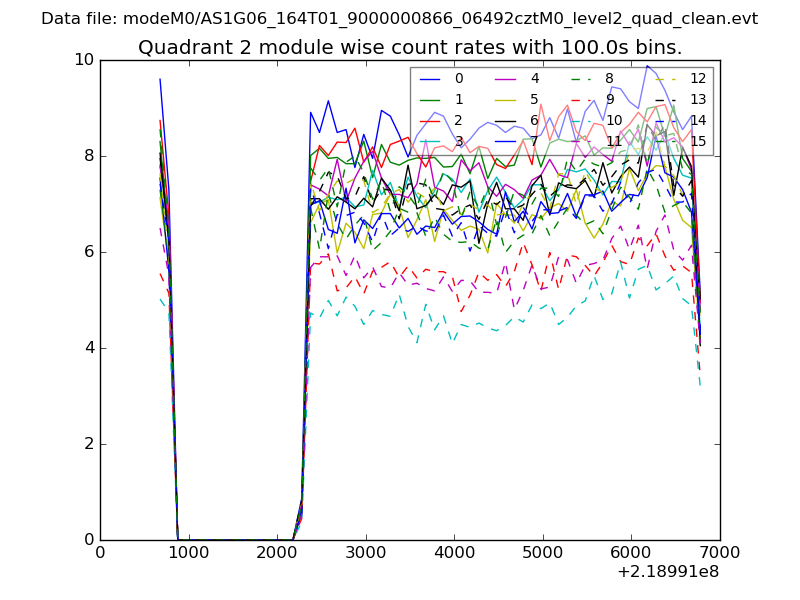
| Module-wise count rates for Quadrant B Data is divided into 100 sec bins |
 |
 |
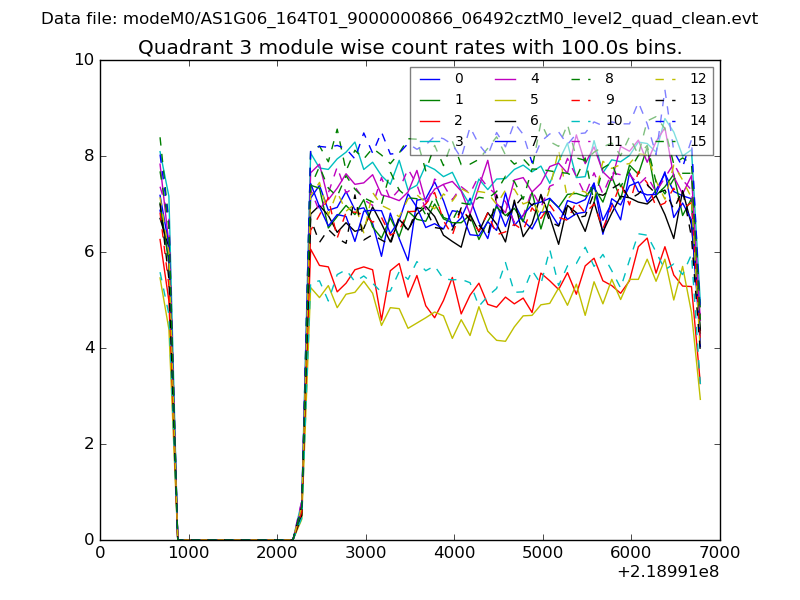
| Module-wise count rates for Quadrant C Data is divided into 100 sec bins |
 |
 |
| Module-wise count rates for Quadrant D Data is divided into 100 sec bins |
 |
 |
| Parameter | Plot |
|---|---|
| CZT HV Monitor | 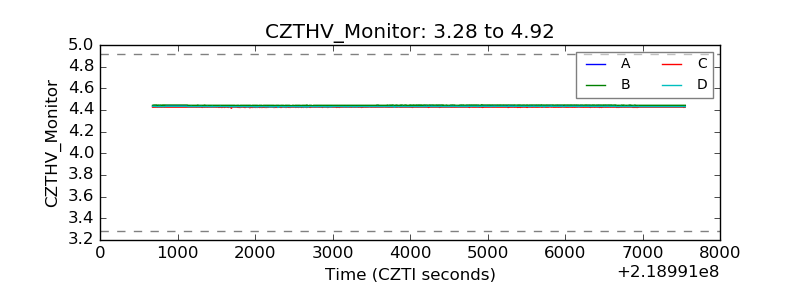 |
| D_VDD | 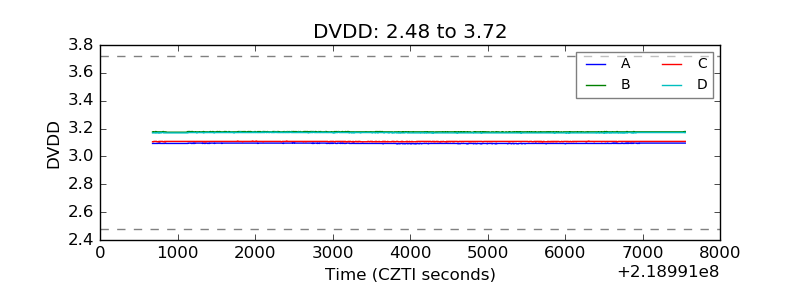 |
| Temperature 1 |  |
| Veto HV Monitor | 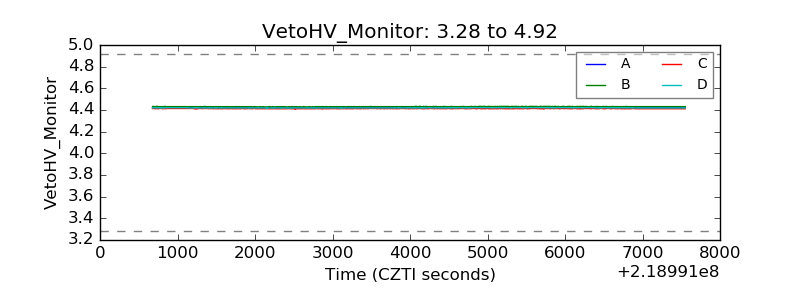 |
| Veto LLD | 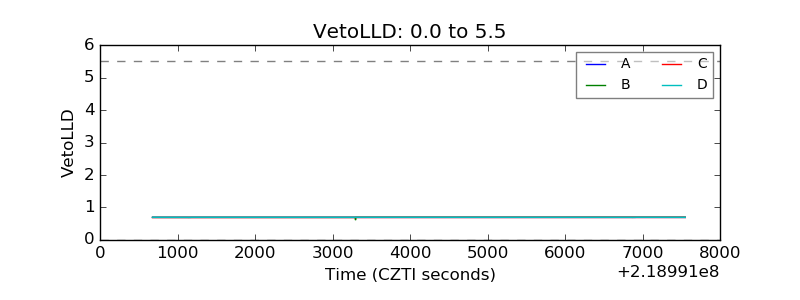 |
| Alpha Counter | 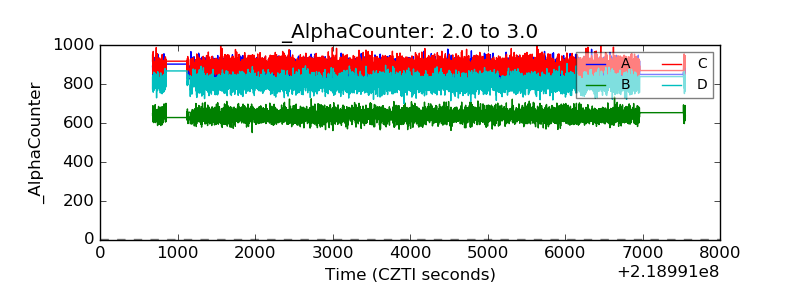 |
| _CPM_Rate | 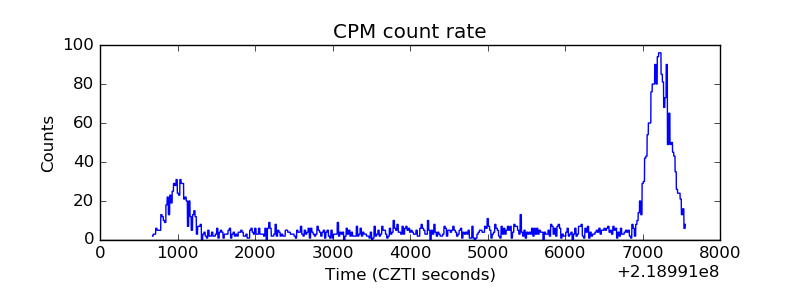 |
| CZT Counter | 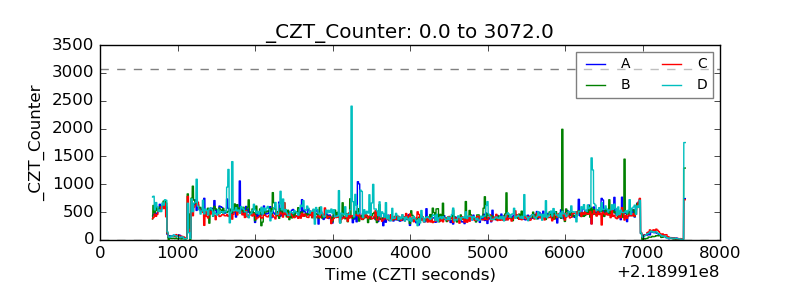 |
| +2.5 Volts monitor |  |
| +5 Volts monitor |  |
| _ROLL_ROT | 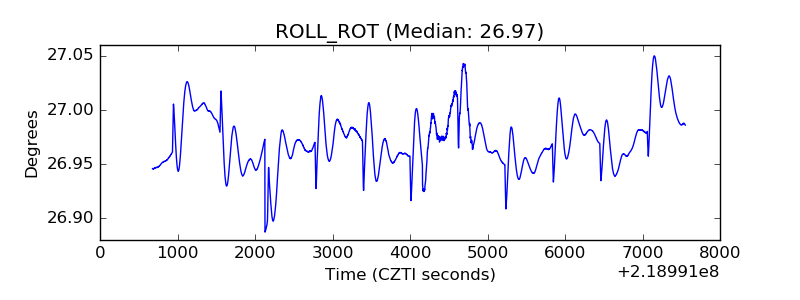 |
| _Roll_DEC | 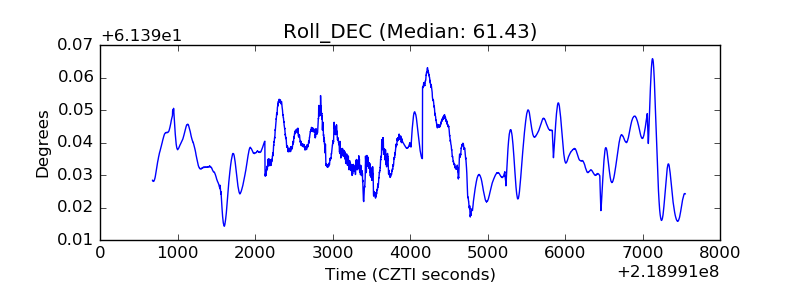 |
| _Roll_RA | 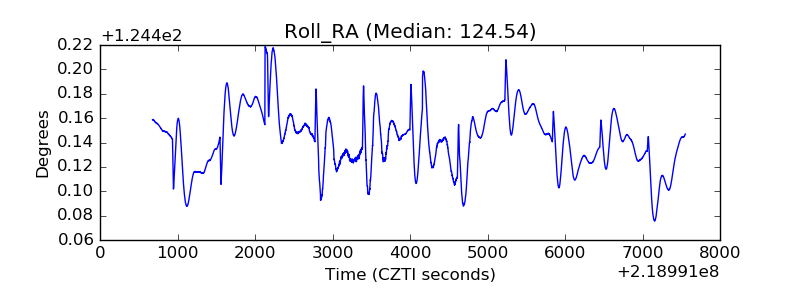 |
| Veto Counter | 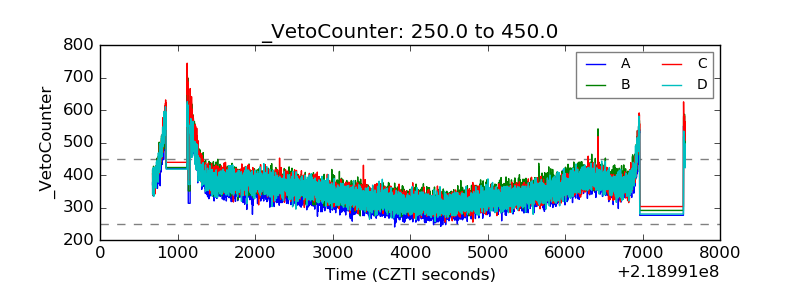 |