| Param | Original file | Final file |
|---|---|---|
| Filename | modeM0/AS1G06_164T01_9000000866_06493cztM0_level2.evt | modeM0/AS1G06_164T01_9000000866_06493cztM0_level2_quad_clean.evt |
| Size (bytes) | 262,984,320 | 57,378,240 |
| Size | 250.8 MB | 54.7 MB |
| Events in quadrant A | 1,809,411 | 370,493 |
| Events in quadrant B | 1,918,006 | 363,856 |
| Events in quadrant C | 1,715,364 | 362,614 |
| Events in quadrant D | 2,243,352 | 353,353 |
| Mode M0 | |||
|---|---|---|---|
| Quadrant | BADHDUFLAG | Total packets | Discarded packets |
| A | 0 | 8444 | 1 |
| B | 0 | 8663 | 1 |
| C | 0 | 8217 | 1 |
| D | 0 | 9384 | 1 |
| Mode SS | |||
|---|---|---|---|
| Quadrant | BADHDUFLAG | Total packets | Discarded packets |
| A | 0 | 82 | 0 |
| B | 0 | 82 | 0 |
| C | 0 | 82 | 0 |
| D | 0 | 82 | 0 |
| Mode M9 | |||
|---|---|---|---|
| Quadrant | BADHDUFLAG | Total packets | Discarded packets |
| A | 0 | 6 | 0 |
| B | 0 | 6 | 0 |
| C | 0 | 6 | 0 |
| D | 0 | 6 | 0 |
| Quadrant | Total seconds | Saturated seconds | Saturation percentage |
|---|---|---|---|
| A | 4075 | 25 | 0.613497% |
| B | 4075 | 44 | 1.079755% |
| C | 4075 | 13 | 0.319018% |
| D | 4075 | 52 | 1.276074% |
Noise dominated data is calculated using 1-second bins in cleaned event files. If a bin has >2000 counts, and if more than 50% of those come from <1% of pixels, then it is considered to be noise-dominated and hence unusable.
| Quadrant | # 1 sec bins | Bins with >0 counts | Bins with >2000 counts | High rate bins dominated by noise | Noise dominated (total time) | Noise dominated (detector-on time) | Marked lightcurve |
|---|---|---|---|---|---|---|---|
| A | 4640 | 4076 | 6 | 6 | 0.13% | 0.15% | 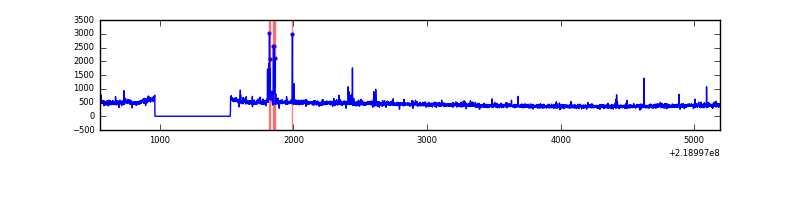 |
| B | 4640 | 4076 | 22 | 22 | 0.47% | 0.54% | 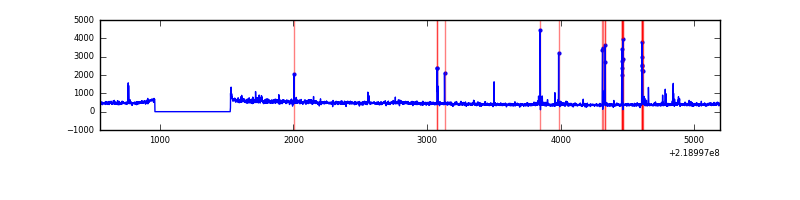 |
| C | 4640 | 4076 | 0 | 0 | 0.00% | 0.00% | 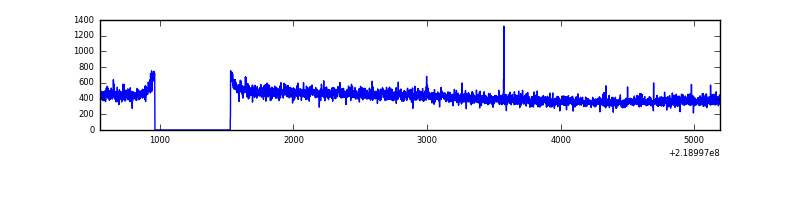 |
| D | 4640 | 4076 | 28 | 28 | 0.60% | 0.69% | 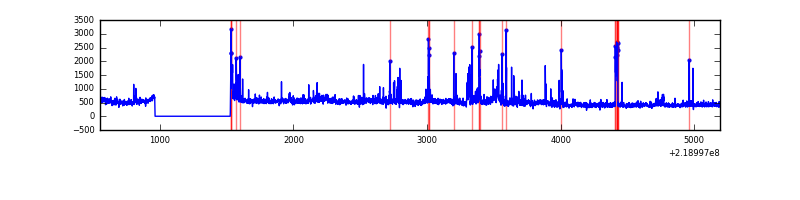 |
Top three noisy pixels from each quadrant. If the there are fewer than three noisy pixels in the level2.evt file, extra rows are filled as -1
| Pixel properties | Quadrant properties | ||||||
|---|---|---|---|---|---|---|---|
| Quadrant | DetID | PixID | Counts | Sigma | Mean | Median | Sigma |
| A | 15 | 174 | 38041 | 404.82 | 448 | 437 | 92.9 |
| A | 8 | 15 | 30438 | 322.97 | 448 | 437 | 92.9 |
| A | 15 | 236 | 6891 | 69.48 | 448 | 437 | 92.9 |
| B | 0 | 219 | 79213 | 906.6 | 449 | 438 | 86.9 |
| B | 0 | 214 | 37253 | 423.69 | 449 | 438 | 86.9 |
| B | 4 | 81 | 15538 | 173.78 | 449 | 438 | 86.9 |
| C | 1 | 16 | 3647 | 31.44 | 437 | 439 | 102.0 |
| C | 13 | 61 | 3421 | 29.23 | 437 | 439 | 102.0 |
| C | 9 | 54 | 2120 | 16.48 | 437 | 439 | 102.0 |
| D | 8 | 195 | 220466 | 2042.48 | 436 | 422 | 107.7 |
| D | 2 | 152 | 132359 | 1224.66 | 436 | 422 | 107.7 |
| D | 2 | 136 | 126650 | 1171.66 | 436 | 422 | 107.7 |
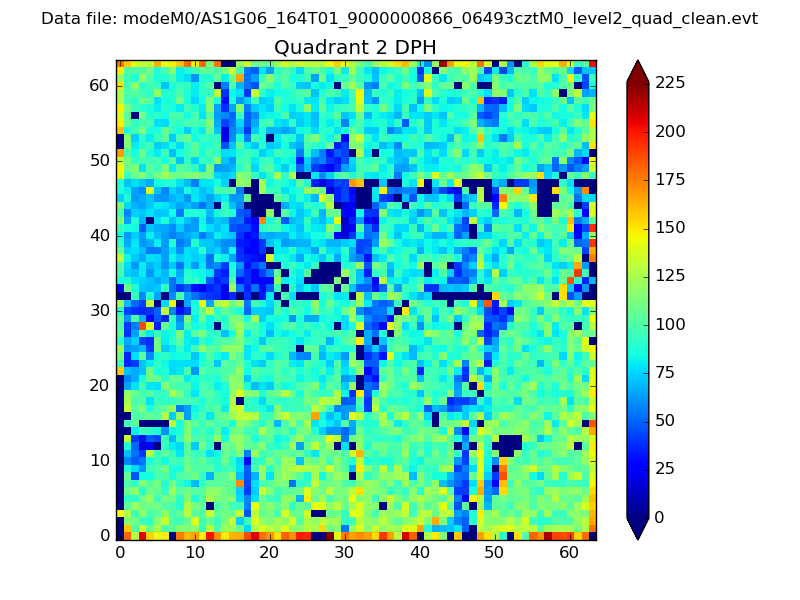
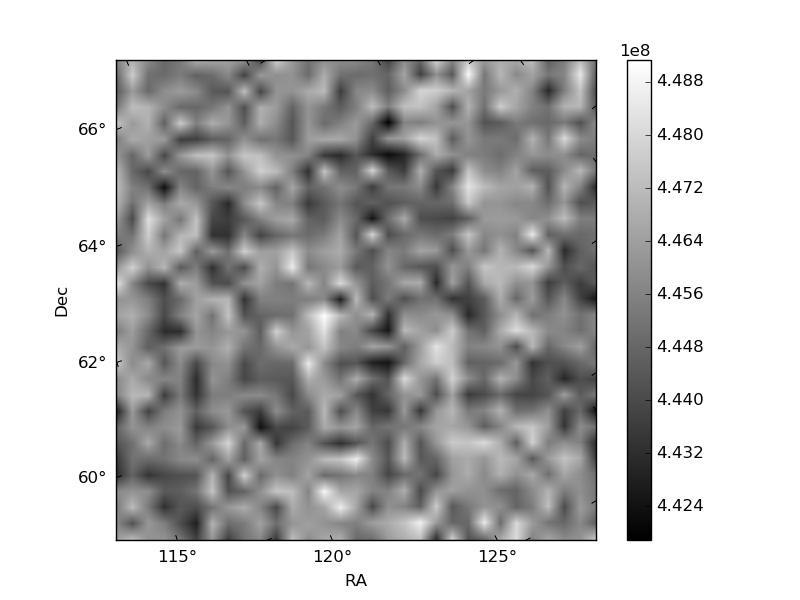
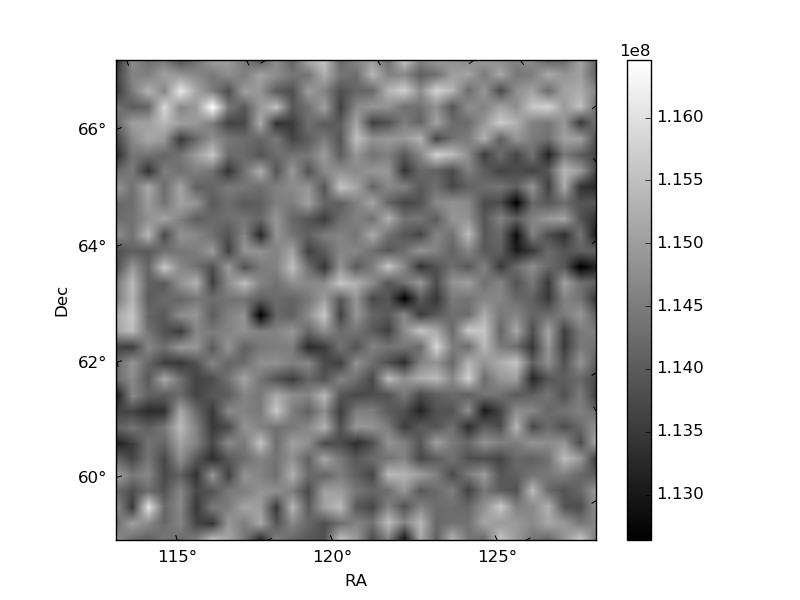
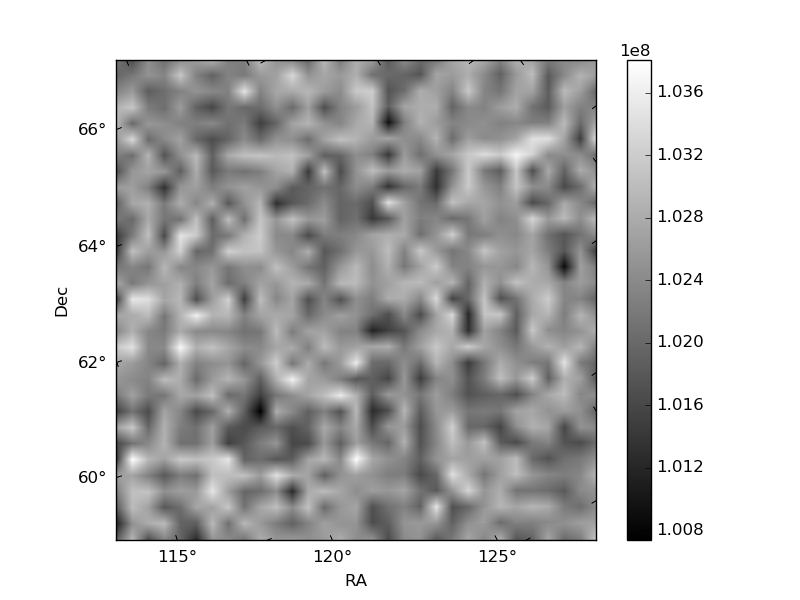
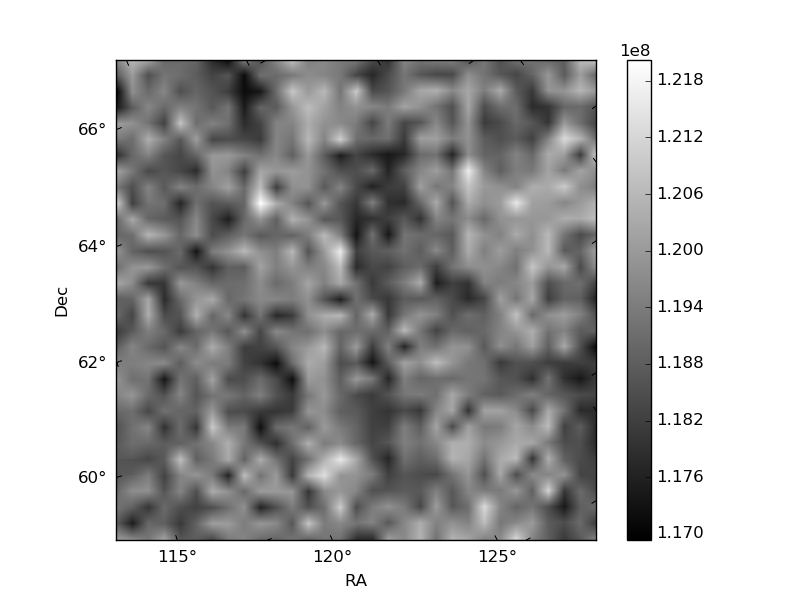
Histogram calculated using DETX and DETY for each event in the final _common_clean file
| Quadrant A | 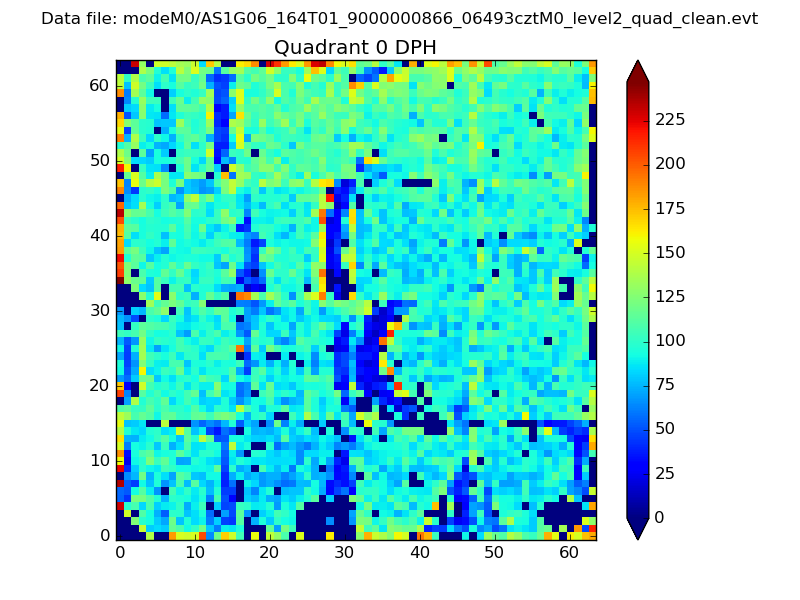 |
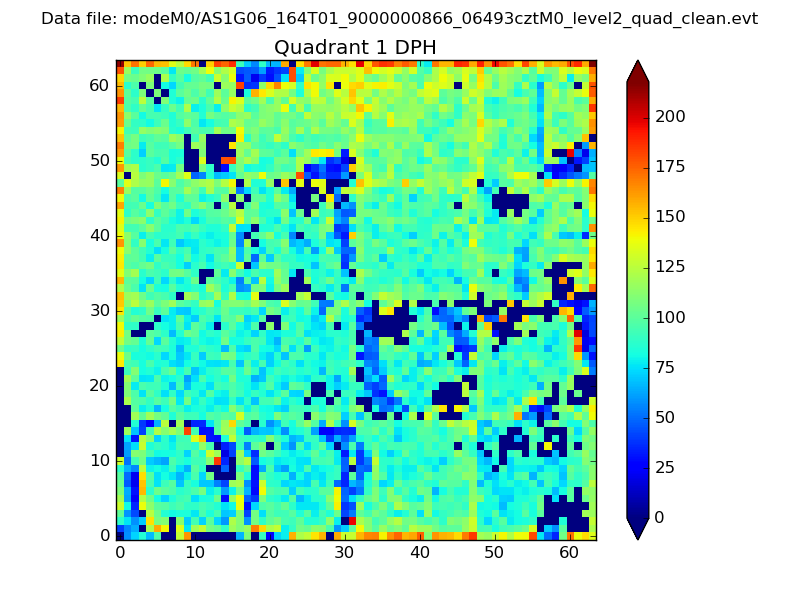 |
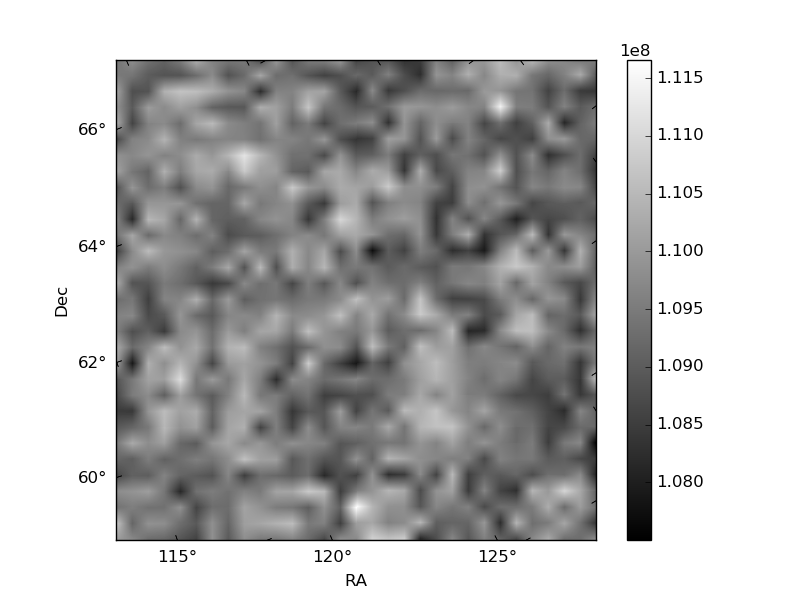
Quadrant B |
|---|---|---|---|
| Quadrant D | 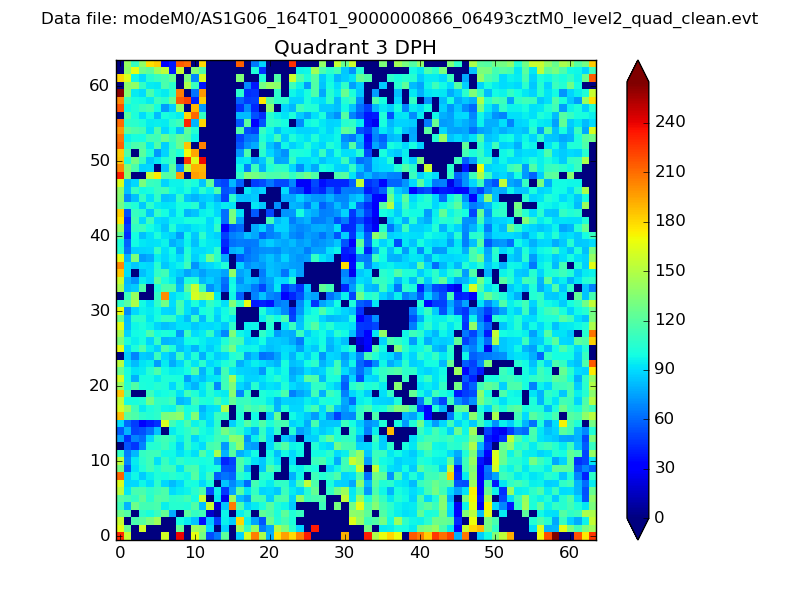 |
 |
Quadrant C |
| Plot type | Count rate plots | Images |
|---|---|---|
| Comparison with Poisson distribution Blue bars denote a histogram of data divided into 1 sec bins. Red curve is a Poisson curve with rate = median count rate of data. |
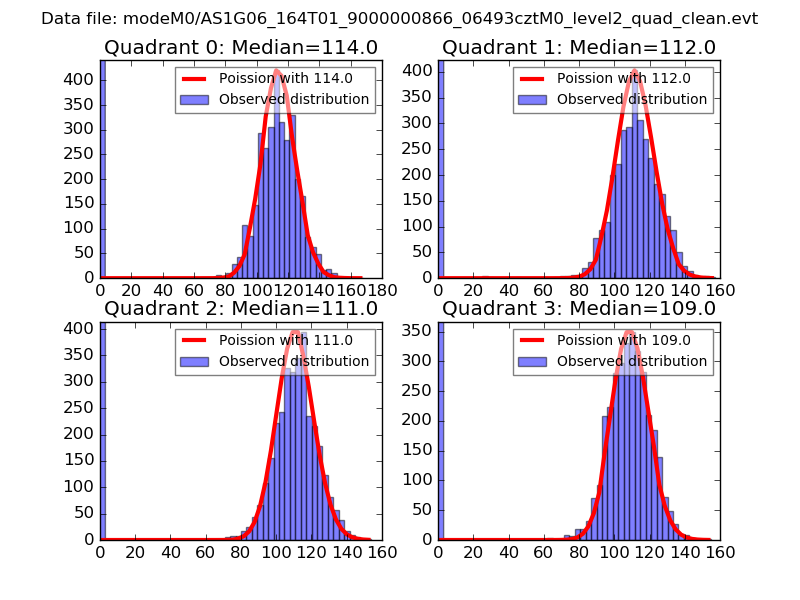 |
 |
| Quadrant-wise count rates Data is divided into 100 sec bins |
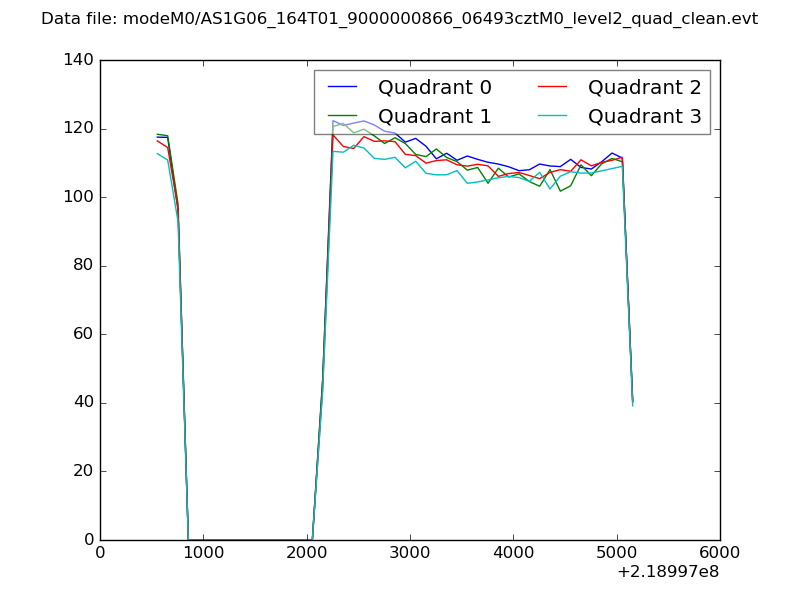 |
|
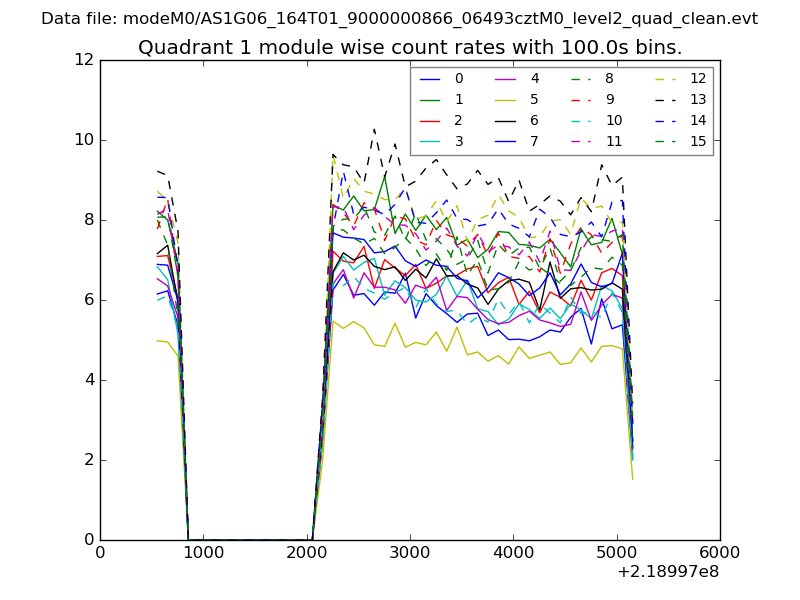
| Module-wise count rates for Quadrant A Data is divided into 100 sec bins |
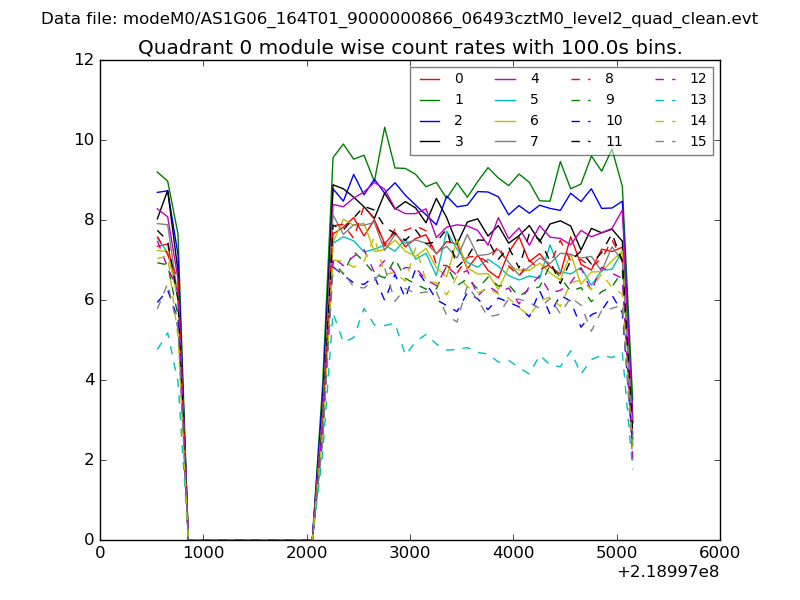 |
 |
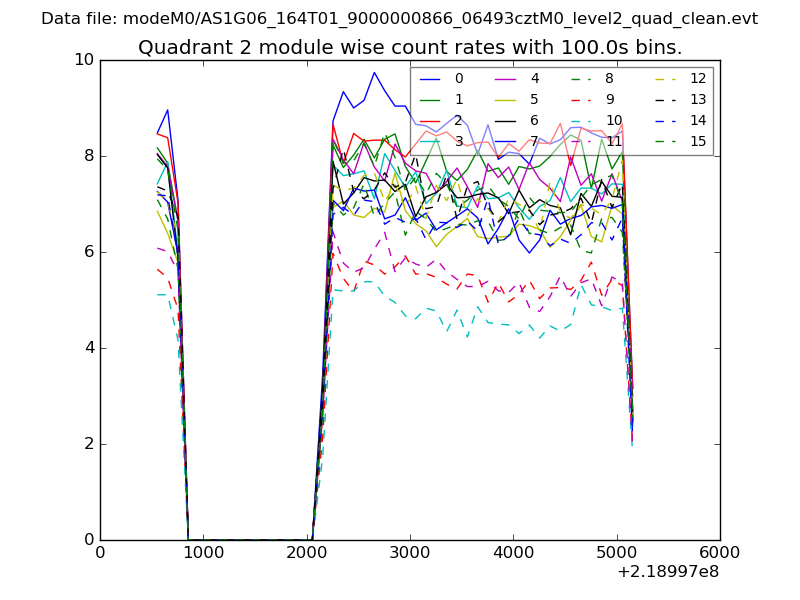
| Module-wise count rates for Quadrant B Data is divided into 100 sec bins |
 |
 |
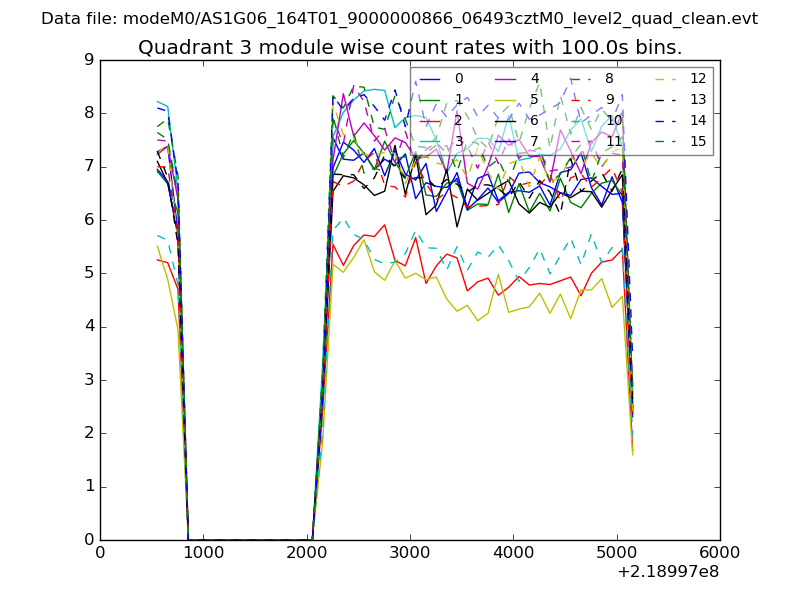
| Module-wise count rates for Quadrant C Data is divided into 100 sec bins |
 |
 |
| Module-wise count rates for Quadrant D Data is divided into 100 sec bins |
 |
 |
| Parameter | Plot |
|---|---|
| CZT HV Monitor | 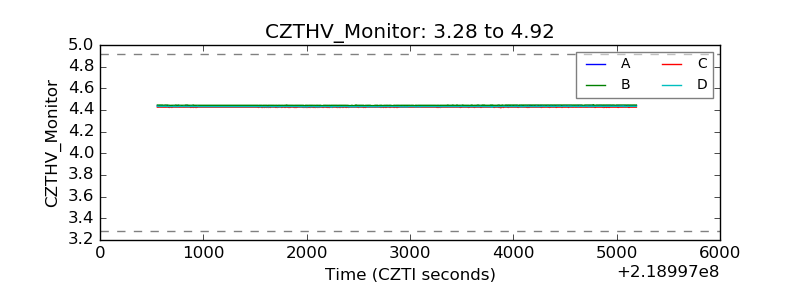 |
| D_VDD | 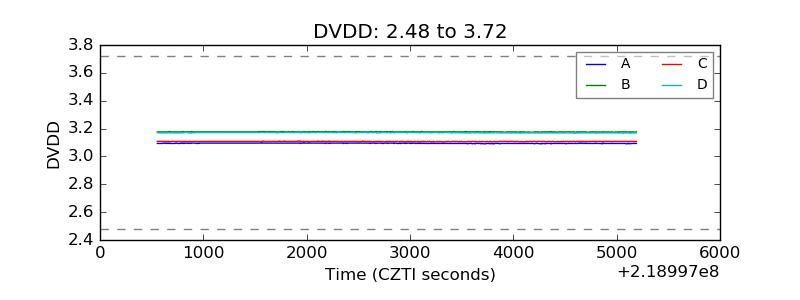 |
| Temperature 1 | 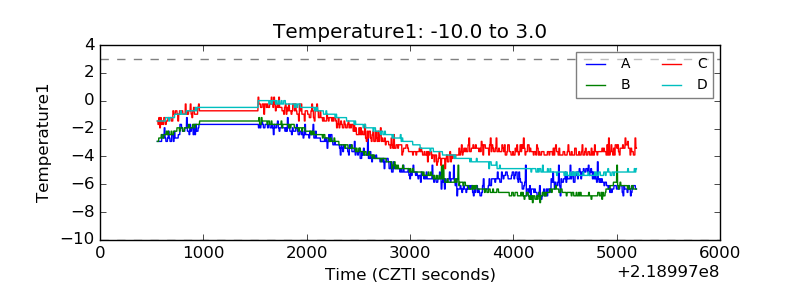 |
| Veto HV Monitor | 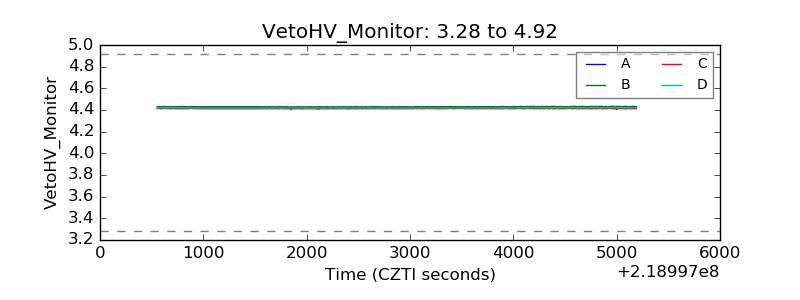 |
| Veto LLD | 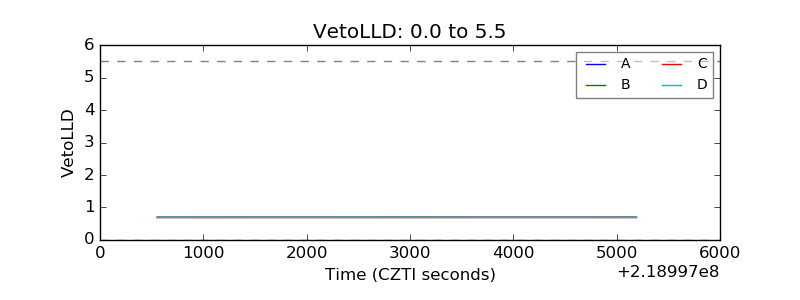 |
| Alpha Counter | 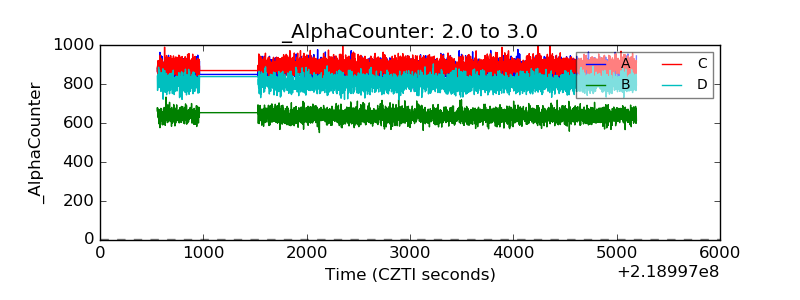 |
| _CPM_Rate | 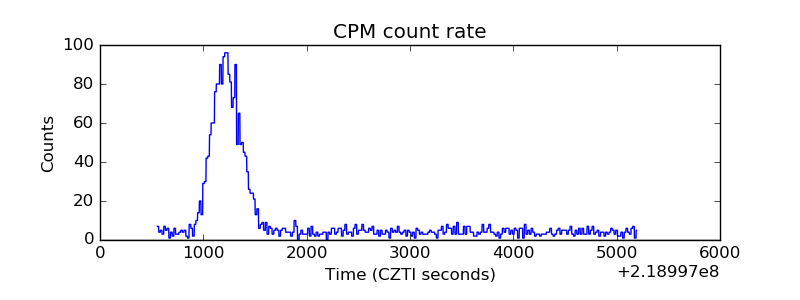 |
| CZT Counter | 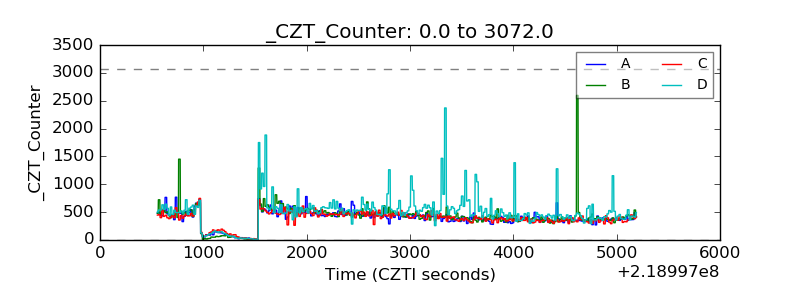 |
| +2.5 Volts monitor |  |
| +5 Volts monitor |  |
| _ROLL_ROT | 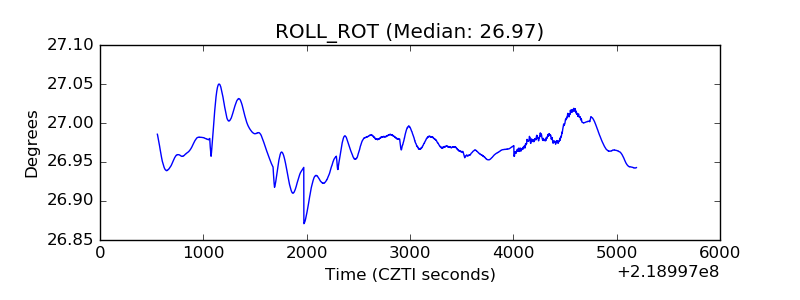 |
| _Roll_DEC | 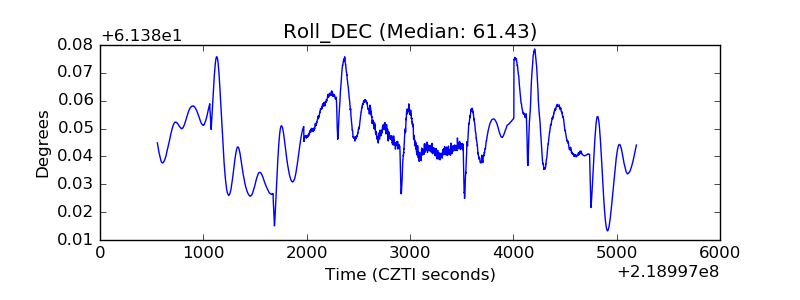 |
| _Roll_RA | 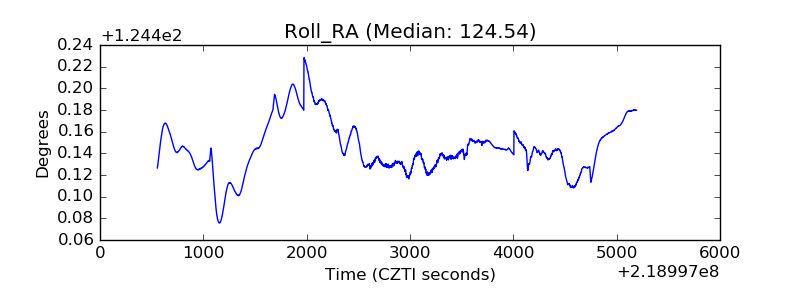 |
| Veto Counter | 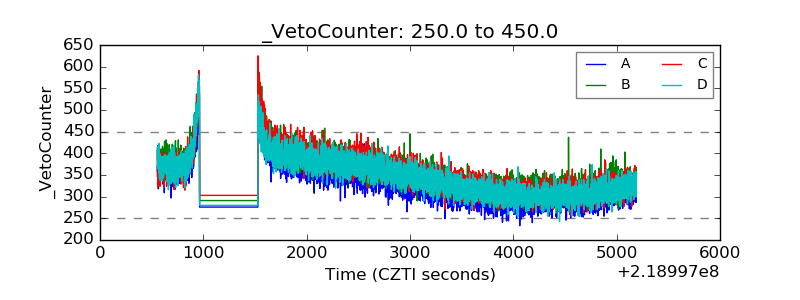 |