| Param | Original file | Final file |
|---|---|---|
| Filename | modeM0/AS1A02_175T01_9000000874cztM0_level2.fits | modeM0/AS1A02_175T01_9000000874cztM0_level2_quad_clean.evt |
| Size (bytes) | 182,355,840 | 165,807,360 |
| Size | 173.9 MB | 158.1 MB |
| Events in quadrant A | 1,082,506 | 946,083 |
| Events in quadrant B | 1,057,924 | 949,950 |
| Events in quadrant C | 1,066,804 | 899,855 |
| Events in quadrant D | 908,802 | 818,173 |
| Mode M9 | |||
|---|---|---|---|
| Quadrant | BADHDUFLAG | Total packets | Discarded packets |
| A | 0 | 30 | 0 |
| B | 0 | 30 | 0 |
| C | 0 | 30 | 0 |
| D | 0 | 30 | 0 |
| Mode SS | |||
|---|---|---|---|
| Quadrant | BADHDUFLAG | Total packets | Discarded packets |
| A | 0 | 416 | 0 |
| B | 0 | 416 | 0 |
| C | 0 | 416 | 0 |
| D | 0 | 416 | 0 |
| Mode M0 | |||
|---|---|---|---|
| Quadrant | BADHDUFLAG | Total packets | Discarded packets |
| A | 0 | 42778 | 0 |
| B | 0 | 42337 | 0 |
| C | 0 | 41448 | 0 |
| D | 0 | 59734 | 0 |
| Quadrant | Total seconds | Saturated seconds | Saturation percentage |
|---|---|---|---|
| A | 20429 | 152 | 0.744040% |
| B | 20429 | 132 | 0.646140% |
| C | 20429 | 70 | 0.342650% |
| D | 20429 | 574 | 2.809731% |
Noise dominated data is calculated using 1-second bins in cleaned event files. If a bin has >2000 counts, and if more than 50% of those come from <1% of pixels, then it is considered to be noise-dominated and hence unusable.
| Quadrant | # 1 sec bins | Bins with >0 counts | Bins with >2000 counts | High rate bins dominated by noise | Noise dominated (total time) | Noise dominated (detector-on time) | Marked lightcurve |
|---|---|---|---|---|---|---|---|
| A | 23351 | 20430 | 0 | 0 | 0.00% | 0.00% | 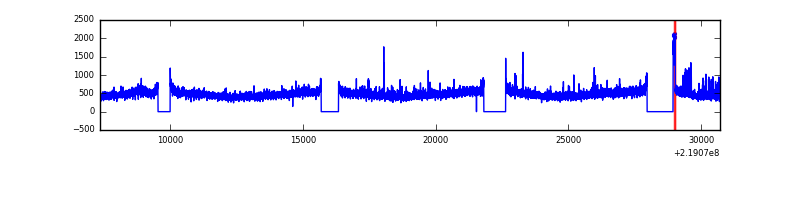 |
| B | 23351 | 20425 | 0 | 0 | 0.00% | 0.00% | 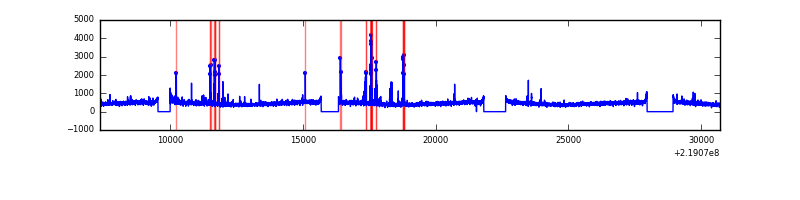 |
| C | 23351 | 20430 | 0 | 0 | 0.00% | 0.00% | 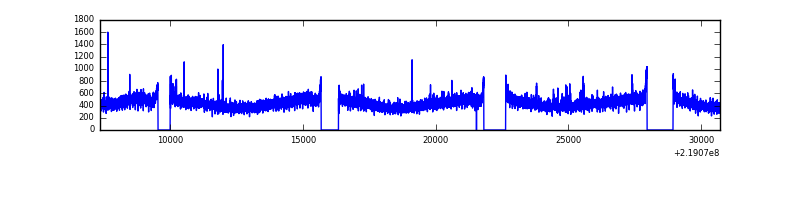 |
| D | 23351 | 20428 | 0 | 0 | 0.00% | 0.00% |  |
Top three noisy pixels from each quadrant. If the there are fewer than three noisy pixels in the level2.evt file, extra rows are filled as -1
| Pixel properties | Quadrant properties | ||||||
|---|---|---|---|---|---|---|---|
| Quadrant | DetID | PixID | Counts | Sigma | Mean | Median | Sigma |
| A | 0 | 29 | 1016 | 10.21 | 281 | 262 | 73.9 |
| A | 7 | 110 | 888 | 8.48 | 281 | 262 | 73.9 |
| A | 9 | 19 | 851 | 7.98 | 281 | 262 | 73.9 |
| B | 2 | 9 | 962 | 11.7 | 278 | 263 | 59.8 |
| B | 2 | 8 | 759 | 8.3 | 278 | 263 | 59.8 |
| B | 14 | 254 | 747 | 8.1 | 278 | 263 | 59.8 |
| C | 1 | 81 | 790 | 6.88 | 281 | 260 | 77.0 |
| C | 9 | 242 | 771 | 6.64 | 281 | 260 | 77.0 |
| C | 9 | 188 | 767 | 6.59 | 281 | 260 | 77.0 |
| D | 3 | 14 | 725 | 6.76 | 258 | 234 | 72.7 |
| D | 1 | 19 | 701 | 6.43 | 258 | 234 | 72.7 |
| D | 6 | 231 | 660 | 5.86 | 258 | 234 | 72.7 |
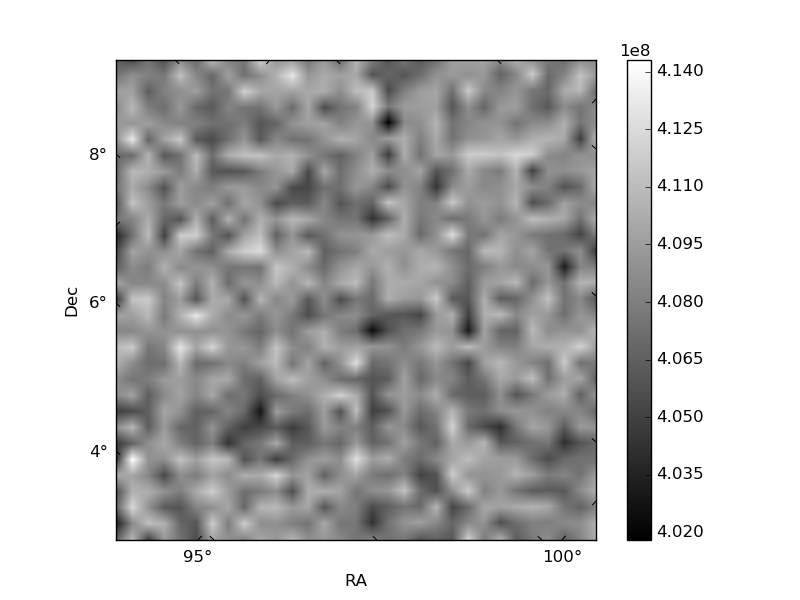
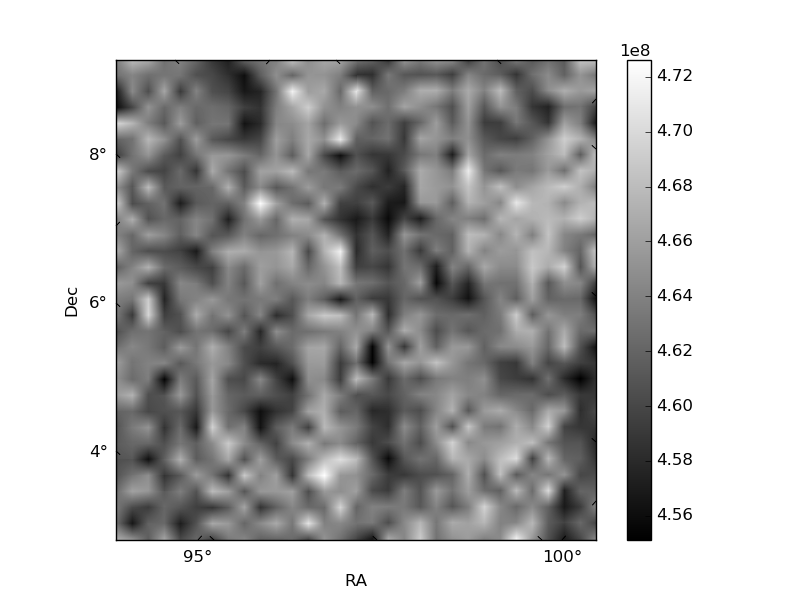
Histogram calculated using DETX and DETY for each event in the final _common_clean file
| Quadrant A |  |
 |
Quadrant B |
|---|---|---|---|
| Quadrant D |  |
 |
Quadrant C |
| Plot type | Count rate plots | Images |
|---|---|---|
| Comparison with Poisson distribution Blue bars denote a histogram of data divided into 1 sec bins. Red curve is a Poisson curve with rate = median count rate of data. |
 |
 |
| Quadrant-wise count rates Data is divided into 100 sec bins |
 |
|
| Module-wise count rates for Quadrant A Data is divided into 100 sec bins |
 |
 |
| Module-wise count rates for Quadrant B Data is divided into 100 sec bins |
 |
 |
| Module-wise count rates for Quadrant C Data is divided into 100 sec bins |
 |
 |
| Module-wise count rates for Quadrant D Data is divided into 100 sec bins |
 |
 |
| Parameter | Plot |
|---|---|
| CZT HV Monitor |  |
| D_VDD |  |
| Temperature 1 |  |
| Veto HV Monitor | 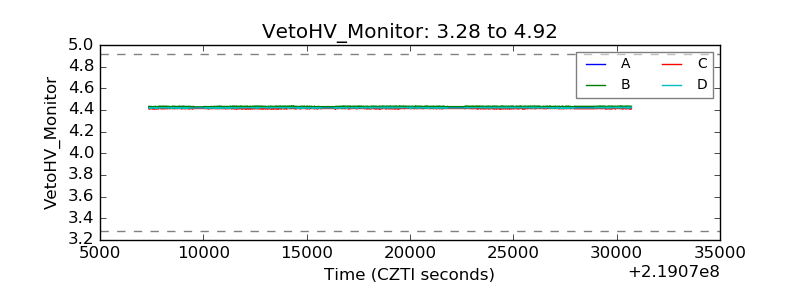 |
| Veto LLD |  |
| Alpha Counter |  |
| _CPM_Rate |  |
| CZT Counter |  |
| +2.5 Volts monitor | 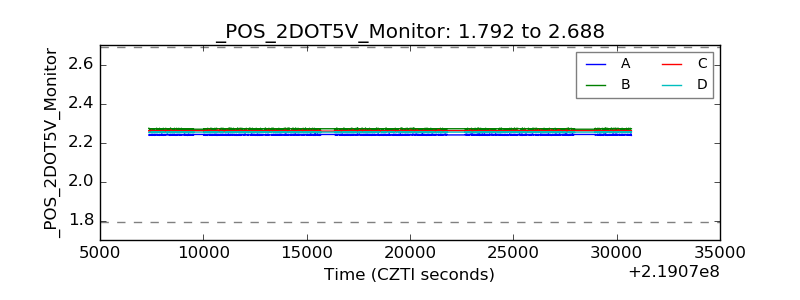 |
| +5 Volts monitor |  |
| _ROLL_ROT |  |
| _Roll_DEC |  |
| _Roll_RA | 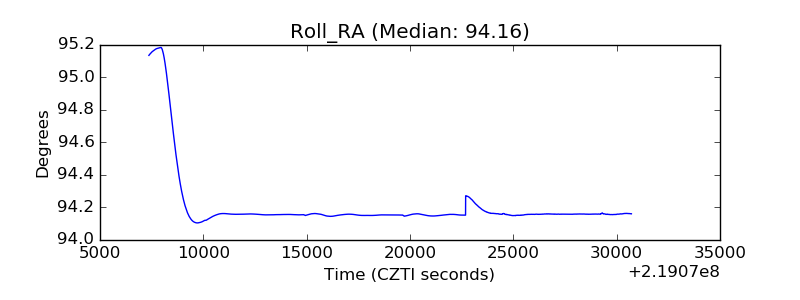 |
| Veto Counter |  |