| Param | Original file | Final file |
|---|---|---|
| Filename | modeM0/AS1A02_175T01_9000000874_06507cztM0_level2.evt | modeM0/AS1A02_175T01_9000000874_06507cztM0_level2_quad_clean.evt |
| Size (bytes) | 736,485,120 | 115,073,280 |
| Size | 702.4 MB | 109.7 MB |
| Events in quadrant A | 4,673,838 | 712,159 |
| Events in quadrant B | 4,709,440 | 717,225 |
| Events in quadrant C | 4,347,051 | 704,670 |
| Events in quadrant D | 7,907,419 | 668,004 |
| Mode M9 | |||
|---|---|---|---|
| Quadrant | BADHDUFLAG | Total packets | Discarded packets |
| A | 0 | 12 | 0 |
| B | 0 | 12 | 0 |
| C | 0 | 12 | 0 |
| D | 0 | 12 | 0 |
| Mode SS | |||
|---|---|---|---|
| Quadrant | BADHDUFLAG | Total packets | Discarded packets |
| A | 0 | 200 | 0 |
| B | 0 | 200 | 0 |
| C | 0 | 200 | 0 |
| D | 0 | 200 | 0 |
| Mode M0 | |||
|---|---|---|---|
| Quadrant | BADHDUFLAG | Total packets | Discarded packets |
| A | 0 | 20331 | 3 |
| B | 0 | 20678 | 2 |
| C | 0 | 19978 | 2 |
| D | 0 | 30558 | 2 |
| Quadrant | Total seconds | Saturated seconds | Saturation percentage |
|---|---|---|---|
| A | 9854 | 52 | 0.527704% |
| B | 9854 | 85 | 0.862594% |
| C | 9854 | 39 | 0.395778% |
| D | 9854 | 366 | 3.714228% |
Noise dominated data is calculated using 1-second bins in cleaned event files. If a bin has >2000 counts, and if more than 50% of those come from <1% of pixels, then it is considered to be noise-dominated and hence unusable.
| Quadrant | # 1 sec bins | Bins with >0 counts | Bins with >2000 counts | High rate bins dominated by noise | Noise dominated (total time) | Noise dominated (detector-on time) | Marked lightcurve |
|---|---|---|---|---|---|---|---|
| A | 10969 | 9856 | 0 | 0 | 0.00% | 0.00% | 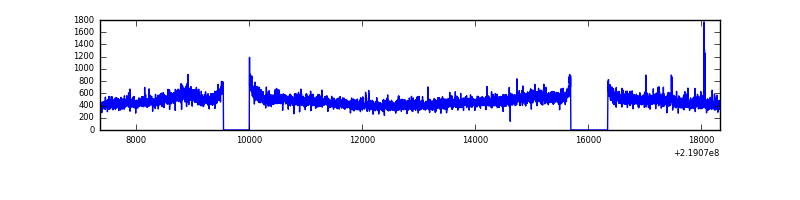 |
| B | 10969 | 9856 | 29 | 29 | 0.26% | 0.29% | 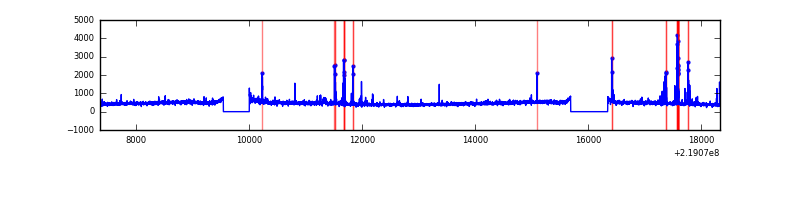 |
| C | 10969 | 9856 | 0 | 0 | 0.00% | 0.00% | 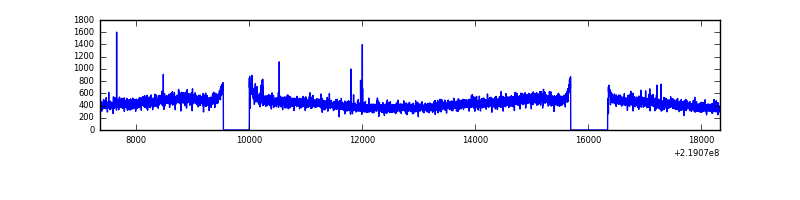 |
| D | 10969 | 9856 | 181 | 181 | 1.65% | 1.84% | 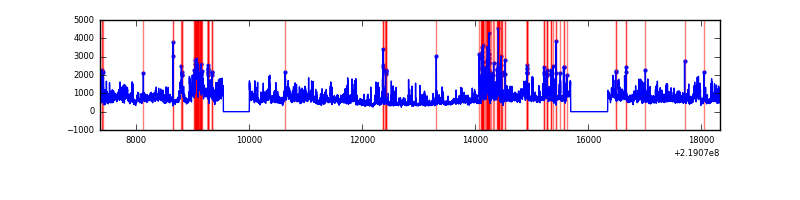 |
Top three noisy pixels from each quadrant. If the there are fewer than three noisy pixels in the level2.evt file, extra rows are filled as -1
| Pixel properties | Quadrant properties | ||||||
|---|---|---|---|---|---|---|---|
| Quadrant | DetID | PixID | Counts | Sigma | Mean | Median | Sigma |
| A | 8 | 15 | 267190 | 1141.27 | 1143 | 1117 | 233.1 |
| A | 0 | 226 | 10877 | 41.86 | 1143 | 1117 | 233.1 |
| A | 12 | 194 | 10673 | 40.99 | 1143 | 1117 | 233.1 |
| B | 0 | 219 | 83231 | 371.24 | 1146 | 1117 | 221.2 |
| B | 4 | 172 | 69179 | 307.71 | 1146 | 1117 | 221.2 |
| B | 4 | 48 | 51823 | 229.25 | 1146 | 1117 | 221.2 |
| C | 4 | 254 | 11890 | 41.96 | 1105 | 1112 | 256.9 |
| C | 13 | 61 | 8715 | 29.6 | 1105 | 1112 | 256.9 |
| C | 12 | 4 | 6695 | 21.73 | 1105 | 1112 | 256.9 |
| D | 2 | 152 | 3535561 | 13220.35 | 1092 | 1057 | 267.4 |
| D | 2 | 14 | 109374 | 405.15 | 1092 | 1057 | 267.4 |
| D | 13 | 137 | 43517 | 158.82 | 1092 | 1057 | 267.4 |
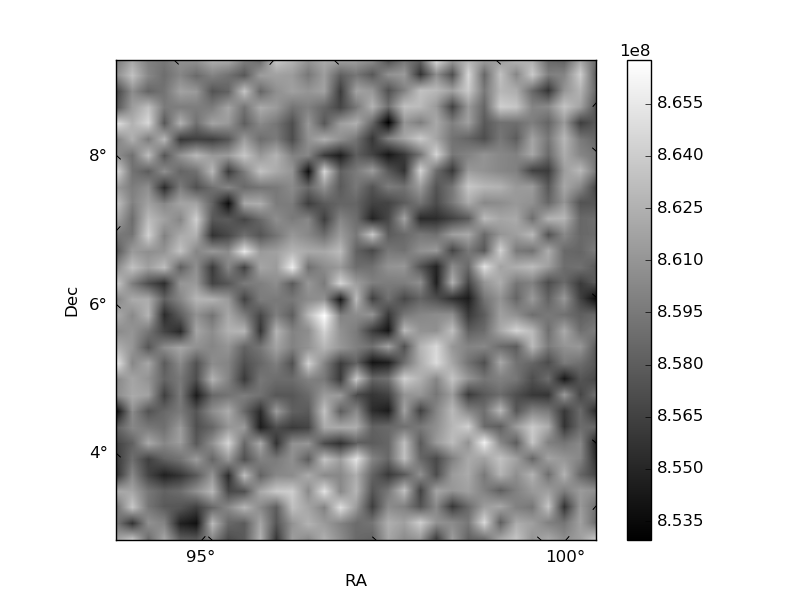
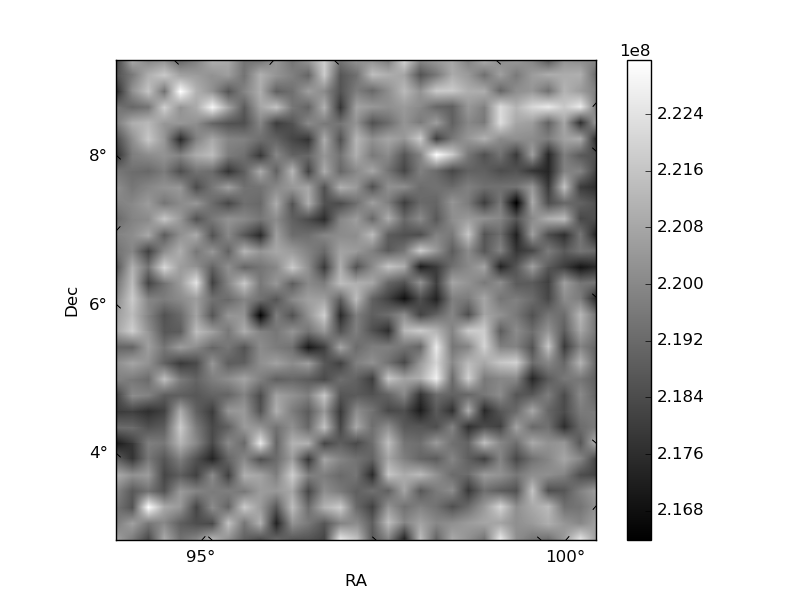
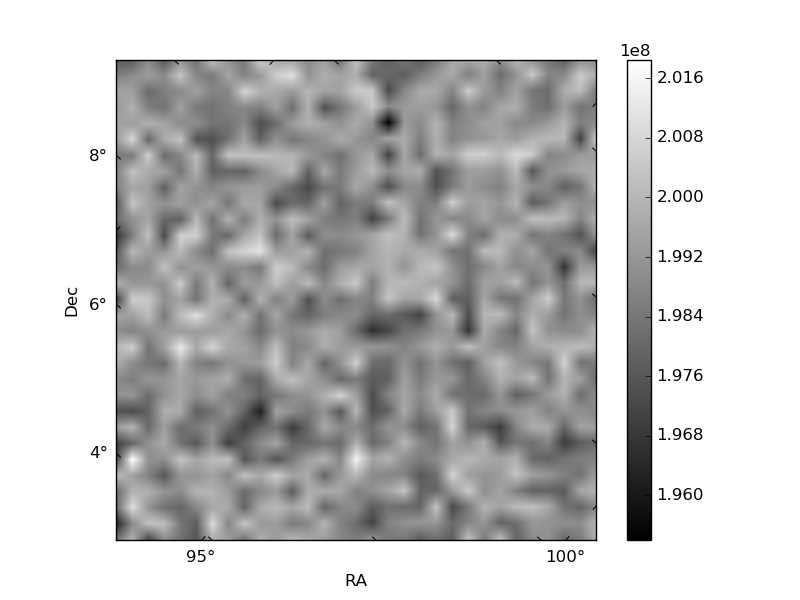
Histogram calculated using DETX and DETY for each event in the final _common_clean file
| Quadrant A | 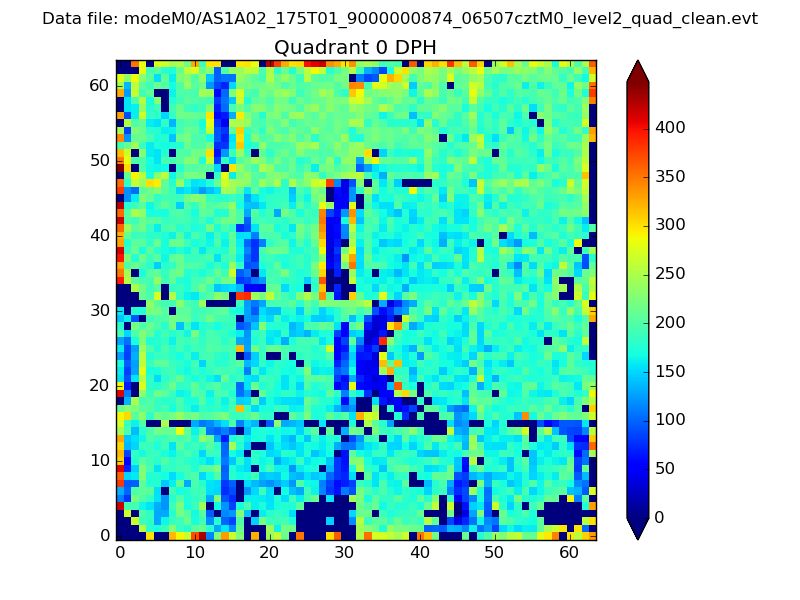 |
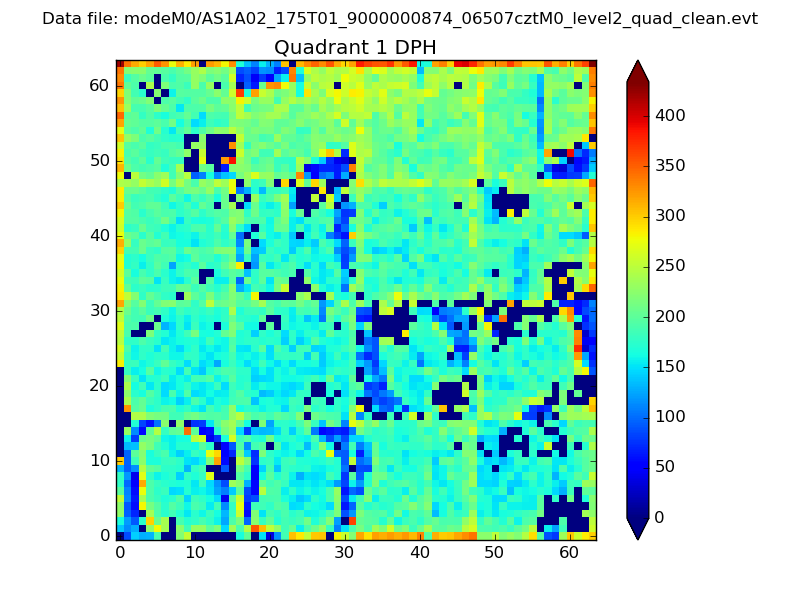 |
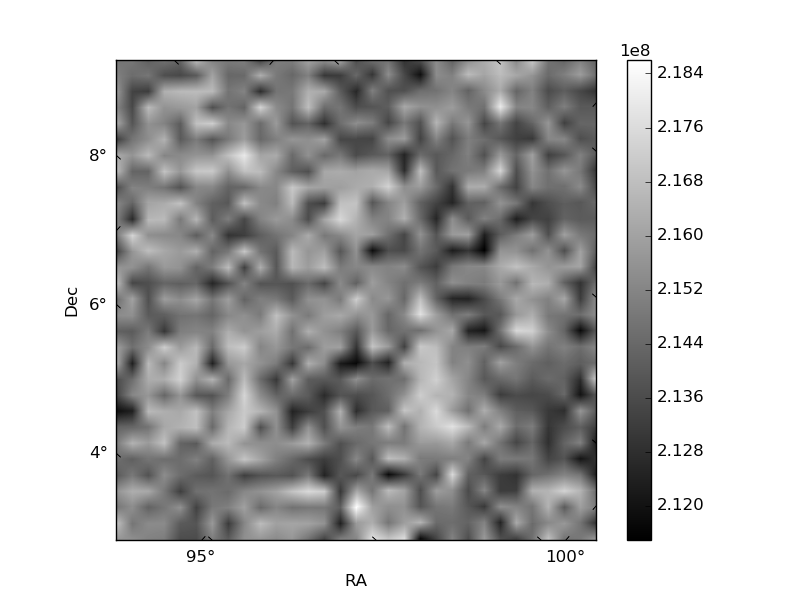
Quadrant B |
|---|---|---|---|
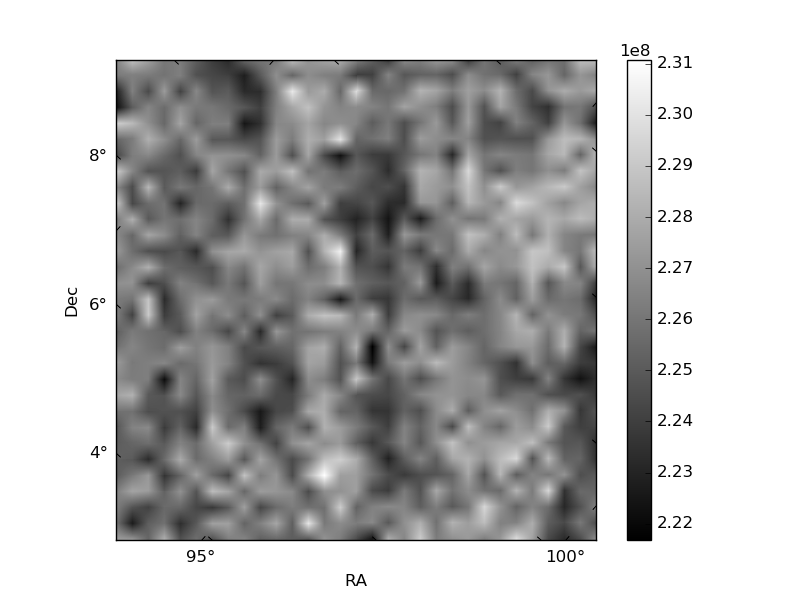
| Quadrant D | 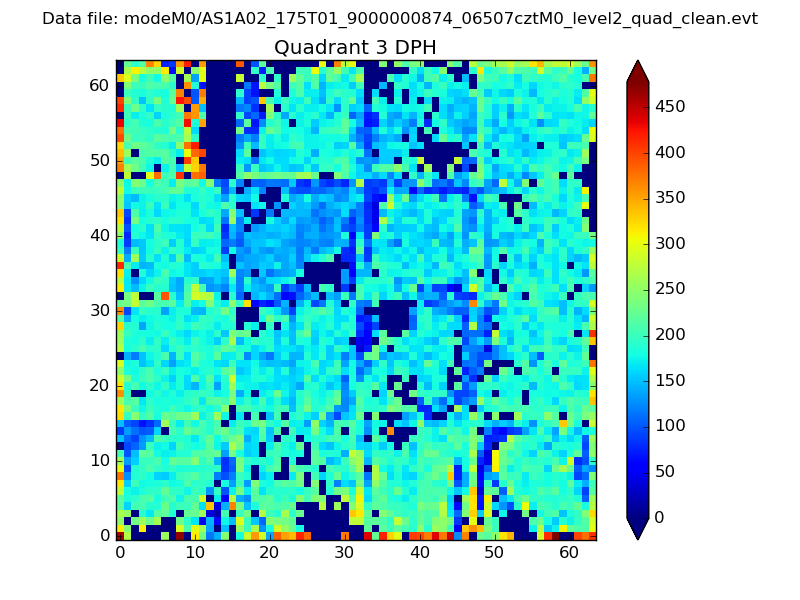 |
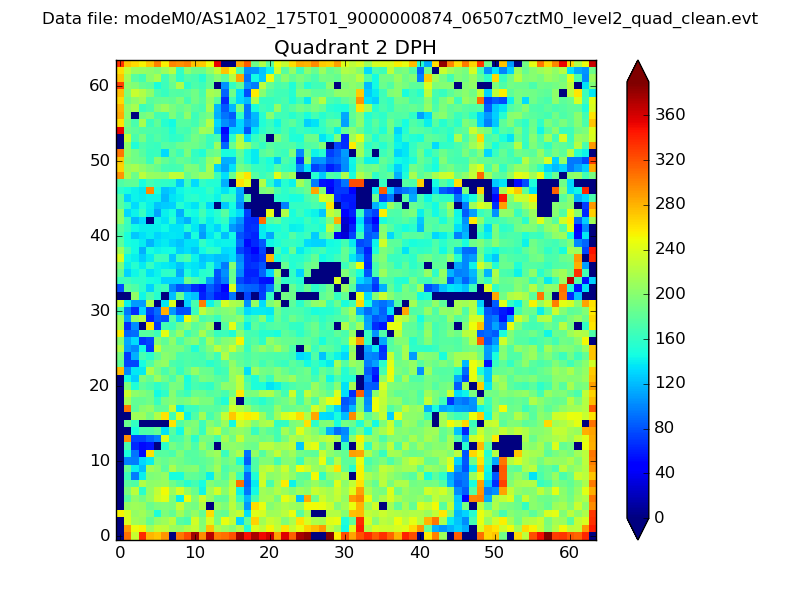 |
Quadrant C |
| Plot type | Count rate plots | Images |
|---|---|---|
| Comparison with Poisson distribution Blue bars denote a histogram of data divided into 1 sec bins. Red curve is a Poisson curve with rate = median count rate of data. |
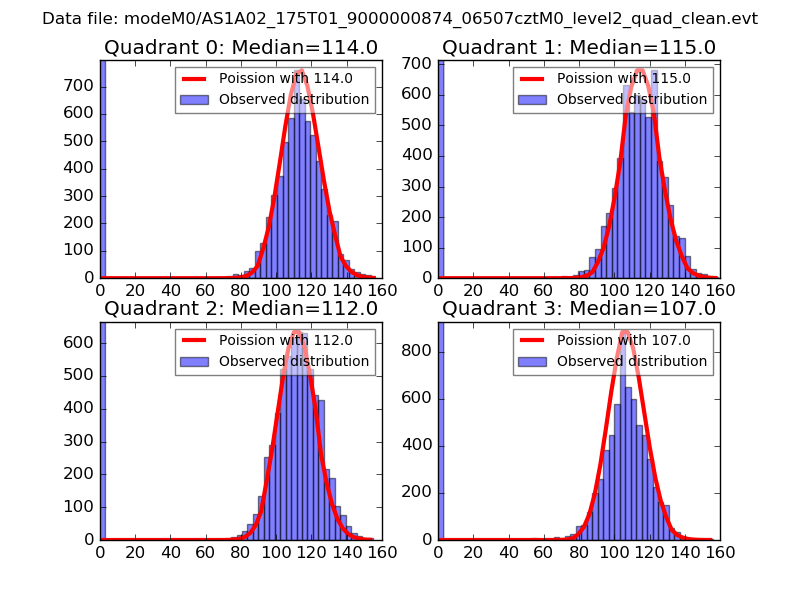 |
 |
| Quadrant-wise count rates Data is divided into 100 sec bins |
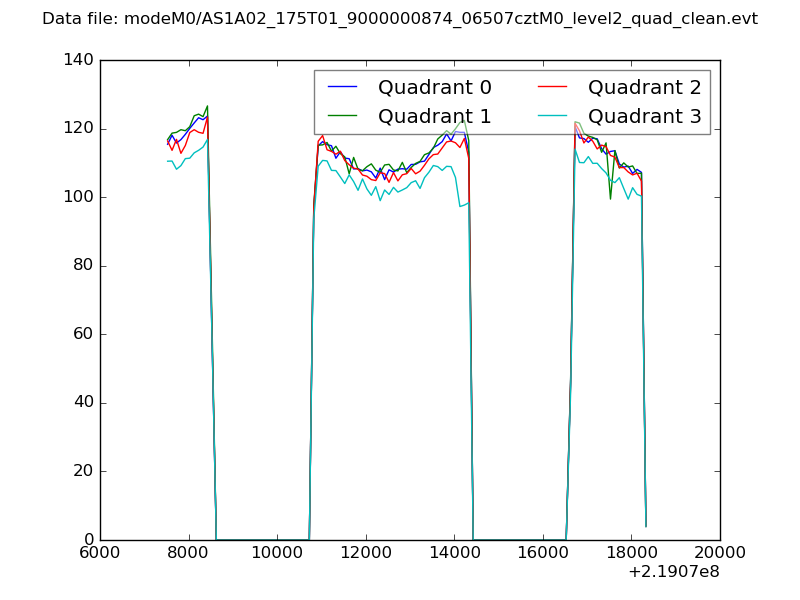 |
|
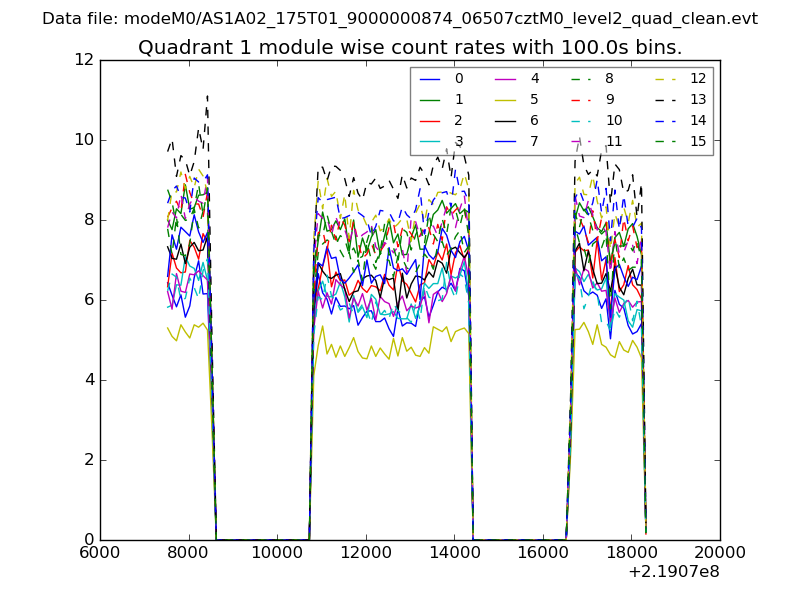
| Module-wise count rates for Quadrant A Data is divided into 100 sec bins |
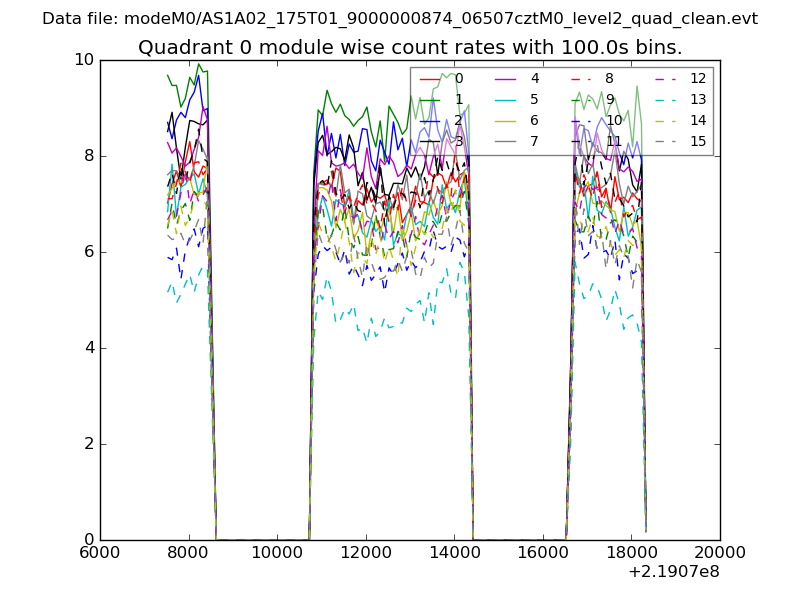 |
 |
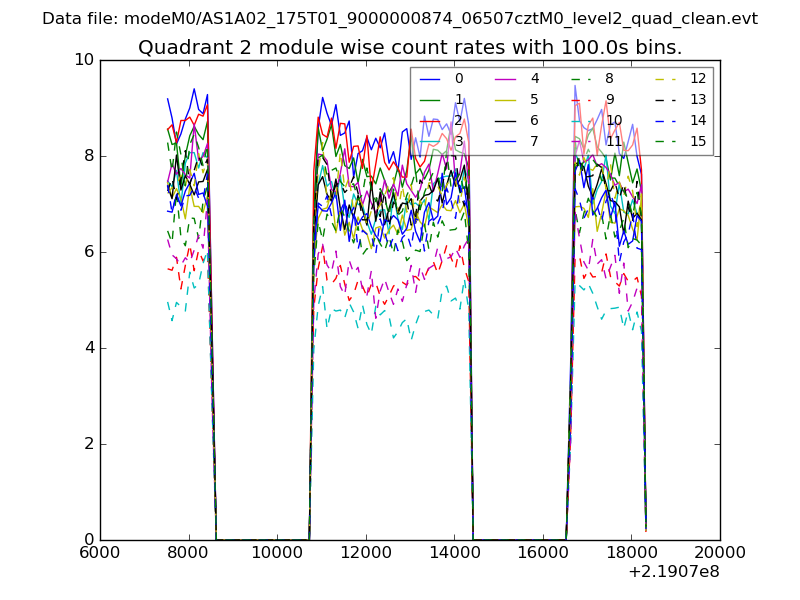
| Module-wise count rates for Quadrant B Data is divided into 100 sec bins |
 |
 |
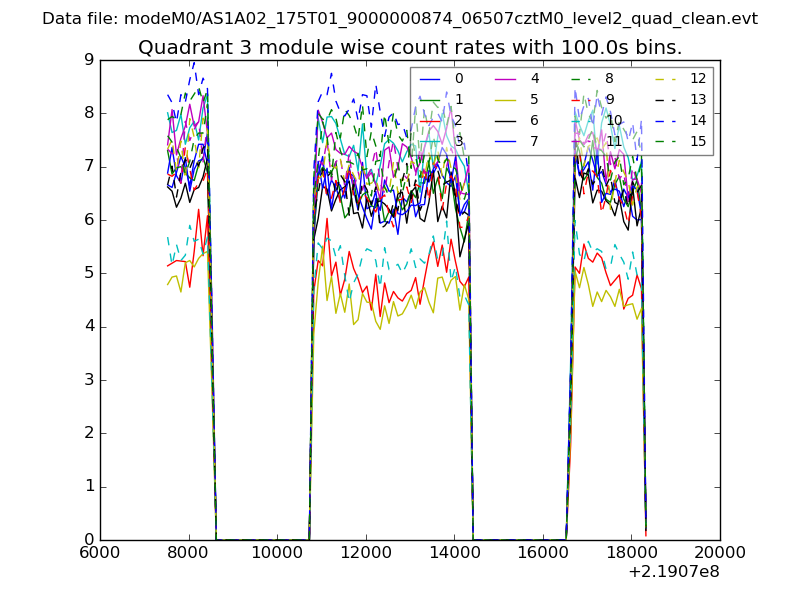
| Module-wise count rates for Quadrant C Data is divided into 100 sec bins |
 |
 |
| Module-wise count rates for Quadrant D Data is divided into 100 sec bins |
 |
 |
| Parameter | Plot |
|---|---|
| CZT HV Monitor | 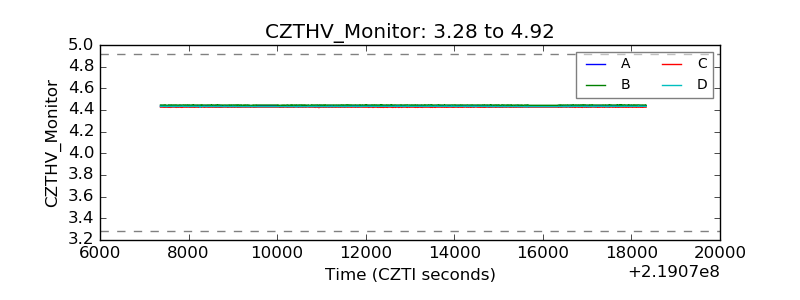 |
| D_VDD | 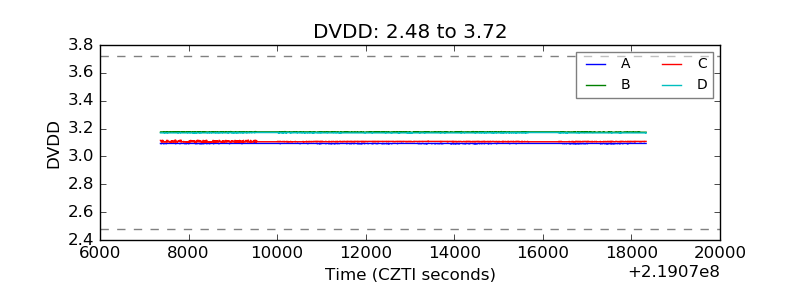 |
| Temperature 1 | 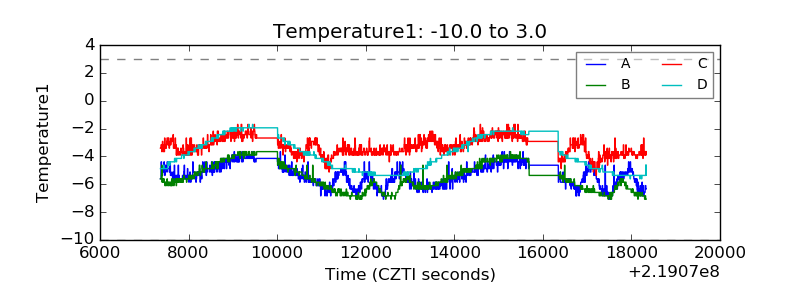 |
| Veto HV Monitor | 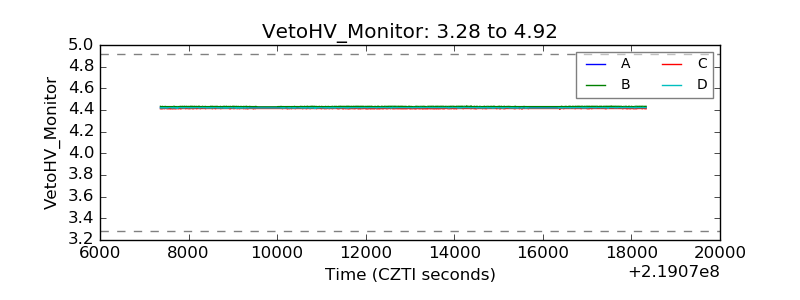 |
| Veto LLD | 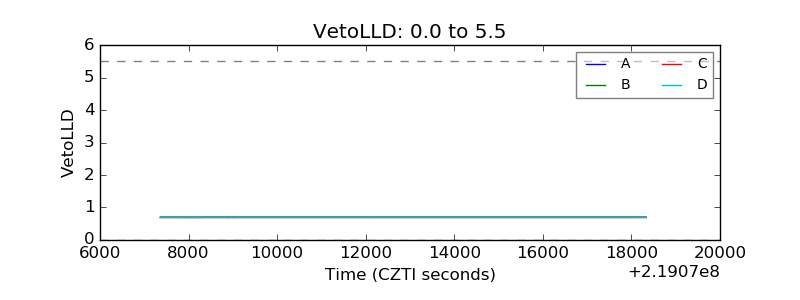 |
| Alpha Counter | 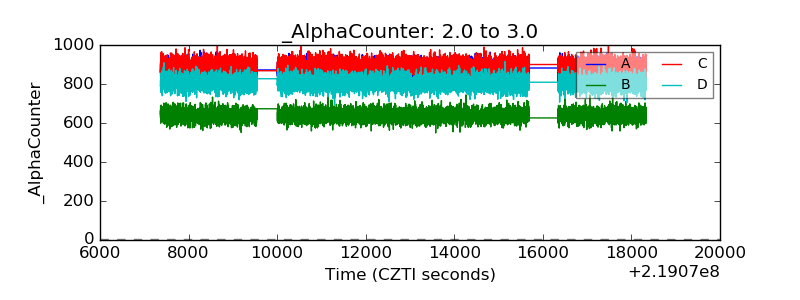 |
| _CPM_Rate | 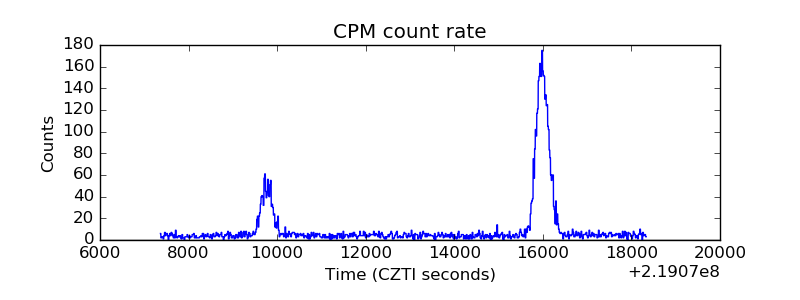 |
| CZT Counter | 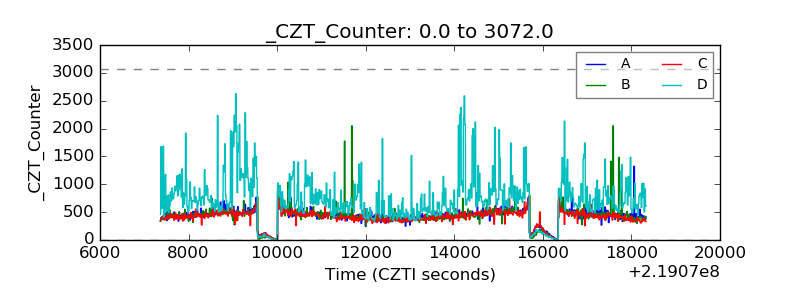 |
| +2.5 Volts monitor |  |
| +5 Volts monitor |  |
| _ROLL_ROT | 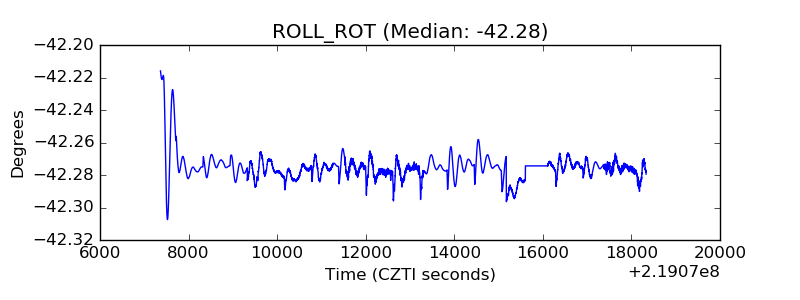 |
| _Roll_DEC | 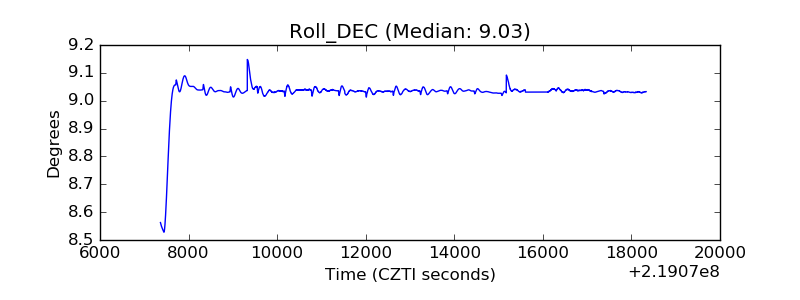 |
| _Roll_RA | 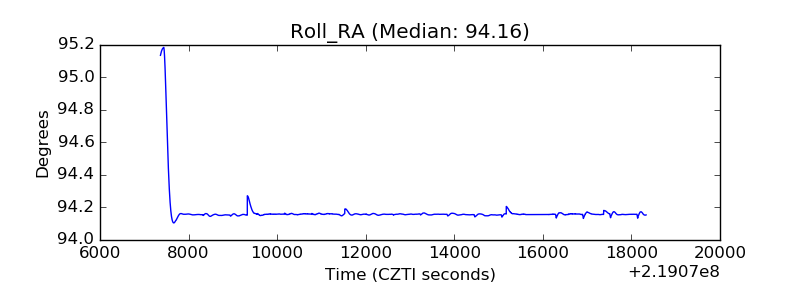 |
| Veto Counter | 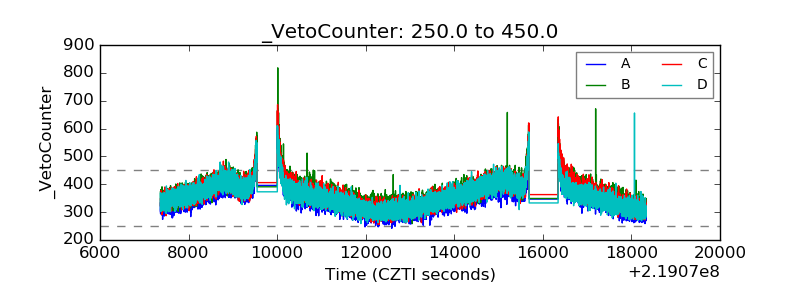 |