| Param | Original file | Final file |
|---|---|---|
| Filename | modeM0/AS1A02_175T01_9000000874_06508cztM0_level2.evt | modeM0/AS1A02_175T01_9000000874_06508cztM0_level2_quad_clean.evt |
| Size (bytes) | 775,480,320 | 137,442,240 |
| Size | 739.6 MB | 131.1 MB |
| Events in quadrant A | 5,390,008 | 860,390 |
| Events in quadrant B | 4,957,904 | 879,799 |
| Events in quadrant C | 4,789,043 | 854,670 |
| Events in quadrant D | 7,608,573 | 811,049 |
| Mode M9 | |||
|---|---|---|---|
| Quadrant | BADHDUFLAG | Total packets | Discarded packets |
| A | 0 | 18 | 0 |
| B | 0 | 18 | 0 |
| C | 0 | 18 | 0 |
| D | 0 | 18 | 0 |
| Mode SS | |||
|---|---|---|---|
| Quadrant | BADHDUFLAG | Total packets | Discarded packets |
| A | 0 | 224 | 0 |
| B | 0 | 224 | 0 |
| C | 0 | 224 | 0 |
| D | 0 | 224 | 0 |
| Mode M0 | |||
|---|---|---|---|
| Quadrant | BADHDUFLAG | Total packets | Discarded packets |
| A | 0 | 23140 | 3 |
| B | 0 | 22433 | 2 |
| C | 0 | 22175 | 2 |
| D | 0 | 30271 | 5 |
| Quadrant | Total seconds | Saturated seconds | Saturation percentage |
|---|---|---|---|
| A | 10925 | 100 | 0.915332% |
| B | 10925 | 50 | 0.457666% |
| C | 10925 | 31 | 0.283753% |
| D | 10924 | 184 | 1.684365% |
Noise dominated data is calculated using 1-second bins in cleaned event files. If a bin has >2000 counts, and if more than 50% of those come from <1% of pixels, then it is considered to be noise-dominated and hence unusable.
| Quadrant | # 1 sec bins | Bins with >0 counts | Bins with >2000 counts | High rate bins dominated by noise | Noise dominated (total time) | Noise dominated (detector-on time) | Marked lightcurve |
|---|---|---|---|---|---|---|---|
| A | 12732 | 10928 | 5 | 5 | 0.04% | 0.05% |  |
| B | 12732 | 10928 | 8 | 8 | 0.06% | 0.07% | 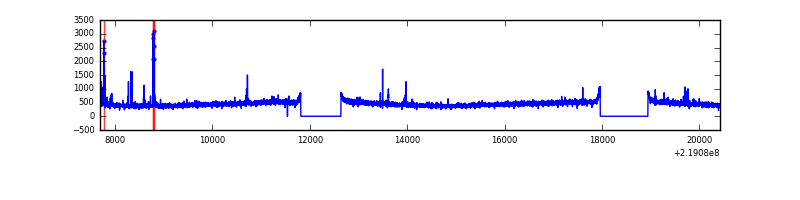 |
| C | 12732 | 10928 | 0 | 0 | 0.00% | 0.00% | 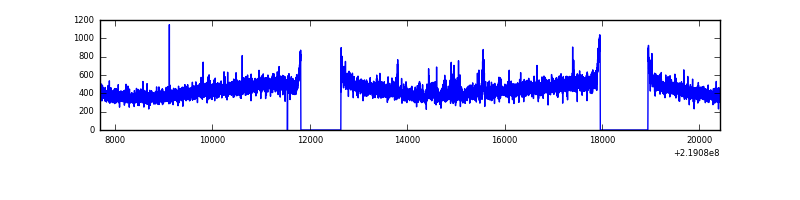 |
| D | 12731 | 10927 | 135 | 135 | 1.06% | 1.24% | 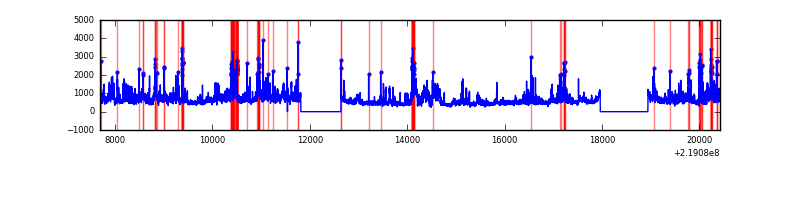 |
Top three noisy pixels from each quadrant. If the there are fewer than three noisy pixels in the level2.evt file, extra rows are filled as -1
| Pixel properties | Quadrant properties | ||||||
|---|---|---|---|---|---|---|---|
| Quadrant | DetID | PixID | Counts | Sigma | Mean | Median | Sigma |
| A | 8 | 15 | 496277 | 1961.42 | 1241 | 1215 | 252.4 |
| A | 15 | 236 | 100458 | 393.2 | 1241 | 1215 | 252.4 |
| A | 13 | 14 | 13289 | 47.83 | 1241 | 1215 | 252.4 |
| B | 0 | 219 | 43007 | 173.95 | 1249 | 1221 | 240.2 |
| B | 4 | 48 | 28169 | 112.18 | 1249 | 1221 | 240.2 |
| B | 12 | 111 | 26056 | 103.38 | 1249 | 1221 | 240.2 |
| C | 4 | 254 | 93500 | 330.56 | 1201 | 1209 | 279.2 |
| C | 13 | 61 | 9383 | 29.28 | 1201 | 1209 | 279.2 |
| C | 1 | 16 | 5033 | 13.69 | 1201 | 1209 | 279.2 |
| D | 2 | 152 | 2610505 | 9017.46 | 1189 | 1153 | 289.4 |
| D | 2 | 14 | 307782 | 1059.66 | 1189 | 1153 | 289.4 |
| D | 10 | 172 | 45157 | 152.07 | 1189 | 1153 | 289.4 |
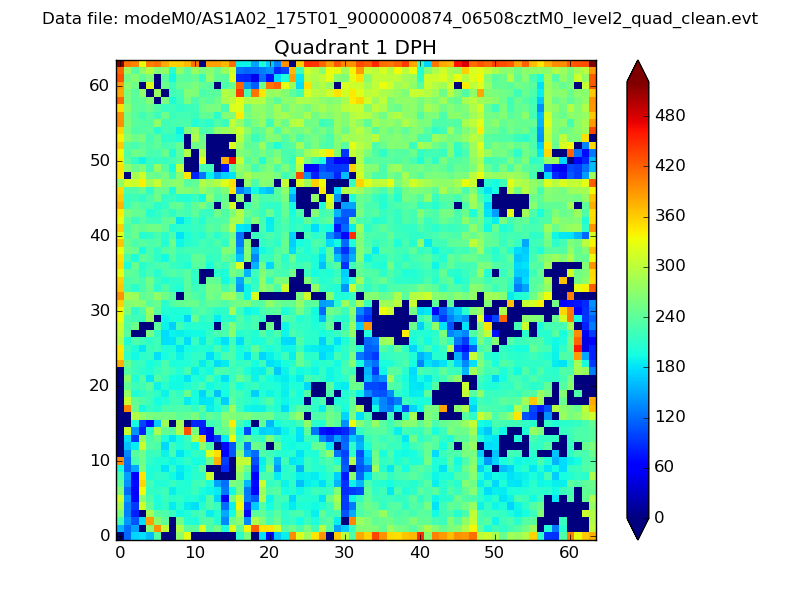
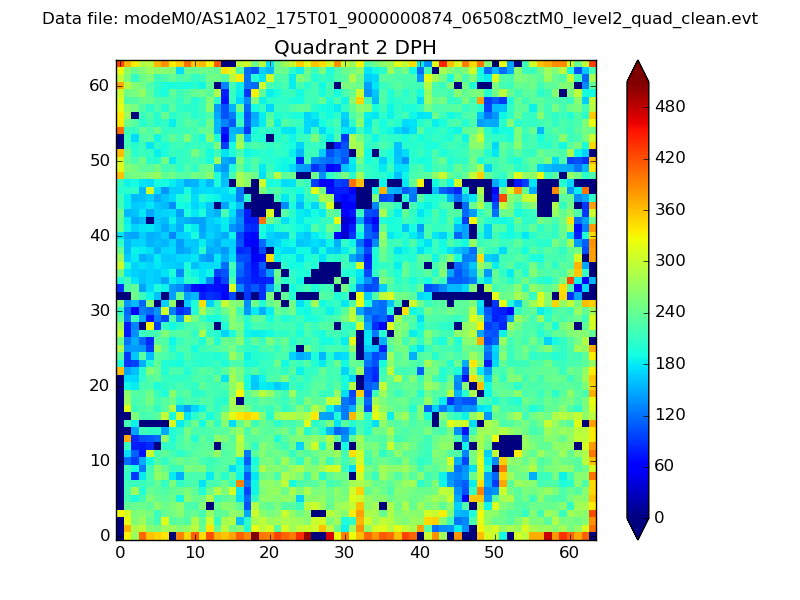
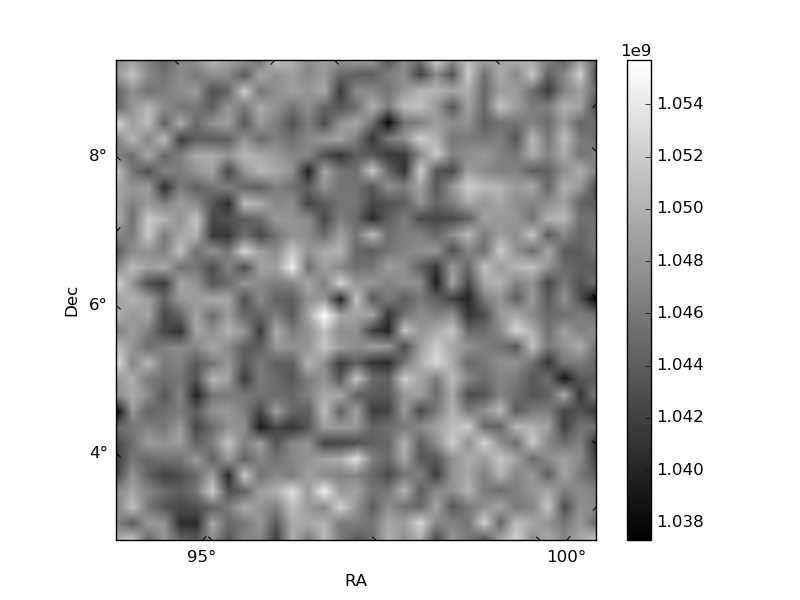
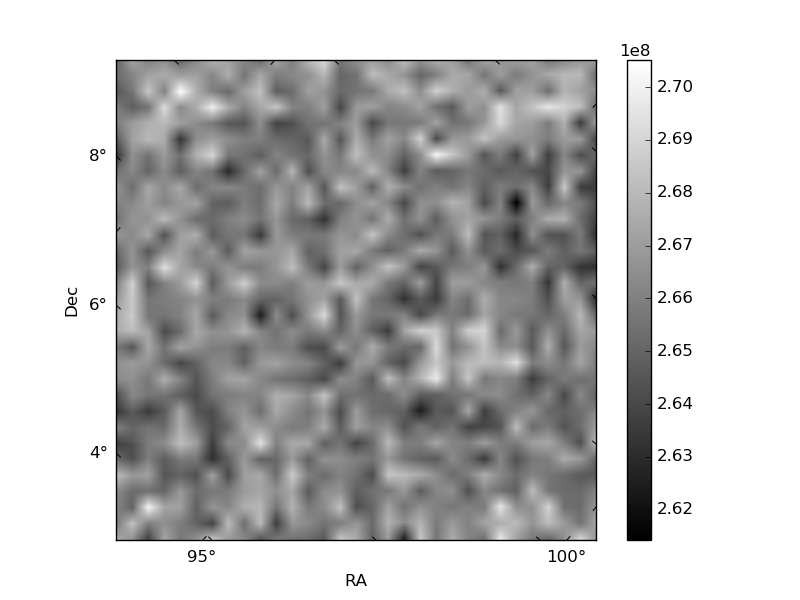
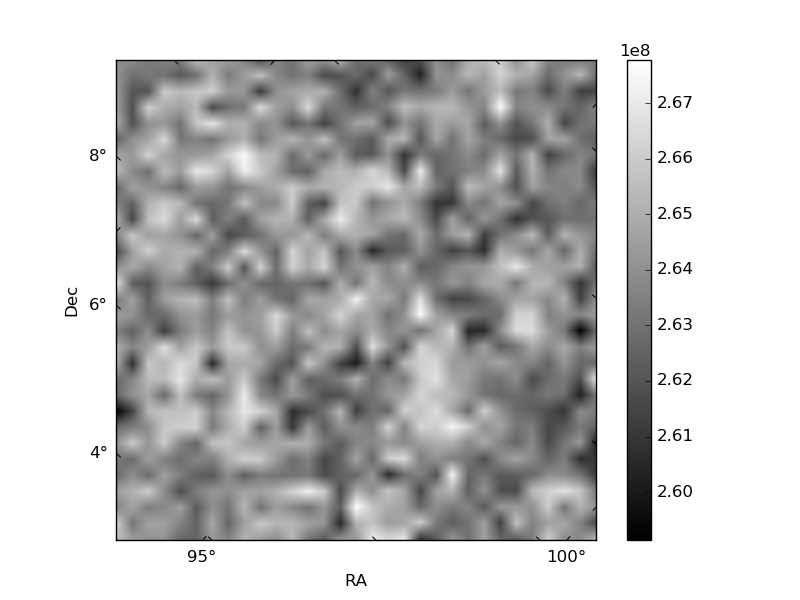
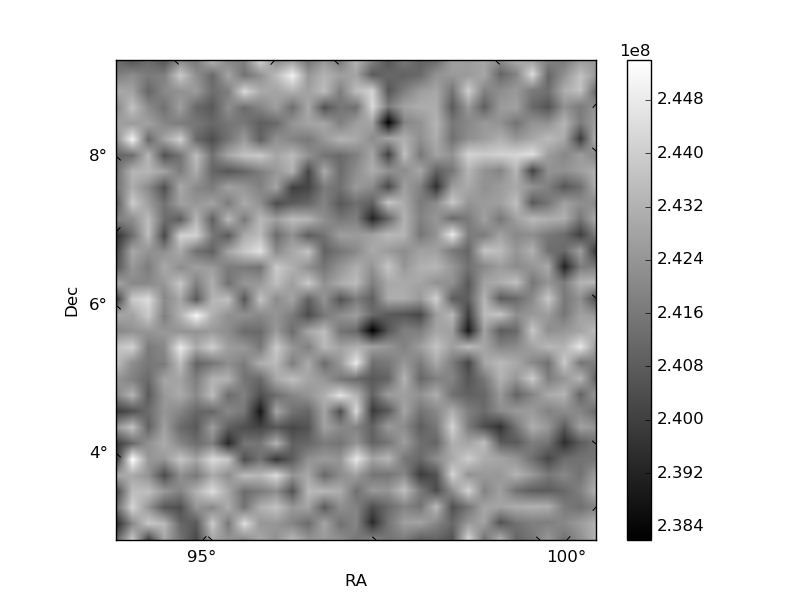
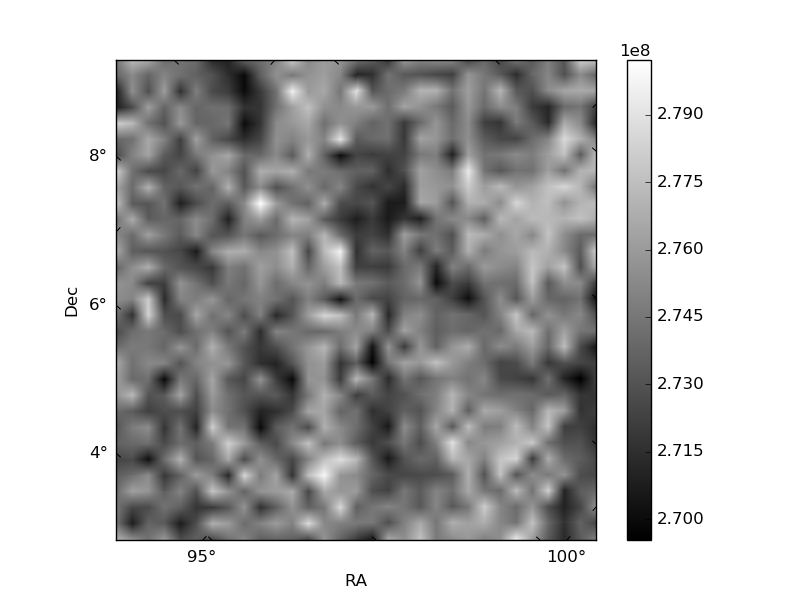
Histogram calculated using DETX and DETY for each event in the final _common_clean file
| Quadrant A | 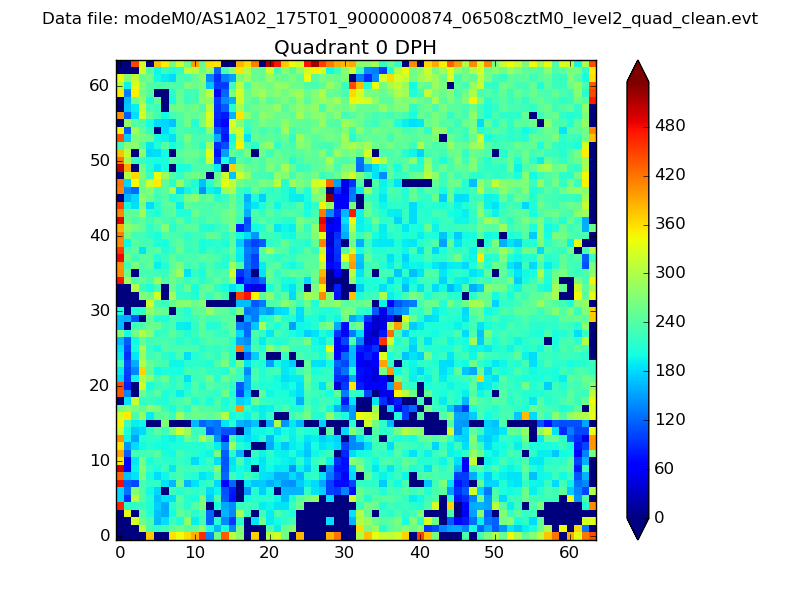 |
 |
Quadrant B |
|---|---|---|---|
| Quadrant D | 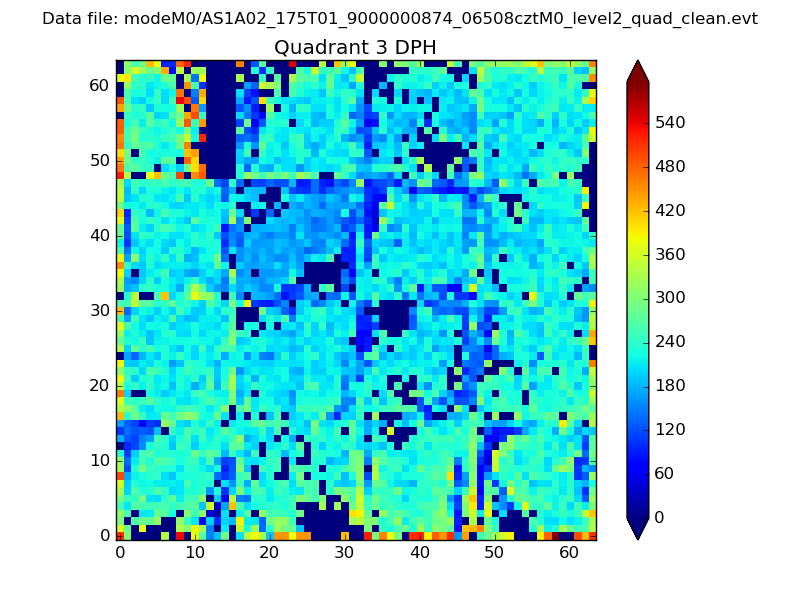 |
 |
Quadrant C |
| Plot type | Count rate plots | Images |
|---|---|---|
| Comparison with Poisson distribution Blue bars denote a histogram of data divided into 1 sec bins. Red curve is a Poisson curve with rate = median count rate of data. |
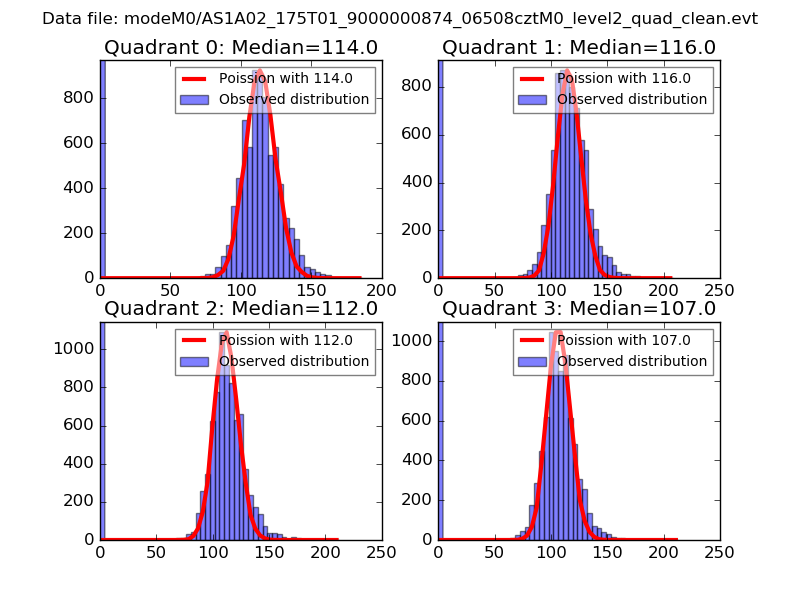 |
 |
| Quadrant-wise count rates Data is divided into 100 sec bins |
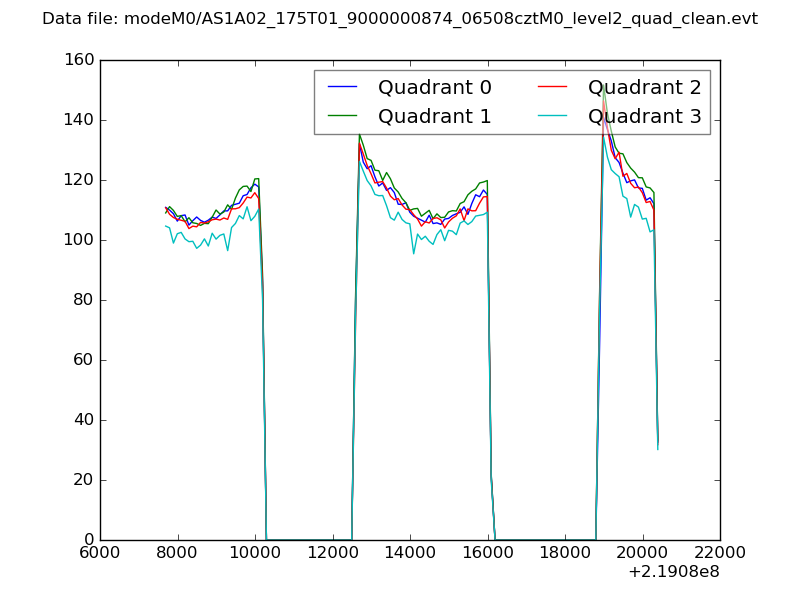 |
|
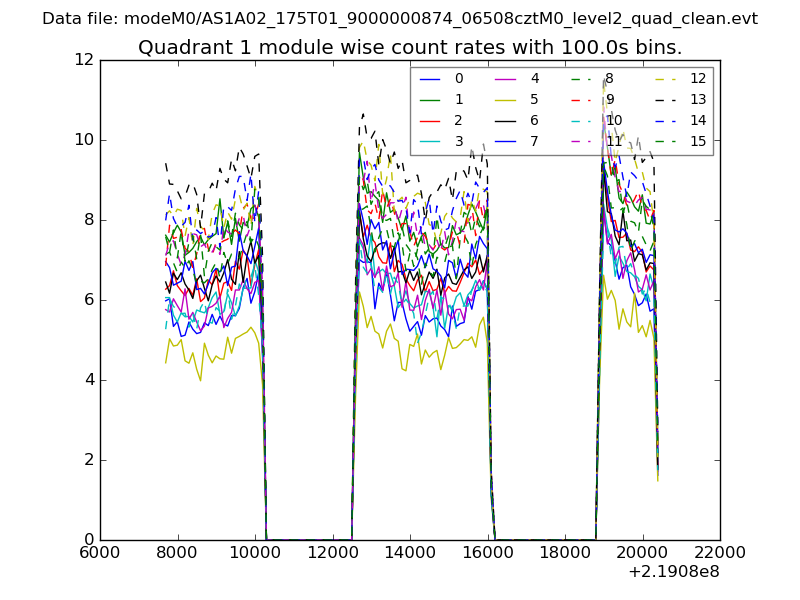
| Module-wise count rates for Quadrant A Data is divided into 100 sec bins |
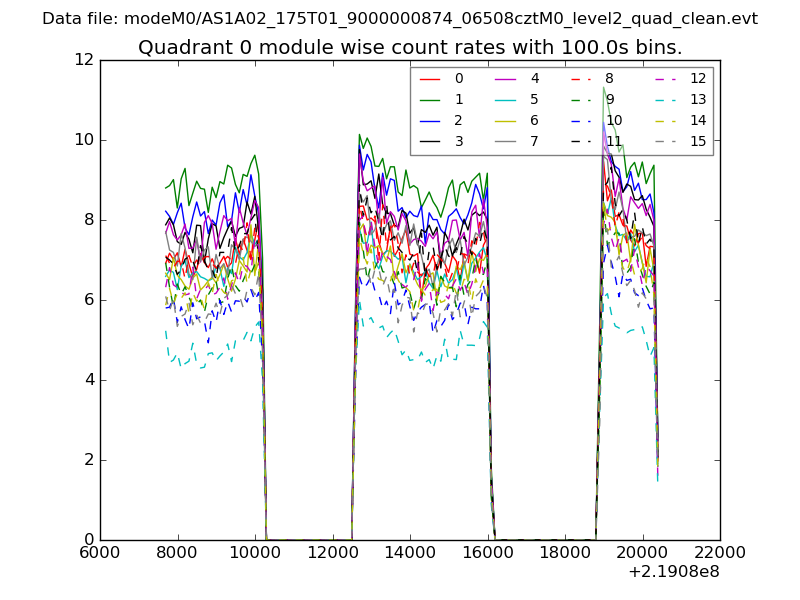 |
 |
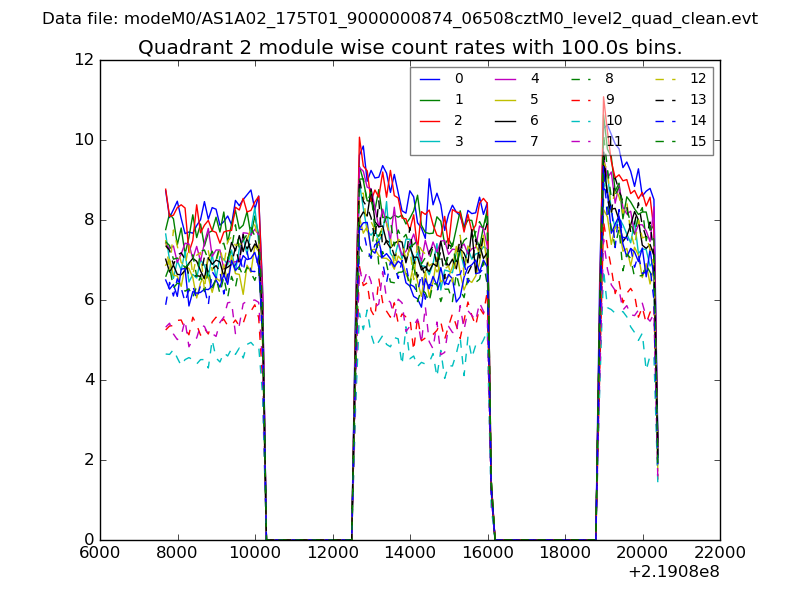
| Module-wise count rates for Quadrant B Data is divided into 100 sec bins |
 |
 |
| Module-wise count rates for Quadrant C Data is divided into 100 sec bins |
 |
 |
| Module-wise count rates for Quadrant D Data is divided into 100 sec bins |
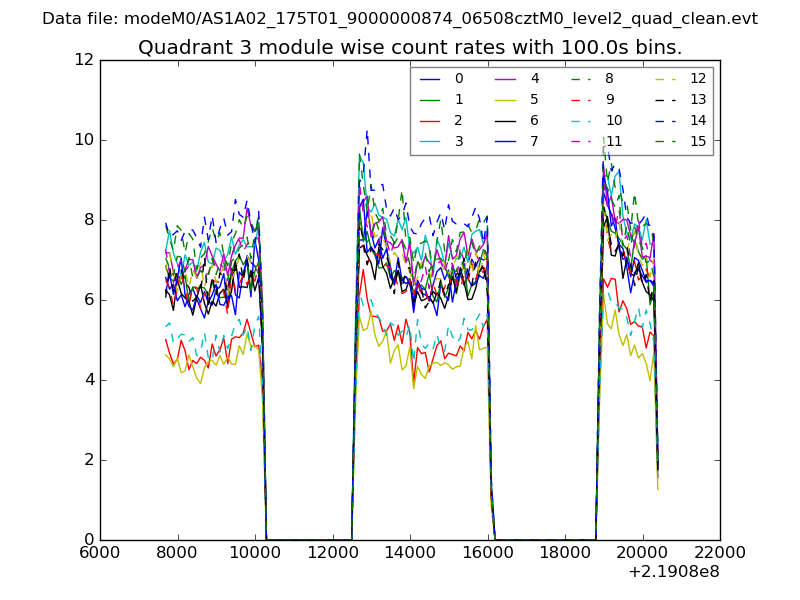 |
 |
| Parameter | Plot |
|---|---|
| CZT HV Monitor | 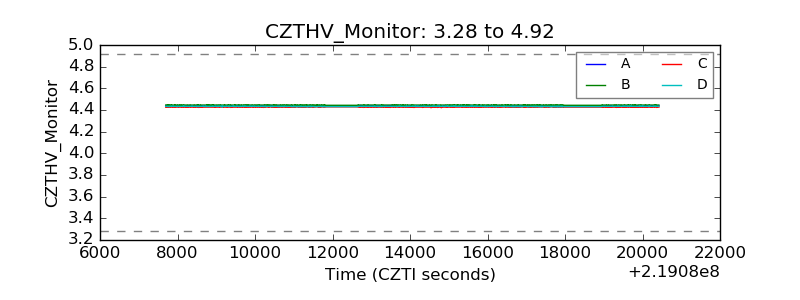 |
| D_VDD | 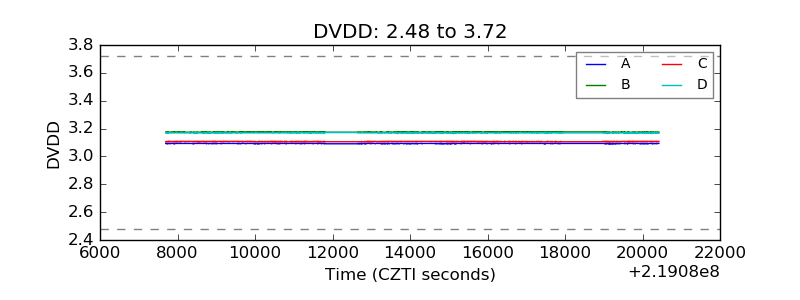 |
| Temperature 1 | 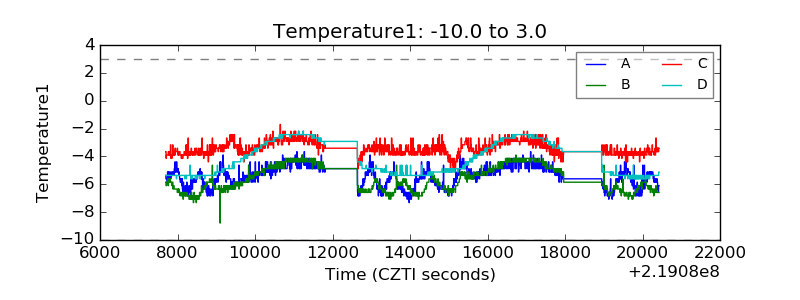 |
| Veto HV Monitor | 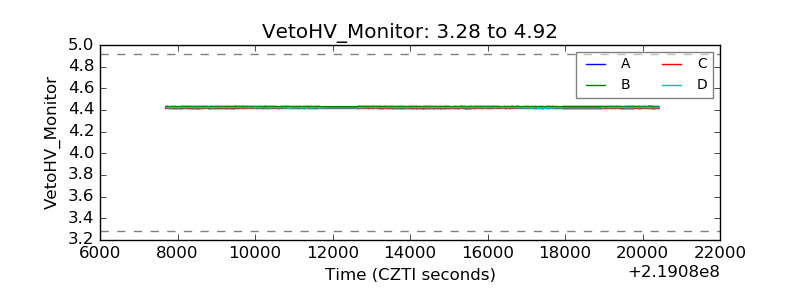 |
| Veto LLD | 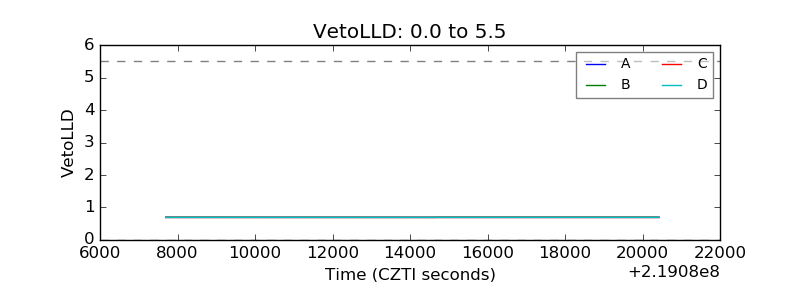 |
| Alpha Counter | 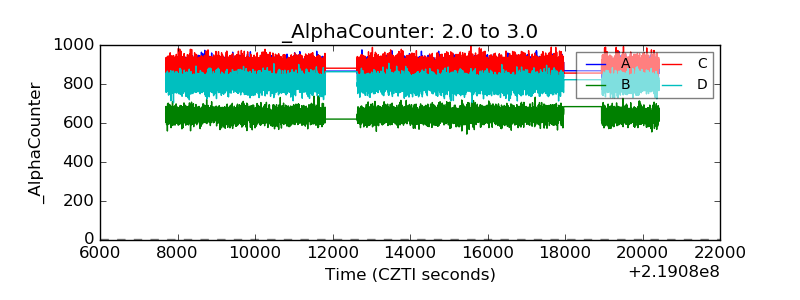 |
| _CPM_Rate | 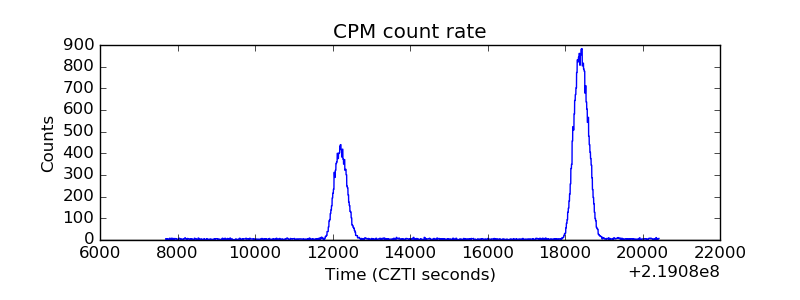 |
| CZT Counter | 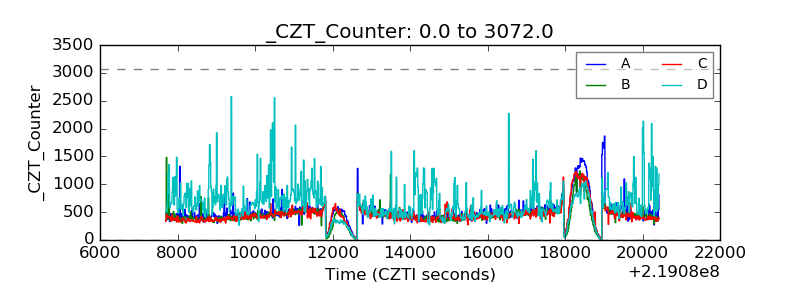 |
| +2.5 Volts monitor |  |
| +5 Volts monitor |  |
| _ROLL_ROT | 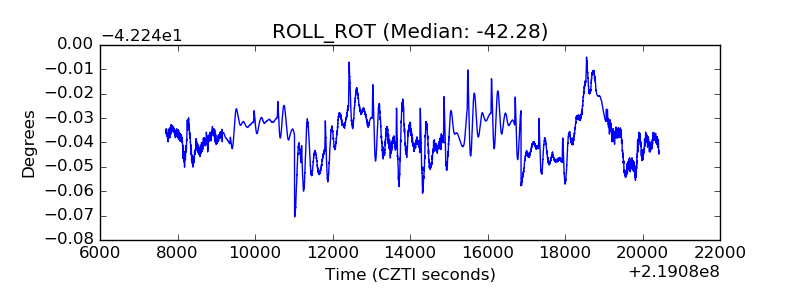 |
| _Roll_DEC | 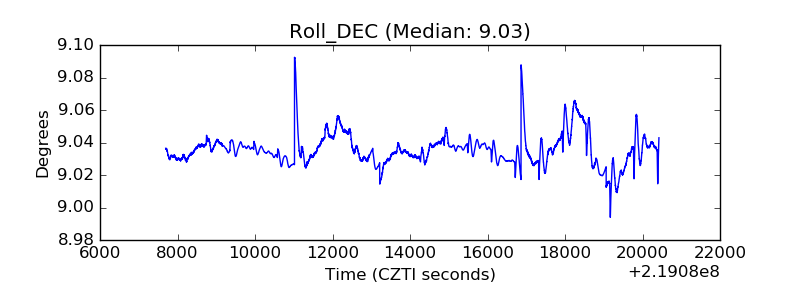 |
| _Roll_RA | 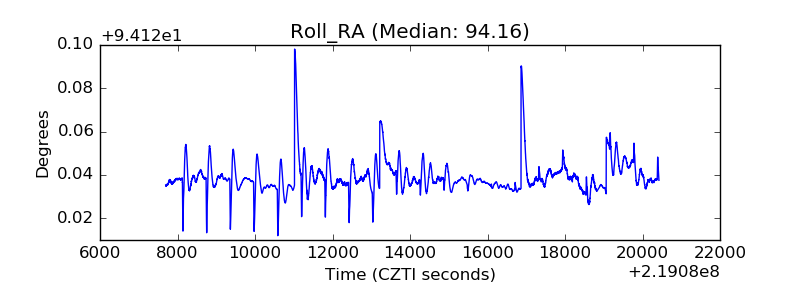 |
| Veto Counter | 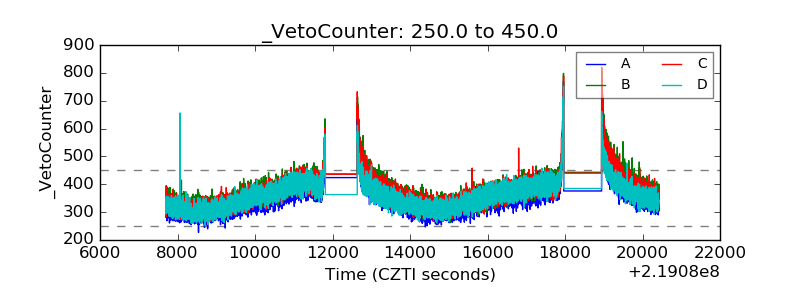 |