| Param | Original file | Final file |
|---|---|---|
| Filename | modeM0/AS1A02_175T01_9000000874_06510cztM0_level2.evt | modeM0/AS1A02_175T01_9000000874_06510cztM0_level2_quad_clean.evt |
| Size (bytes) | 144,797,760 | 32,670,720 |
| Size | 138.1 MB | 31.2 MB |
| Events in quadrant A | 1,064,066 | 213,693 |
| Events in quadrant B | 888,251 | 222,638 |
| Events in quadrant C | 835,920 | 215,175 |
| Events in quadrant D | 1,466,864 | 200,331 |
| Mode M9 | |||
|---|---|---|---|
| Quadrant | BADHDUFLAG | Total packets | Discarded packets |
| A | 0 | 10 | 0 |
| B | 0 | 10 | 0 |
| C | 0 | 10 | 0 |
| D | 0 | 10 | 0 |
| Mode SS | |||
|---|---|---|---|
| Quadrant | BADHDUFLAG | Total packets | Discarded packets |
| A | 0 | 40 | 0 |
| B | 0 | 40 | 0 |
| C | 0 | 40 | 0 |
| D | 0 | 40 | 0 |
| Mode M0 | |||
|---|---|---|---|
| Quadrant | BADHDUFLAG | Total packets | Discarded packets |
| A | 0 | 4435 | 1 |
| B | 0 | 3941 | 1 |
| C | 0 | 3898 | 1 |
| D | 0 | 5684 | 1 |
| Quadrant | Total seconds | Saturated seconds | Saturation percentage |
|---|---|---|---|
| A | 1876 | 76 | 4.051173% |
| B | 1876 | 21 | 1.119403% |
| C | 1876 | 13 | 0.692964% |
| D | 1876 | 67 | 3.571429% |
Noise dominated data is calculated using 1-second bins in cleaned event files. If a bin has >2000 counts, and if more than 50% of those come from <1% of pixels, then it is considered to be noise-dominated and hence unusable.
| Quadrant | # 1 sec bins | Bins with >0 counts | Bins with >2000 counts | High rate bins dominated by noise | Noise dominated (total time) | Noise dominated (detector-on time) | Marked lightcurve |
|---|---|---|---|---|---|---|---|
| A | 2856 | 1877 | 5 | 5 | 0.18% | 0.27% | 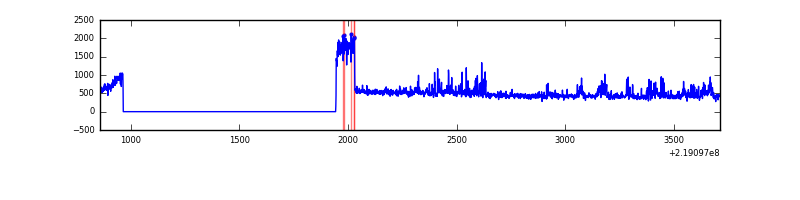 |
| B | 2856 | 1877 | 0 | 0 | 0.00% | 0.00% | 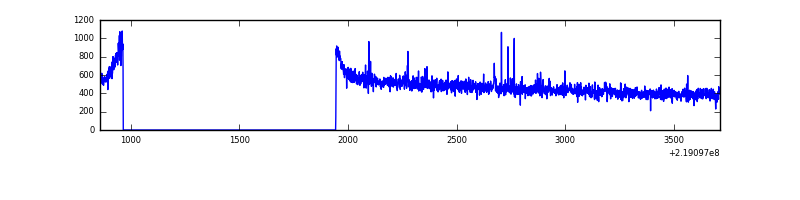 |
| C | 2856 | 1877 | 0 | 0 | 0.00% | 0.00% | 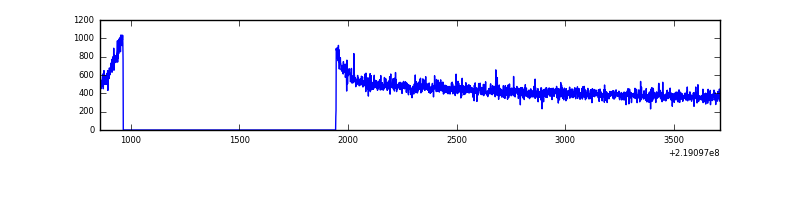 |
| D | 2856 | 1877 | 49 | 49 | 1.72% | 2.61% | 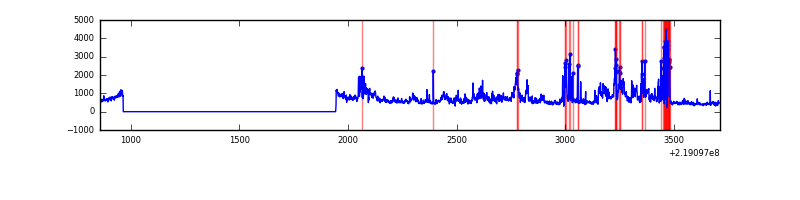 |
Top three noisy pixels from each quadrant. If the there are fewer than three noisy pixels in the level2.evt file, extra rows are filled as -1
| Pixel properties | Quadrant properties | ||||||
|---|---|---|---|---|---|---|---|
| Quadrant | DetID | PixID | Counts | Sigma | Mean | Median | Sigma |
| A | 8 | 15 | 121300 | 2601.85 | 219 | 214 | 46.5 |
| A | 15 | 236 | 97373 | 2087.71 | 219 | 214 | 46.5 |
| A | 0 | 226 | 2065 | 39.77 | 219 | 214 | 46.5 |
| B | 4 | 80 | 6368 | 137.49 | 225 | 220 | 44.7 |
| B | 4 | 81 | 5579 | 119.84 | 225 | 220 | 44.7 |
| B | 12 | 111 | 4814 | 102.74 | 225 | 220 | 44.7 |
| C | 4 | 254 | 3108 | 56.06 | 212 | 214 | 51.6 |
| C | 1 | 16 | 1870 | 32.08 | 212 | 214 | 51.6 |
| C | 13 | 61 | 1640 | 27.62 | 212 | 214 | 51.6 |
| D | 2 | 152 | 609667 | 11613.47 | 206 | 199 | 52.5 |
| D | 2 | 14 | 23708 | 447.97 | 206 | 199 | 52.5 |
| D | 5 | 97 | 21279 | 401.68 | 206 | 199 | 52.5 |
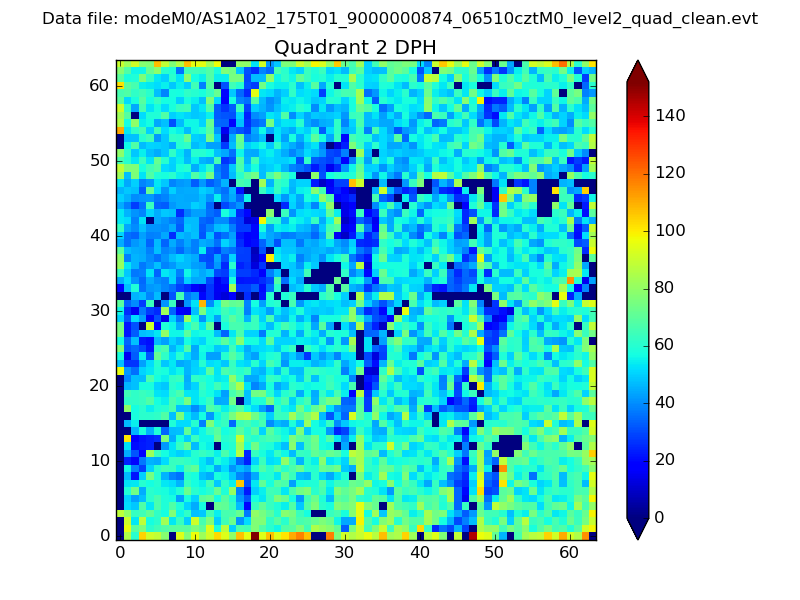
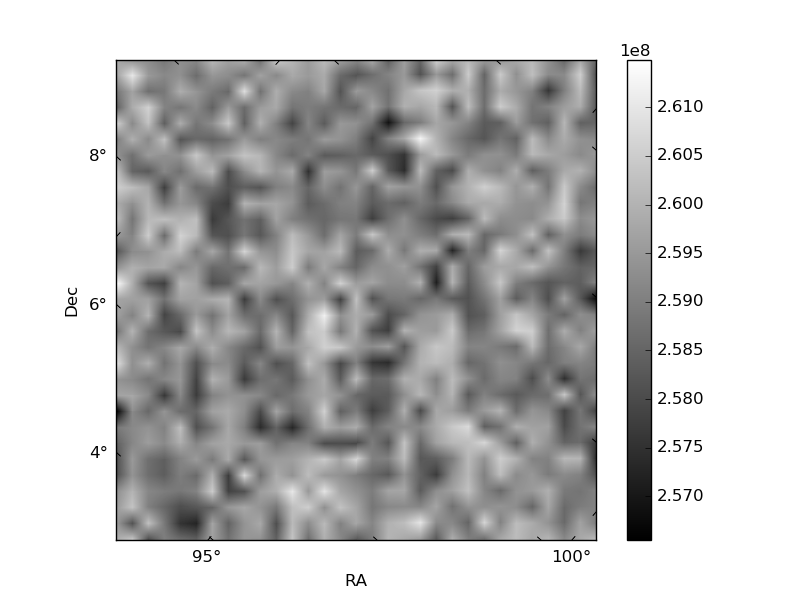
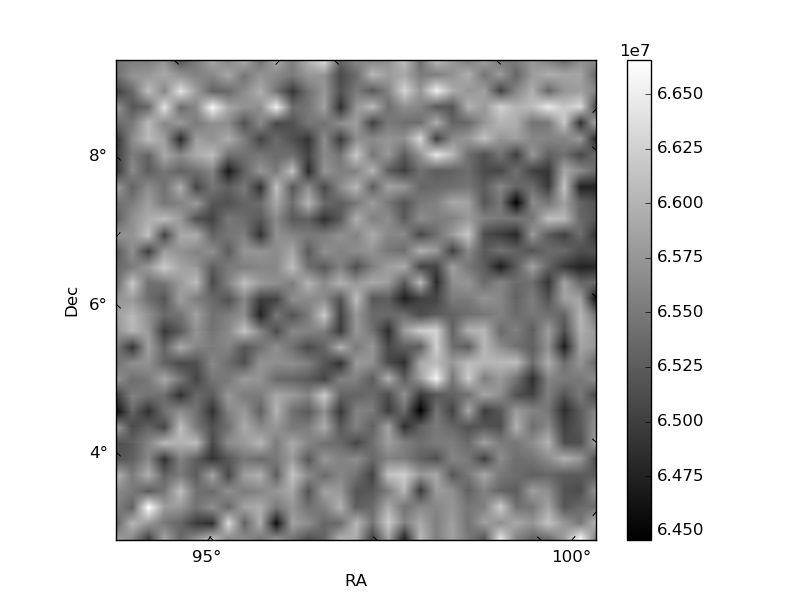
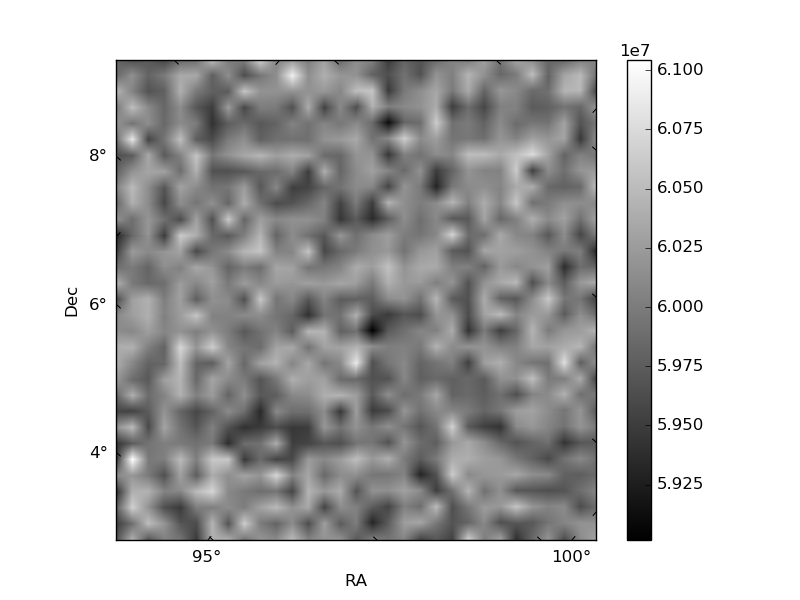
Histogram calculated using DETX and DETY for each event in the final _common_clean file
| Quadrant A | 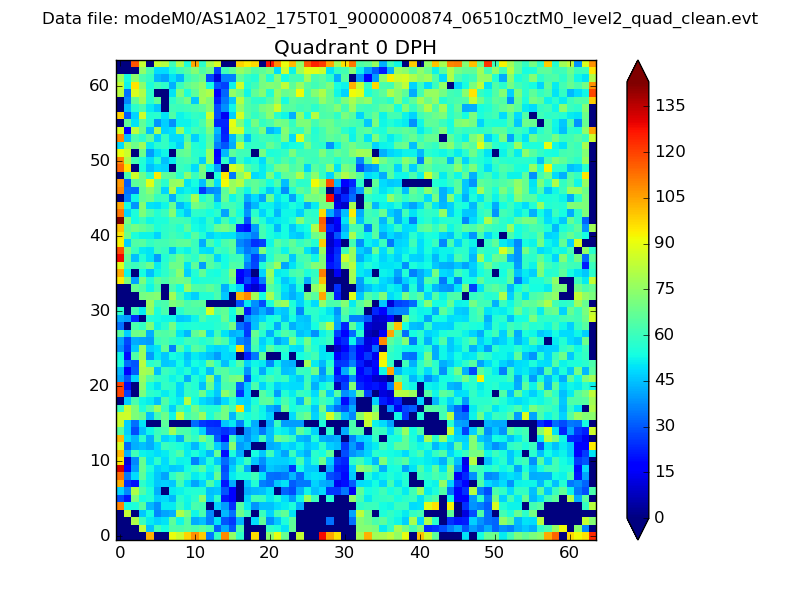 |
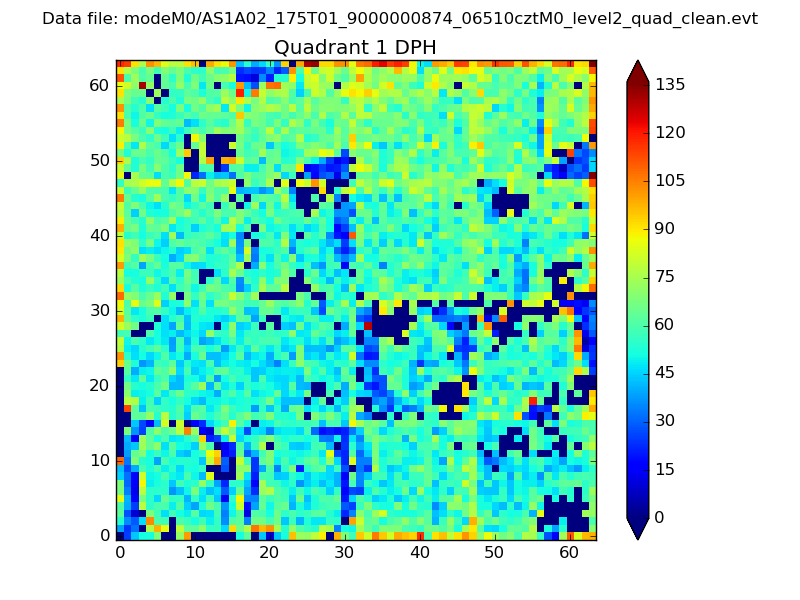 |
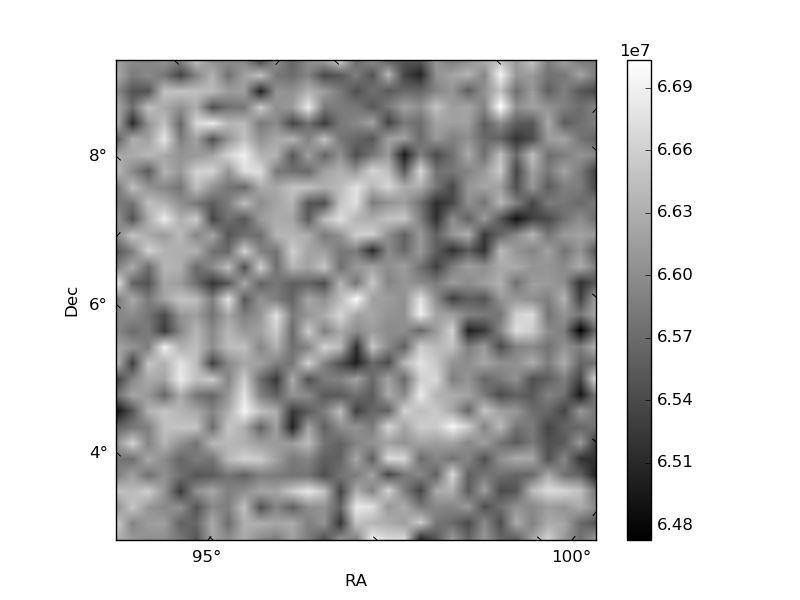
Quadrant B |
|---|---|---|---|
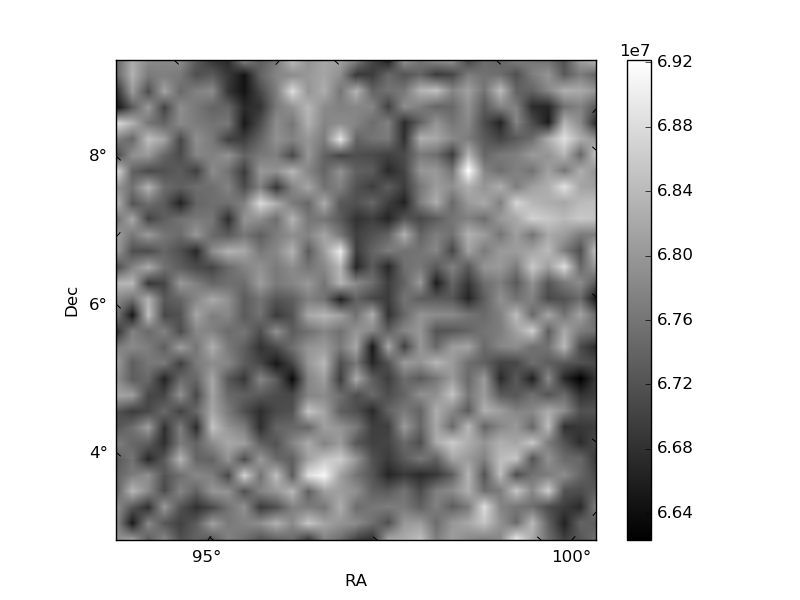
| Quadrant D | 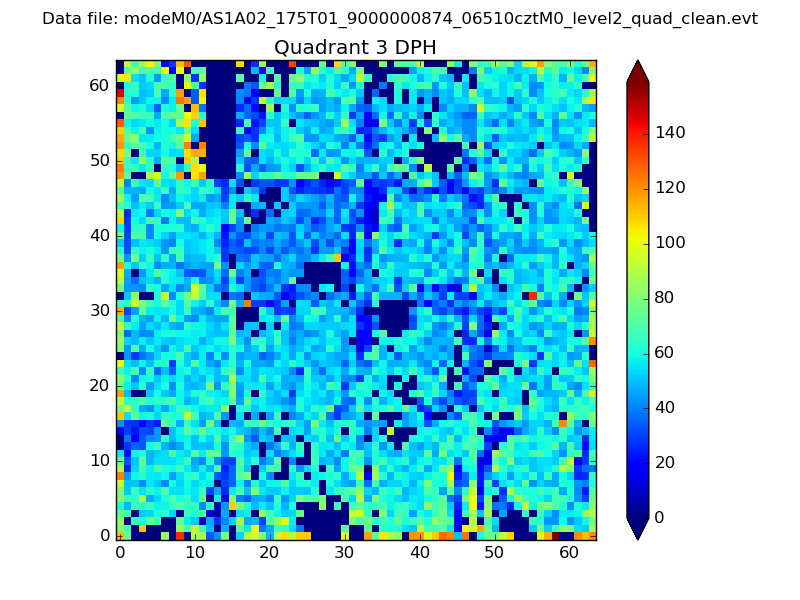 |
 |
Quadrant C |
| Plot type | Count rate plots | Images |
|---|---|---|
| Comparison with Poisson distribution Blue bars denote a histogram of data divided into 1 sec bins. Red curve is a Poisson curve with rate = median count rate of data. |
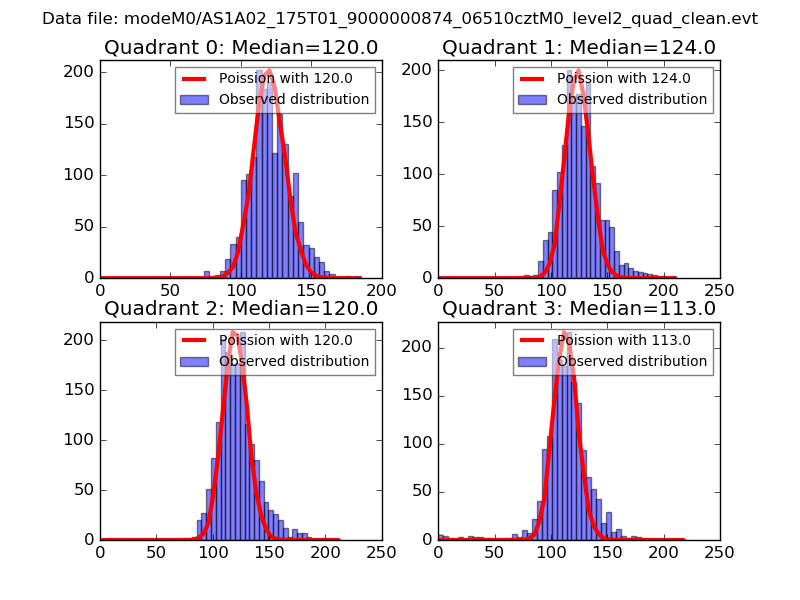 |
 |
| Quadrant-wise count rates Data is divided into 100 sec bins |
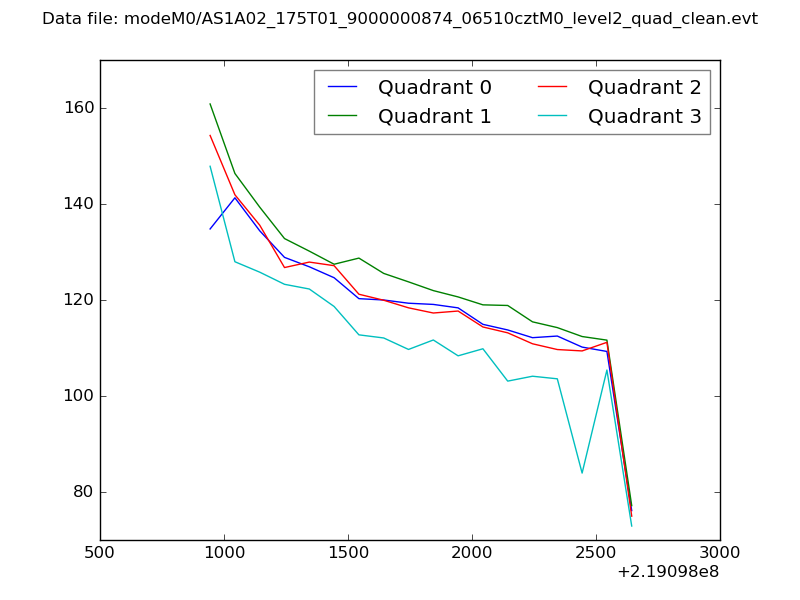 |
|
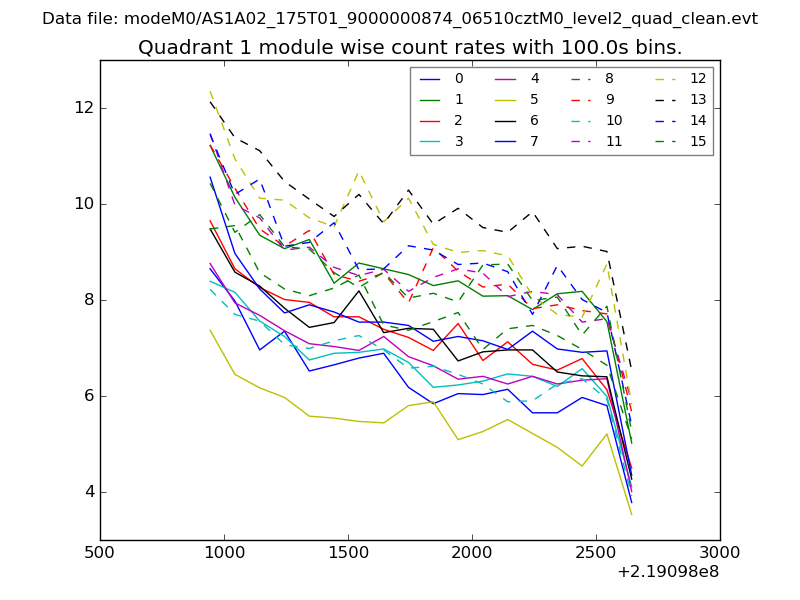
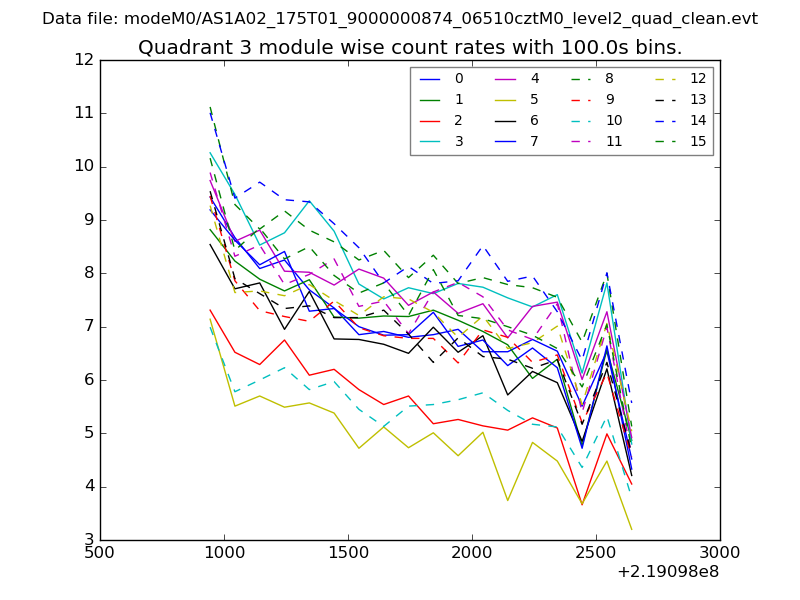
| Module-wise count rates for Quadrant A Data is divided into 100 sec bins |
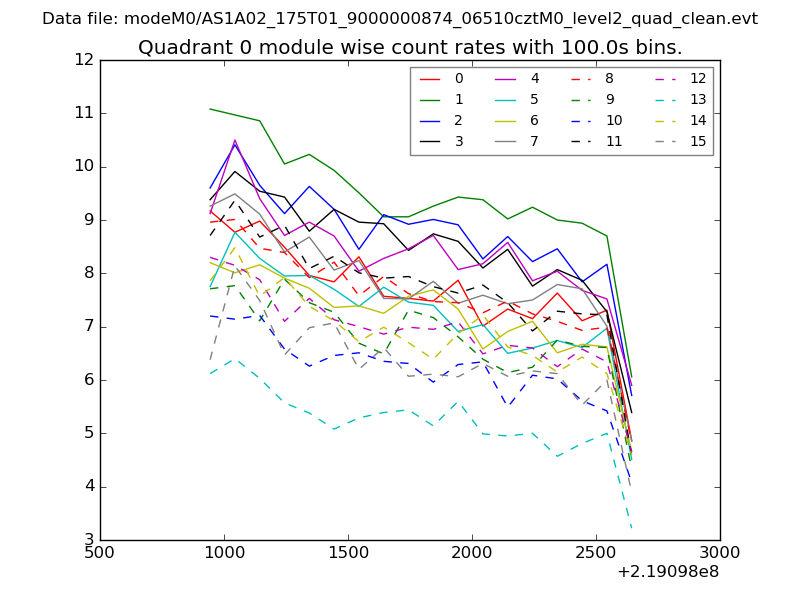 |
 |
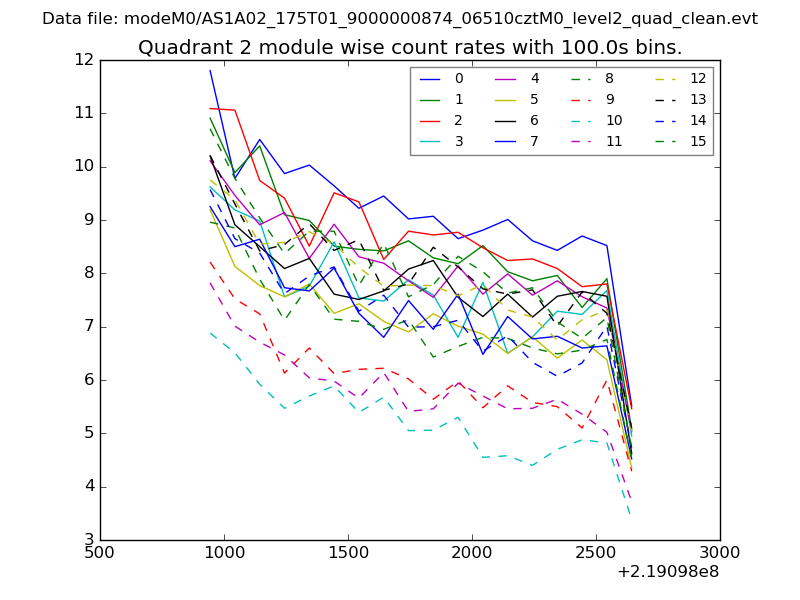
| Module-wise count rates for Quadrant B Data is divided into 100 sec bins |
 |
 |
| Module-wise count rates for Quadrant C Data is divided into 100 sec bins |
 |
 |
| Module-wise count rates for Quadrant D Data is divided into 100 sec bins |
 |
 |
| Parameter | Plot |
|---|---|
| CZT HV Monitor | 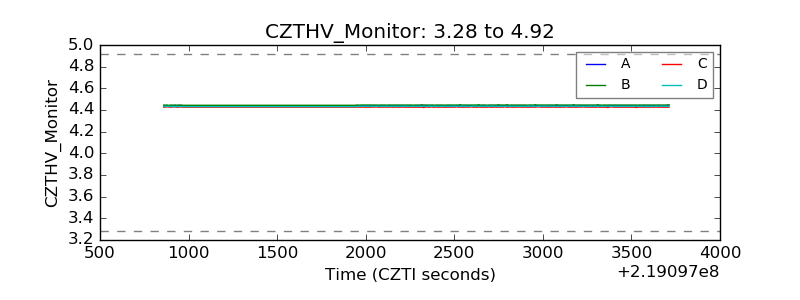 |
| D_VDD | 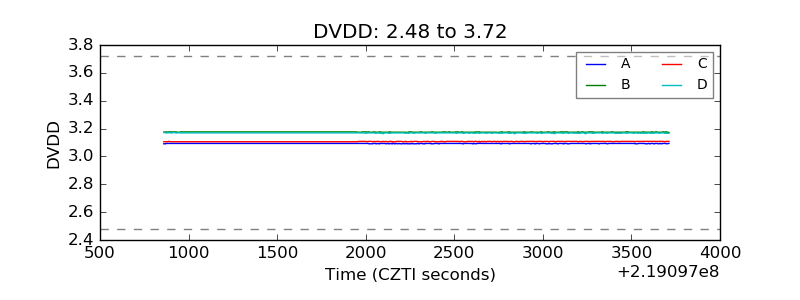 |
| Temperature 1 | 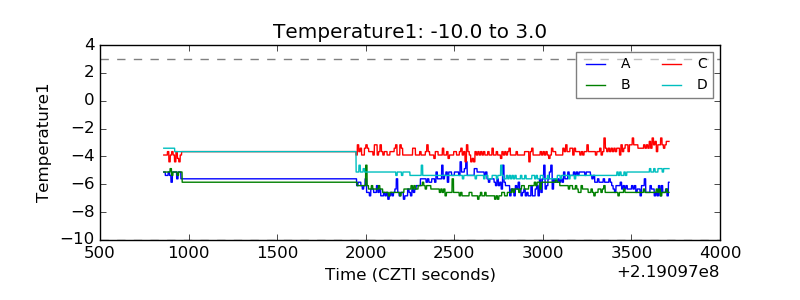 |
| Veto HV Monitor | 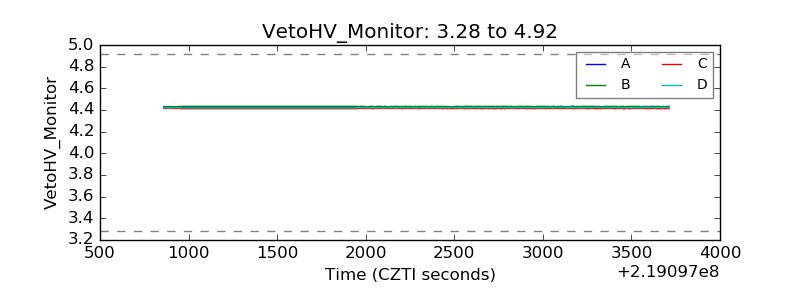 |
| Veto LLD | 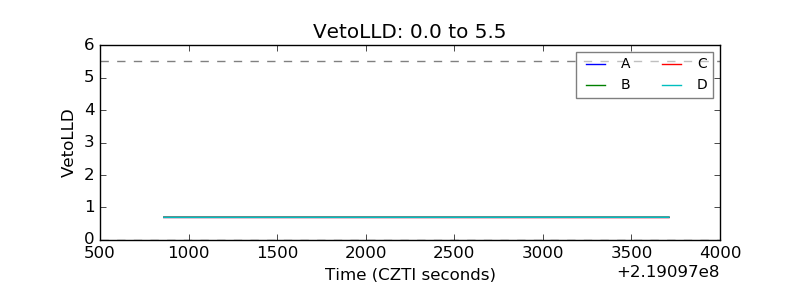 |
| Alpha Counter | 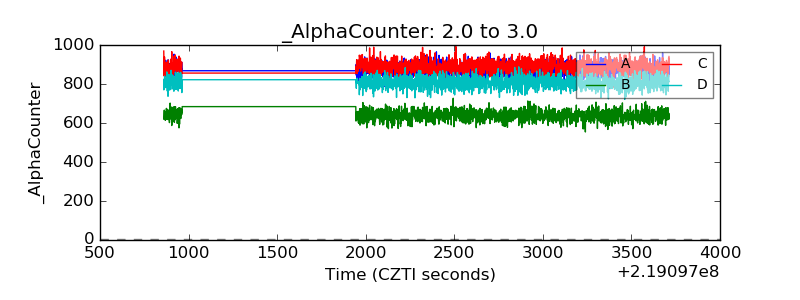 |
| _CPM_Rate | 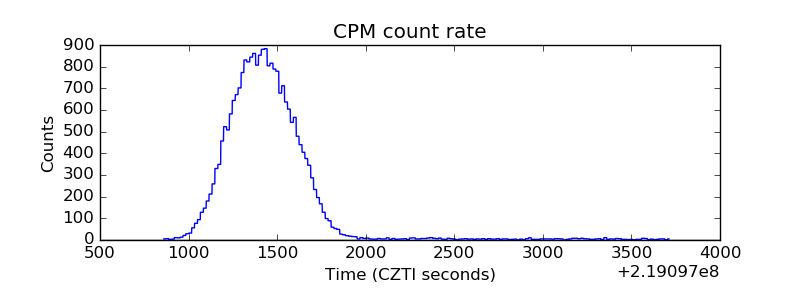 |
| CZT Counter | 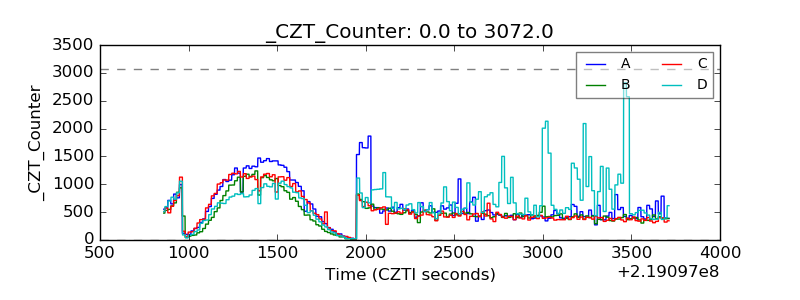 |
| +2.5 Volts monitor |  |
| +5 Volts monitor |  |
| _ROLL_ROT | 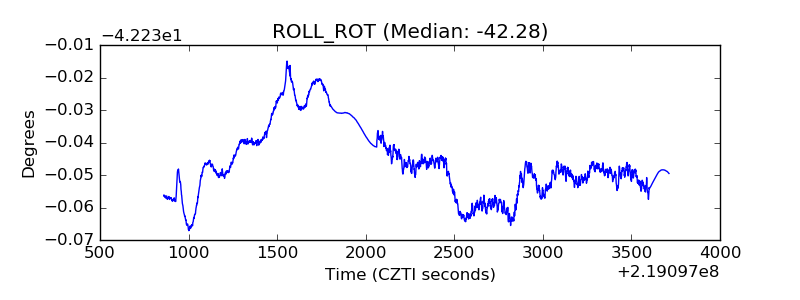 |
| _Roll_DEC | 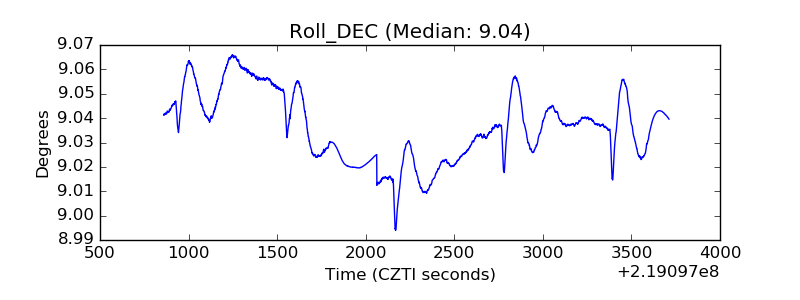 |
| _Roll_RA | 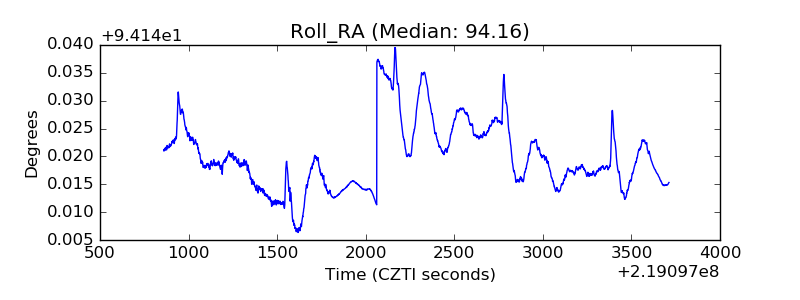 |
| Veto Counter | 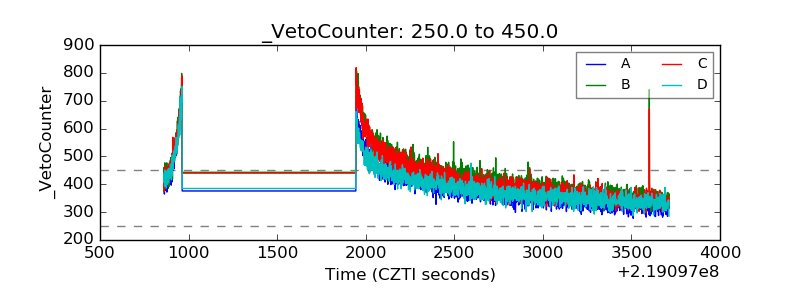 |