| Param | Original file | Final file |
|---|---|---|
| Filename | modeM0/AS1G06_136T02_9000000876cztM0_level2.fits | modeM0/AS1G06_136T02_9000000876cztM0_level2_quad_clean.evt |
| Size (bytes) | 994,478,400 | 965,436,480 |
| Size | 948.4 MB | 920.7 MB |
| Events in quadrant A | 5,953,306 | 5,672,492 |
| Events in quadrant B | 5,788,854 | 5,688,446 |
| Events in quadrant C | 5,899,786 | 5,445,051 |
| Events in quadrant D | 5,030,612 | 4,988,358 |
| Mode M0 | |||
|---|---|---|---|
| Quadrant | BADHDUFLAG | Total packets | Discarded packets |
| A | 0 | 229646 | 0 |
| B | 0 | 238161 | 0 |
| C | 0 | 224572 | 0 |
| D | 0 | 257012 | 0 |
| Mode M9 | |||
|---|---|---|---|
| Quadrant | BADHDUFLAG | Total packets | Discarded packets |
| A | 0 | 187 | 0 |
| B | 0 | 187 | 0 |
| C | 0 | 187 | 0 |
| D | 0 | 187 | 0 |
| Mode SS | |||
|---|---|---|---|
| Quadrant | BADHDUFLAG | Total packets | Discarded packets |
| A | 0 | 2208 | 0 |
| B | 0 | 2208 | 0 |
| C | 0 | 2208 | 0 |
| D | 0 | 2208 | 0 |
| Quadrant | Total seconds | Saturated seconds | Saturation percentage |
|---|---|---|---|
| A | 108633 | 1456 | 1.340293% |
| B | 108628 | 1981 | 1.823655% |
| C | 108630 | 879 | 0.809169% |
| D | 108630 | 2048 | 1.885299% |
Noise dominated data is calculated using 1-second bins in cleaned event files. If a bin has >2000 counts, and if more than 50% of those come from <1% of pixels, then it is considered to be noise-dominated and hence unusable.
| Quadrant | # 1 sec bins | Bins with >0 counts | Bins with >2000 counts | High rate bins dominated by noise | Noise dominated (total time) | Noise dominated (detector-on time) | Marked lightcurve |
|---|---|---|---|---|---|---|---|
| A | 127192 | 108639 | 0 | 0 | 0.00% | 0.00% |  |
| B | 127192 | 108639 | 0 | 0 | 0.00% | 0.00% |  |
| C | 127192 | 108643 | 0 | 0 | 0.00% | 0.00% |  |
| D | 127192 | 108632 | 0 | 0 | 0.00% | 0.00% |  |
Top three noisy pixels from each quadrant. If the there are fewer than three noisy pixels in the level2.evt file, extra rows are filled as -1
| Pixel properties | Quadrant properties | ||||||
|---|---|---|---|---|---|---|---|
| Quadrant | DetID | PixID | Counts | Sigma | Mean | Median | Sigma |
| A | 0 | 29 | 5763 | 11.0 | 1549 | 1445 | 392.6 |
| A | 7 | 110 | 5176 | 9.5 | 1549 | 1445 | 392.6 |
| A | 0 | 30 | 4549 | 7.91 | 1549 | 1445 | 392.6 |
| B | 2 | 9 | 5114 | 12.13 | 1525 | 1451 | 301.9 |
| B | 5 | 128 | 3973 | 8.35 | 1525 | 1451 | 301.9 |
| B | 14 | 254 | 3861 | 7.98 | 1525 | 1451 | 301.9 |
| C | 1 | 80 | 4286 | 6.91 | 1557 | 1440 | 411.8 |
| C | 1 | 81 | 4284 | 6.91 | 1557 | 1440 | 411.8 |
| C | 12 | 241 | 4124 | 6.52 | 1557 | 1440 | 411.8 |
| D | 3 | 14 | 3794 | 6.49 | 1436 | 1304 | 383.8 |
| D | 6 | 231 | 3706 | 6.26 | 1436 | 1304 | 383.8 |
| D | 11 | 82 | 3702 | 6.25 | 1436 | 1304 | 383.8 |
Histogram calculated using DETX and DETY for each event in the final _common_clean file
| Quadrant A | 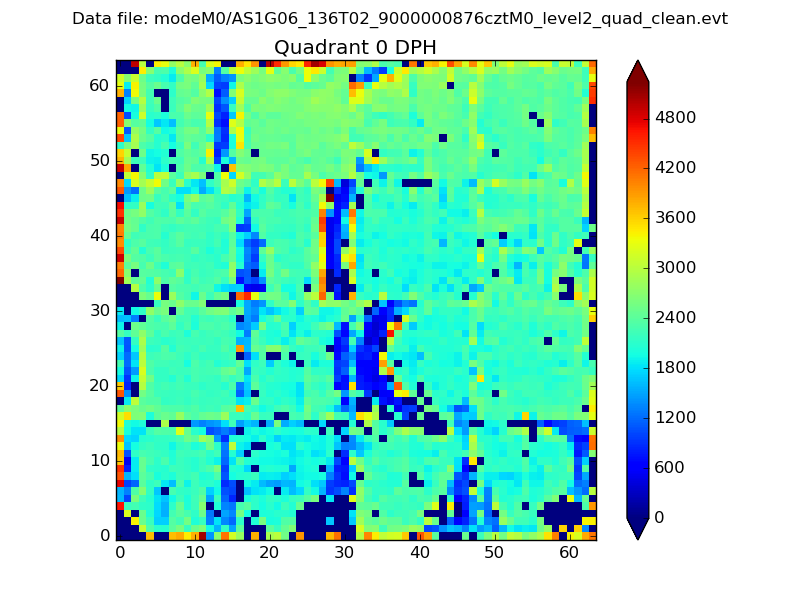 |
 |
Quadrant B |
|---|---|---|---|
| Quadrant D | 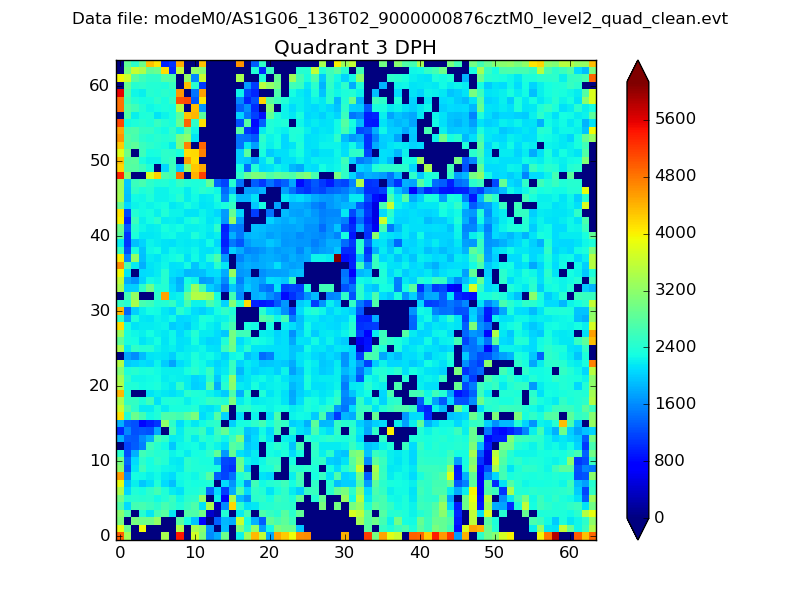 |
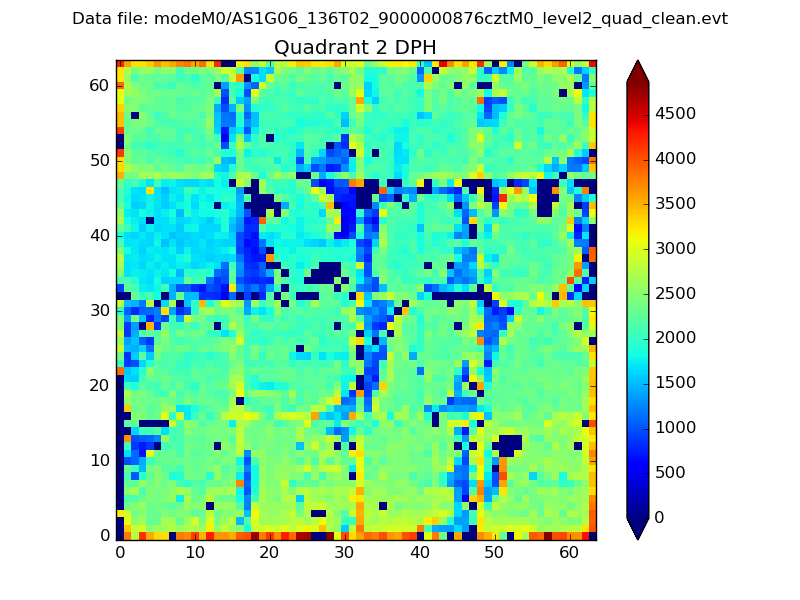 |
Quadrant C |
| Plot type | Count rate plots | Images |
|---|---|---|
| Comparison with Poisson distribution Blue bars denote a histogram of data divided into 1 sec bins. Red curve is a Poisson curve with rate = median count rate of data. |
 |
 |
| Quadrant-wise count rates Data is divided into 100 sec bins |
 |
|
| Module-wise count rates for Quadrant A Data is divided into 100 sec bins |
 |
 |
| Module-wise count rates for Quadrant B Data is divided into 100 sec bins |
 |
 |
| Module-wise count rates for Quadrant C Data is divided into 100 sec bins |
 |
 |
| Module-wise count rates for Quadrant D Data is divided into 100 sec bins |
 |
 |
| Parameter | Plot |
|---|---|
| CZT HV Monitor |  |
| D_VDD | 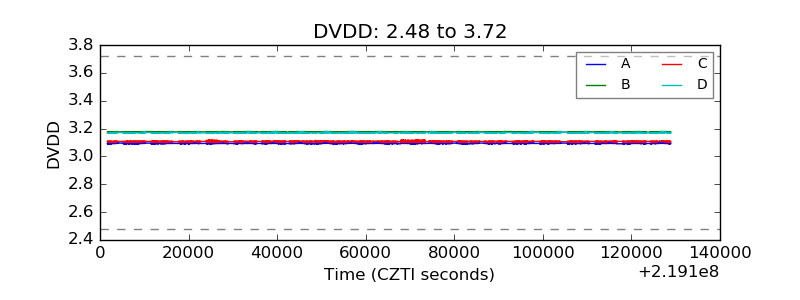 |
| Temperature 1 |  |
| Veto HV Monitor |  |
| Veto LLD |  |
| Alpha Counter |  |
| _CPM_Rate |  |
| CZT Counter |  |
| +2.5 Volts monitor |  |
| +5 Volts monitor |  |
| _ROLL_ROT |  |
| _Roll_DEC |  |
| _Roll_RA |  |
| Veto Counter |  |