| Param | Original file | Final file |
|---|---|---|
| Filename | modeM0/AS1G06_136T02_9000000876_06510cztM0_level2.evt | modeM0/AS1G06_136T02_9000000876_06510cztM0_level2_quad_clean.evt |
| Size (bytes) | 289,532,160 | 55,702,080 |
| Size | 276.1 MB | 53.1 MB |
| Events in quadrant A | 2,060,494 | 353,438 |
| Events in quadrant B | 1,902,335 | 365,403 |
| Events in quadrant C | 1,861,584 | 357,843 |
| Events in quadrant D | 2,679,254 | 335,843 |
| Mode M0 | |||
|---|---|---|---|
| Quadrant | BADHDUFLAG | Total packets | Discarded packets |
| A | 0 | 8765 | 2 |
| B | 0 | 8287 | 1 |
| C | 0 | 8250 | 1 |
| D | 0 | 10550 | 1 |
| Mode M9 | |||
|---|---|---|---|
| Quadrant | BADHDUFLAG | Total packets | Discarded packets |
| A | 0 | 11 | 0 |
| B | 0 | 11 | 0 |
| C | 0 | 11 | 0 |
| D | 0 | 11 | 0 |
| Mode SS | |||
|---|---|---|---|
| Quadrant | BADHDUFLAG | Total packets | Discarded packets |
| A | 0 | 80 | 0 |
| B | 0 | 80 | 0 |
| C | 0 | 80 | 0 |
| D | 0 | 80 | 0 |
| Quadrant | Total seconds | Saturated seconds | Saturation percentage |
|---|---|---|---|
| A | 3878 | 31 | 0.799381% |
| B | 3878 | 41 | 1.057246% |
| C | 3878 | 47 | 1.211965% |
| D | 3878 | 87 | 2.243424% |
Noise dominated data is calculated using 1-second bins in cleaned event files. If a bin has >2000 counts, and if more than 50% of those come from <1% of pixels, then it is considered to be noise-dominated and hence unusable.
| Quadrant | # 1 sec bins | Bins with >0 counts | Bins with >2000 counts | High rate bins dominated by noise | Noise dominated (total time) | Noise dominated (detector-on time) | Marked lightcurve |
|---|---|---|---|---|---|---|---|
| A | 4978 | 3879 | 2 | 2 | 0.04% | 0.05% | 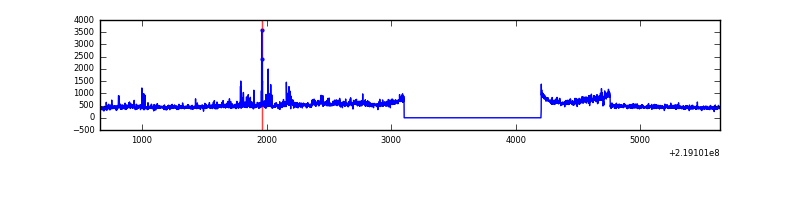 |
| B | 4978 | 3879 | 3 | 3 | 0.06% | 0.08% | 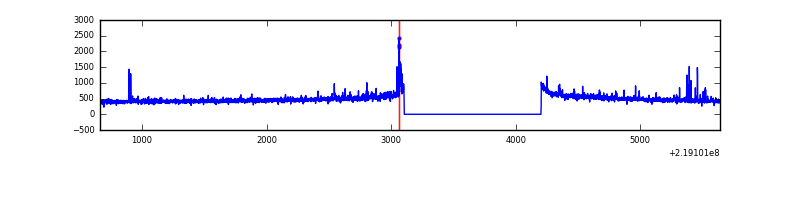 |
| C | 4978 | 3879 | 2 | 2 | 0.04% | 0.05% | 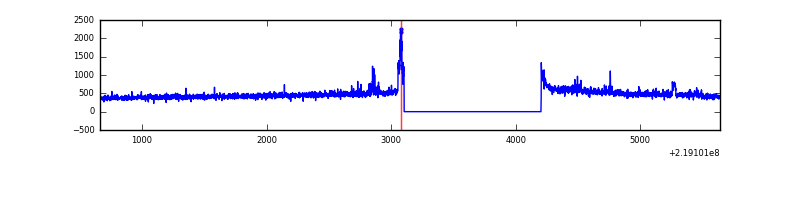 |
| D | 4978 | 3879 | 57 | 57 | 1.15% | 1.47% | 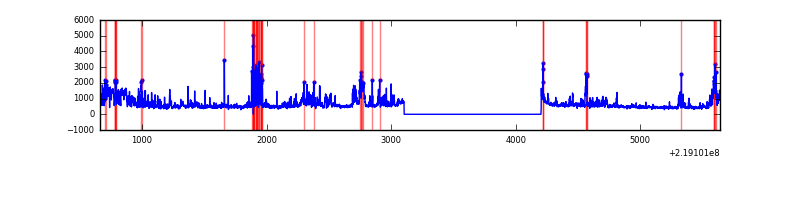 |
Top three noisy pixels from each quadrant. If the there are fewer than three noisy pixels in the level2.evt file, extra rows are filled as -1
| Pixel properties | Quadrant properties | ||||||
|---|---|---|---|---|---|---|---|
| Quadrant | DetID | PixID | Counts | Sigma | Mean | Median | Sigma |
| A | 8 | 15 | 171204 | 1812.73 | 462 | 453 | 94.2 |
| A | 15 | 236 | 96683 | 1021.6 | 462 | 453 | 94.2 |
| A | 15 | 239 | 6059 | 59.51 | 462 | 453 | 94.2 |
| B | 0 | 228 | 23463 | 253.98 | 467 | 455 | 90.6 |
| B | 0 | 214 | 18830 | 202.83 | 467 | 455 | 90.6 |
| B | 4 | 81 | 14678 | 157.0 | 467 | 455 | 90.6 |
| C | 4 | 254 | 54450 | 513.34 | 450 | 453 | 105.2 |
| C | 1 | 16 | 46971 | 442.24 | 450 | 453 | 105.2 |
| C | 13 | 61 | 3452 | 28.51 | 450 | 453 | 105.2 |
| D | 2 | 152 | 846047 | 7628.85 | 445 | 430 | 110.8 |
| D | 2 | 14 | 48128 | 430.31 | 445 | 430 | 110.8 |
| D | 7 | 55 | 24601 | 218.06 | 445 | 430 | 110.8 |
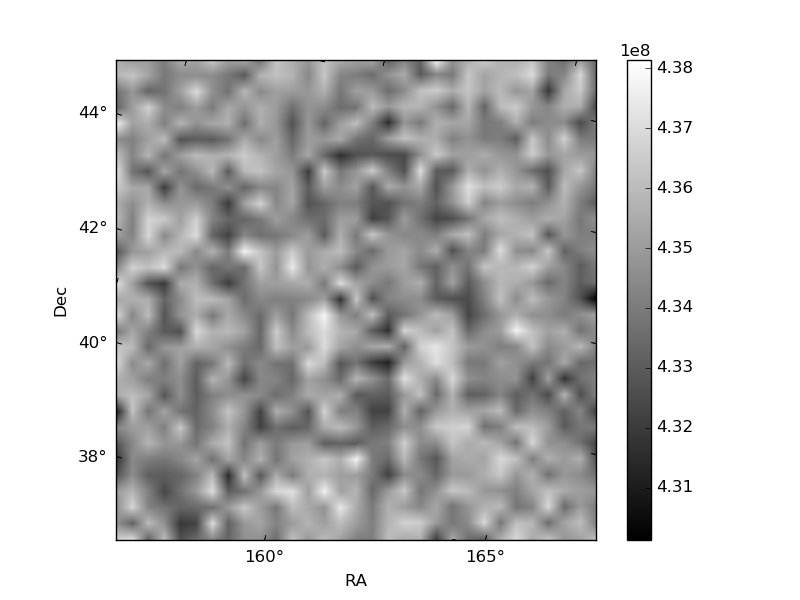
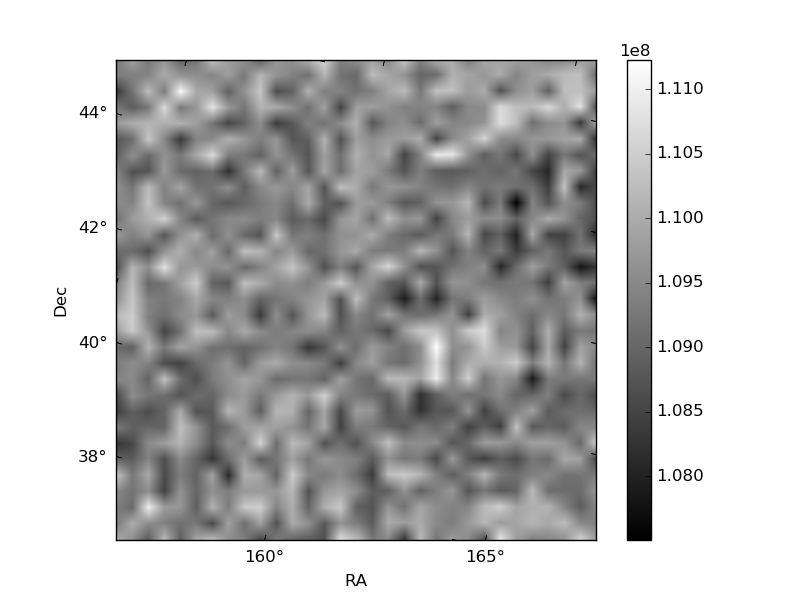
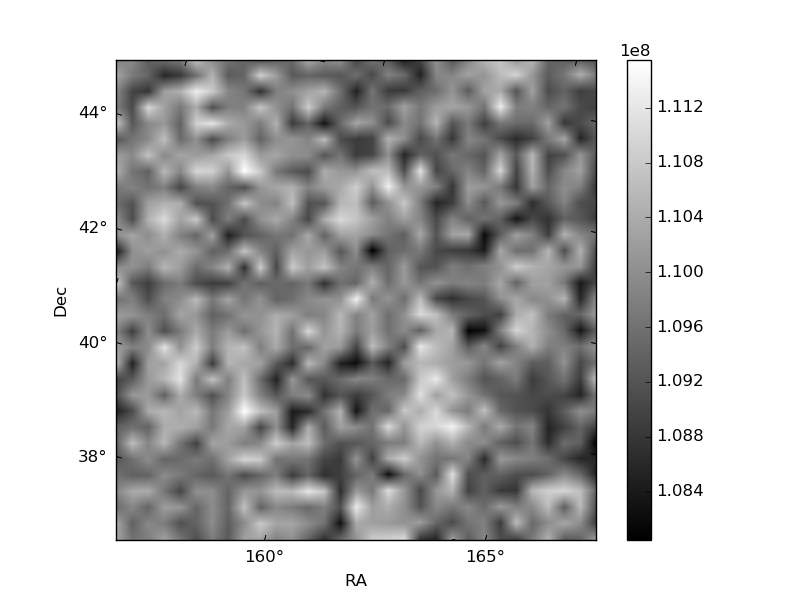
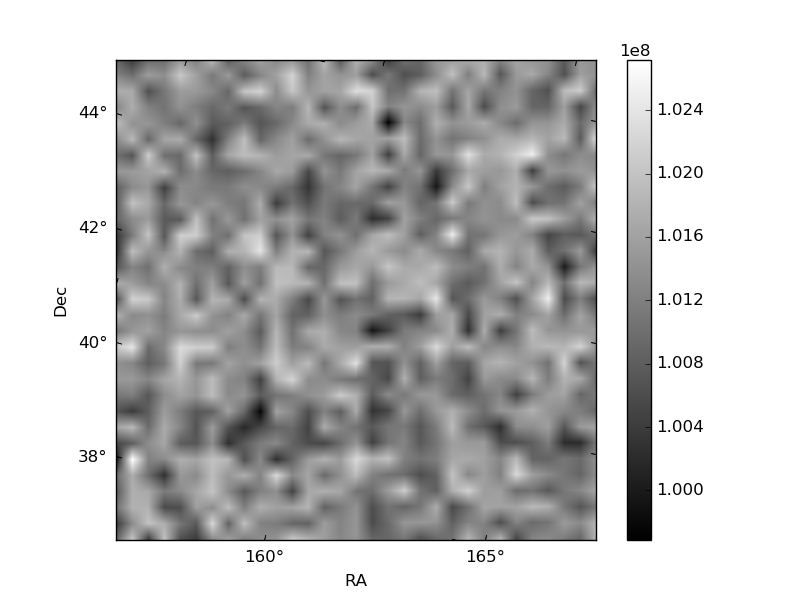
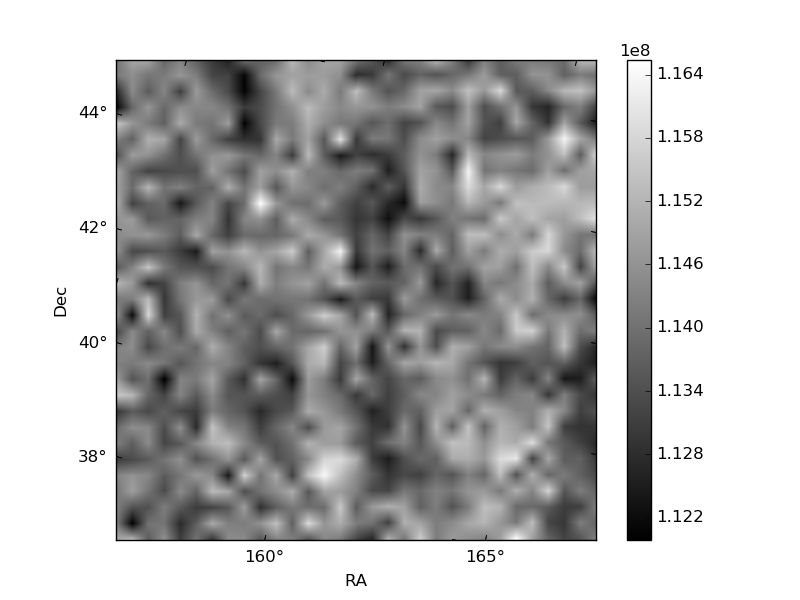
Histogram calculated using DETX and DETY for each event in the final _common_clean file
| Quadrant A | 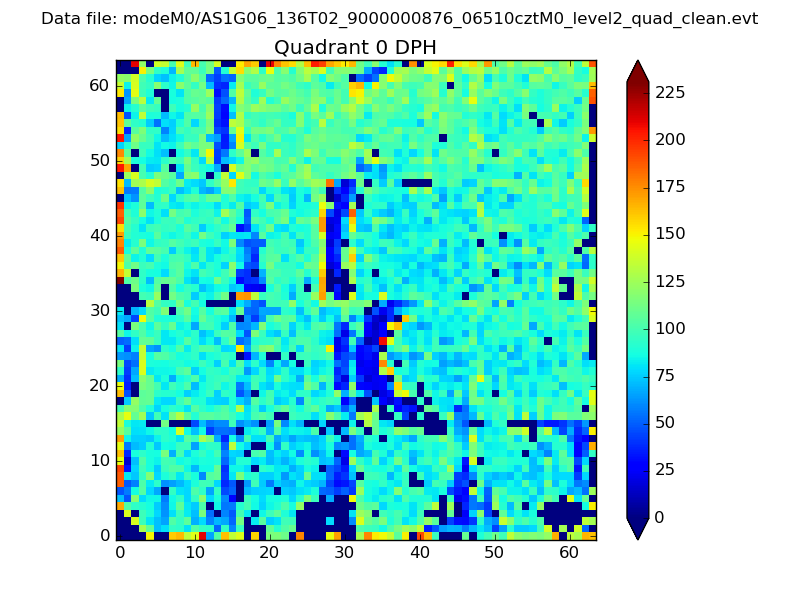 |
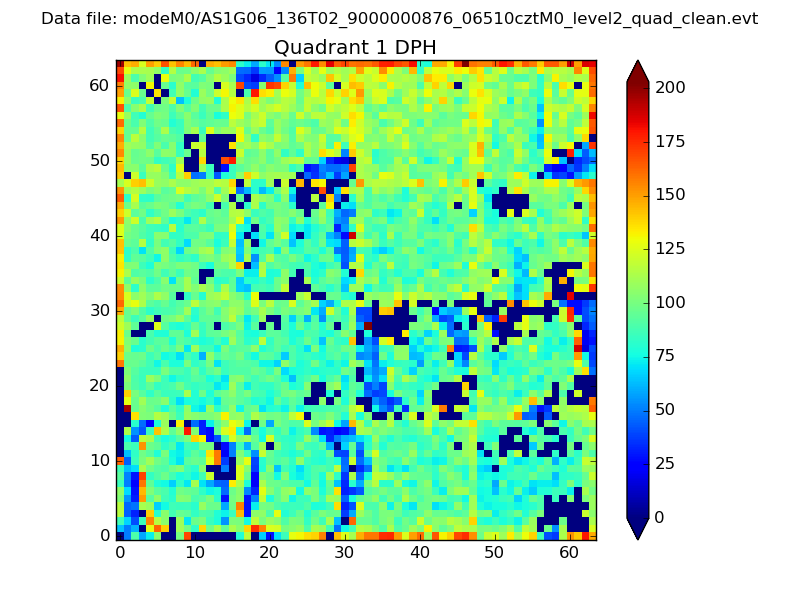 |
Quadrant B |
|---|---|---|---|
| Quadrant D | 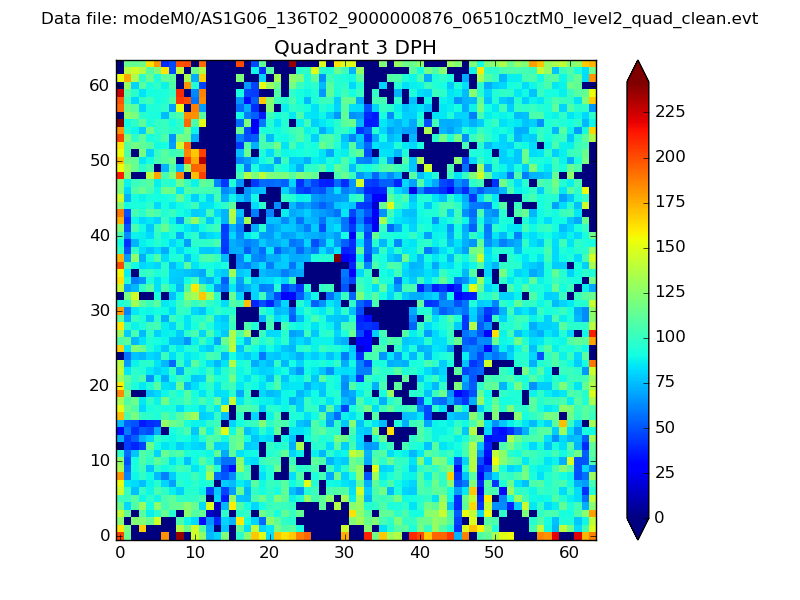 |
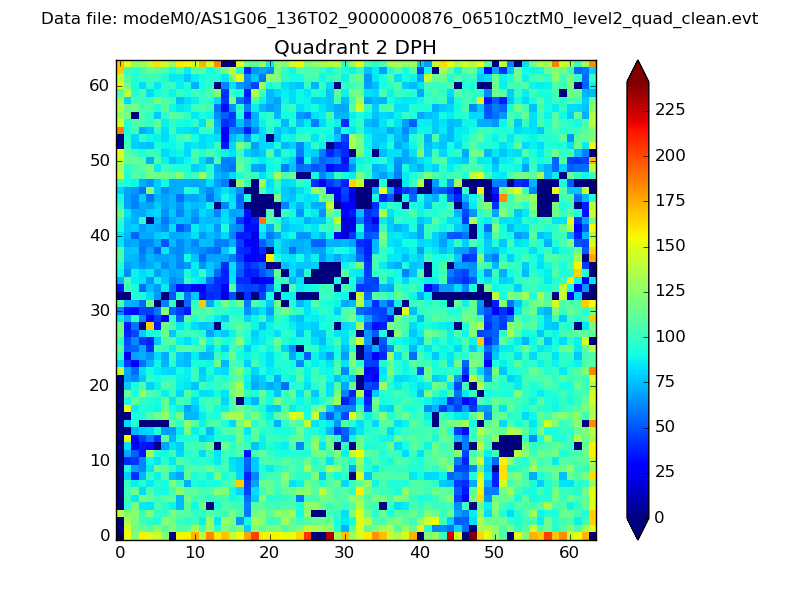 |
Quadrant C |
| Plot type | Count rate plots | Images |
|---|---|---|
| Comparison with Poisson distribution Blue bars denote a histogram of data divided into 1 sec bins. Red curve is a Poisson curve with rate = median count rate of data. |
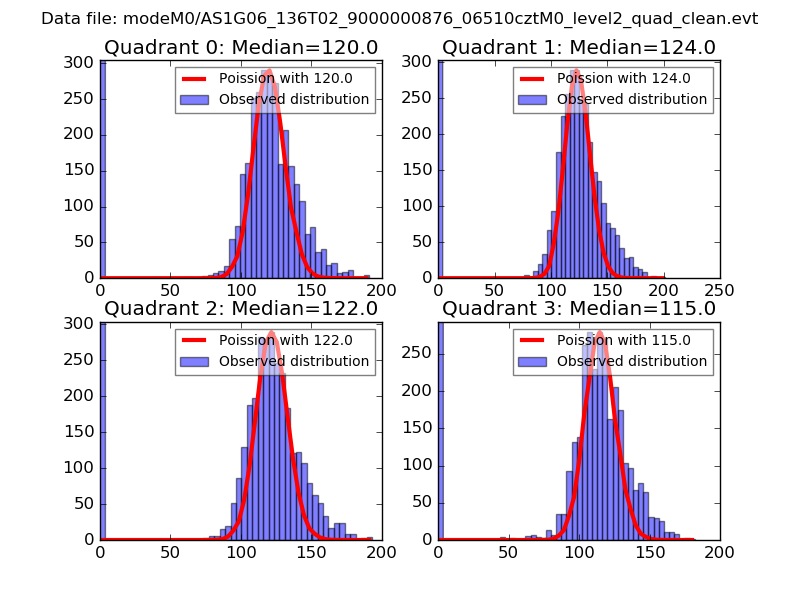 |
 |
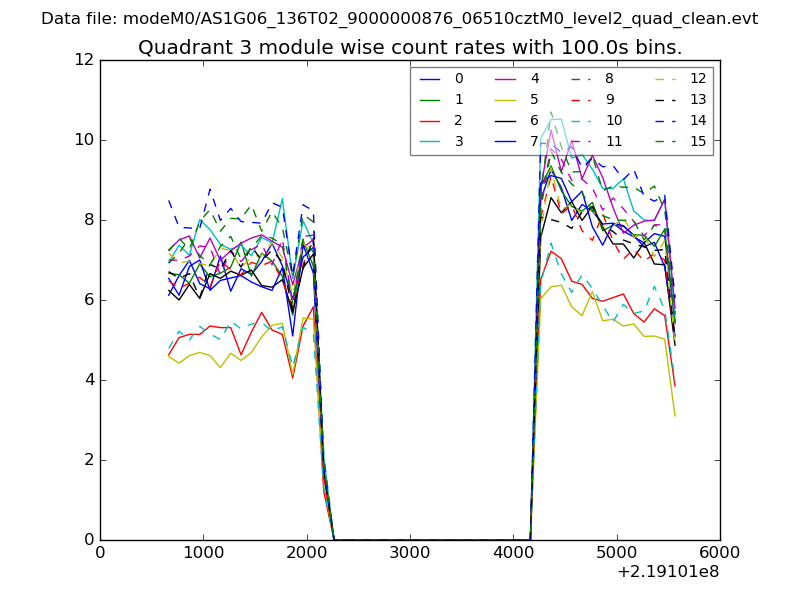
| Quadrant-wise count rates Data is divided into 100 sec bins |
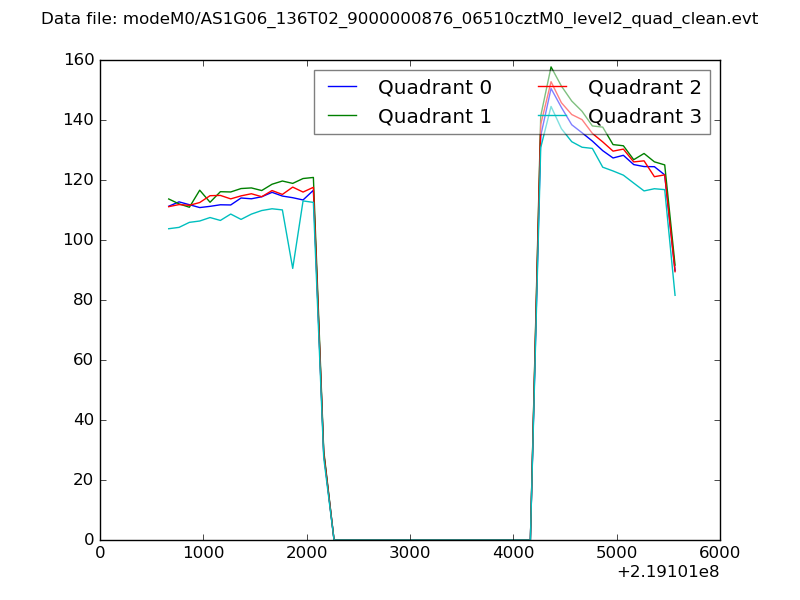 |
|
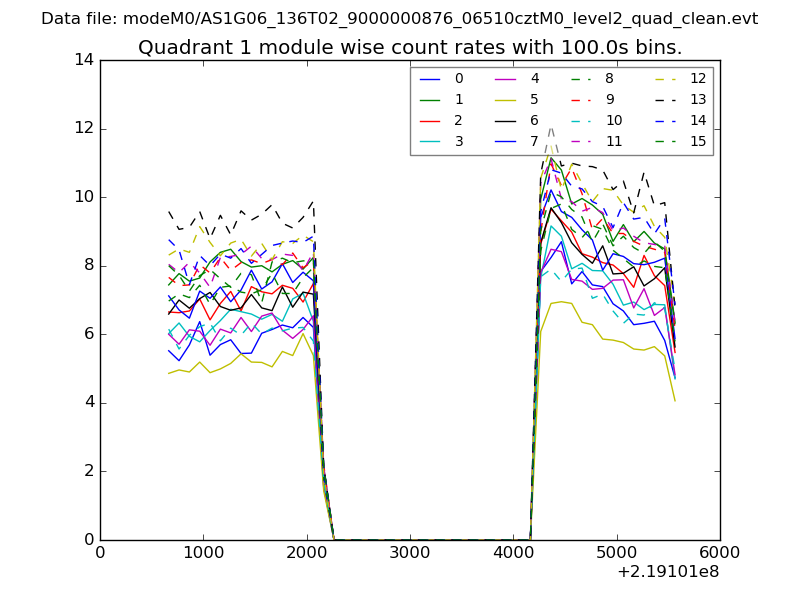
| Module-wise count rates for Quadrant A Data is divided into 100 sec bins |
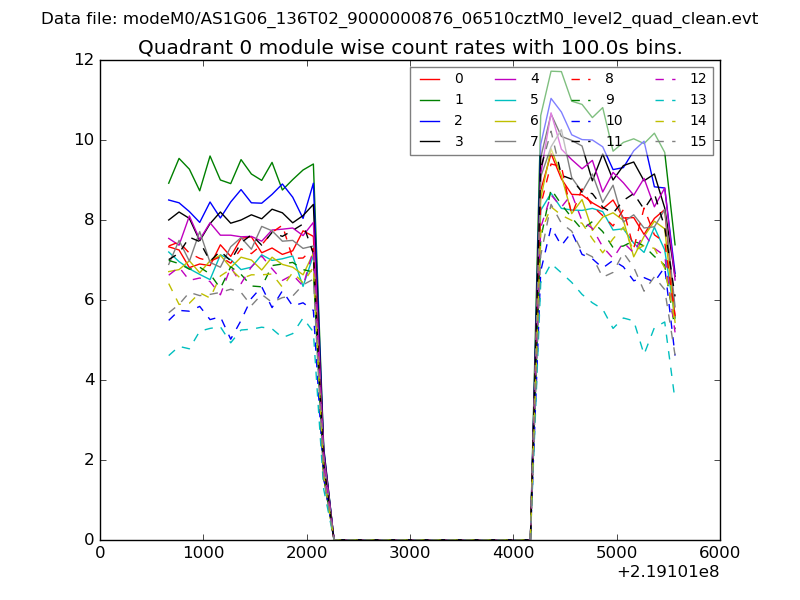 |
 |
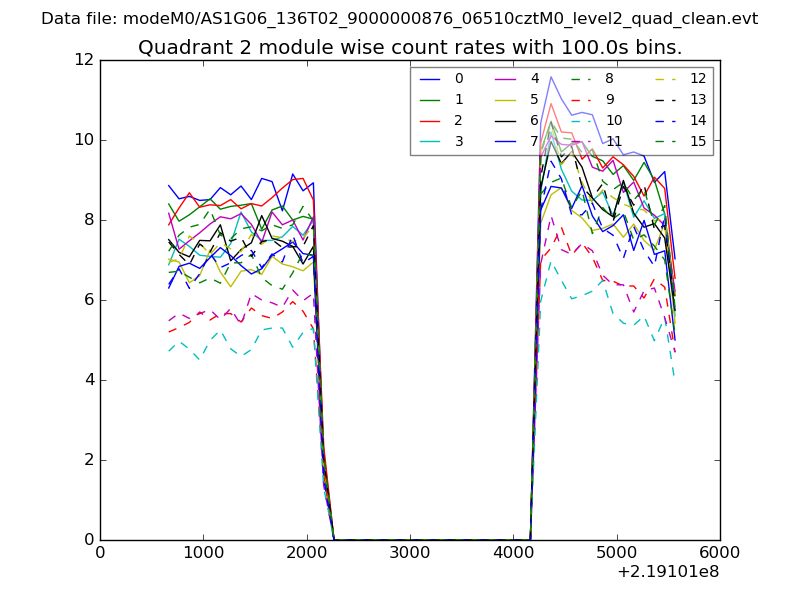
| Module-wise count rates for Quadrant B Data is divided into 100 sec bins |
 |
 |
| Module-wise count rates for Quadrant C Data is divided into 100 sec bins |
 |
 |
| Module-wise count rates for Quadrant D Data is divided into 100 sec bins |
 |
 |
| Parameter | Plot |
|---|---|
| CZT HV Monitor | 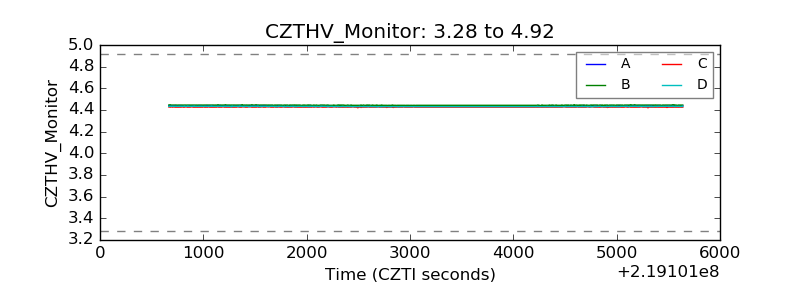 |
| D_VDD | 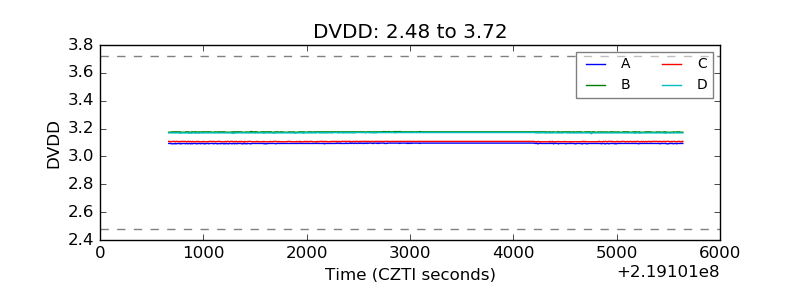 |
| Temperature 1 | 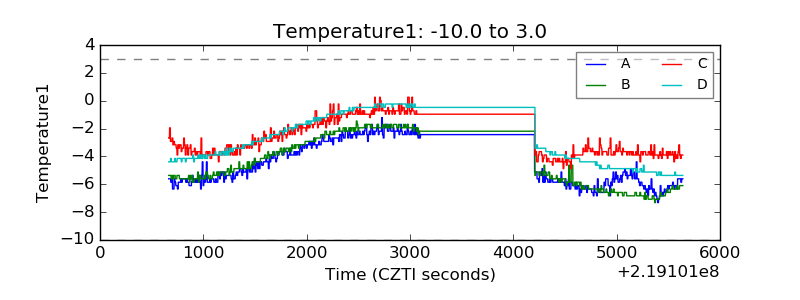 |
| Veto HV Monitor | 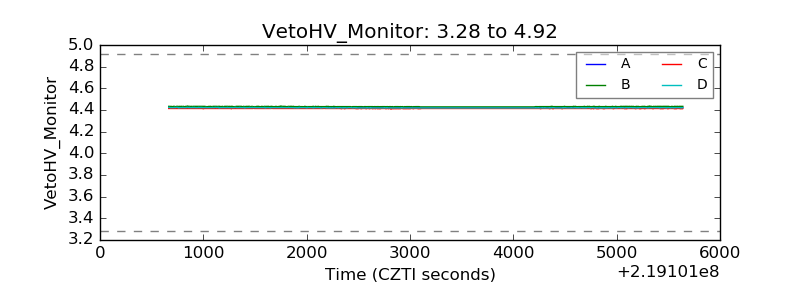 |
| Veto LLD | 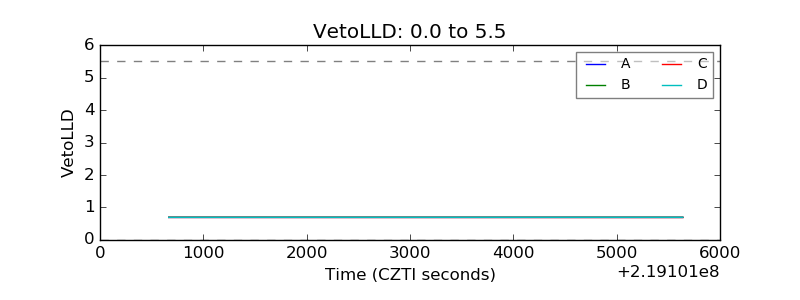 |
| Alpha Counter | 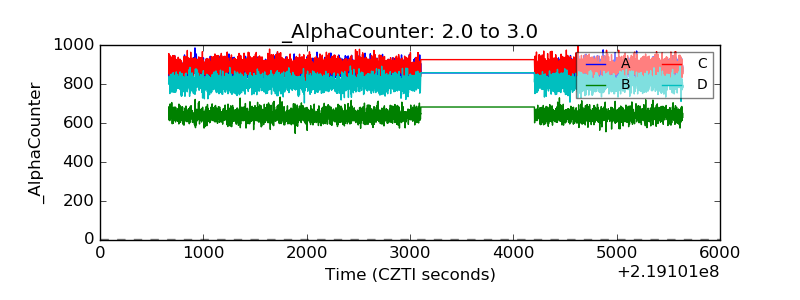 |
| _CPM_Rate | 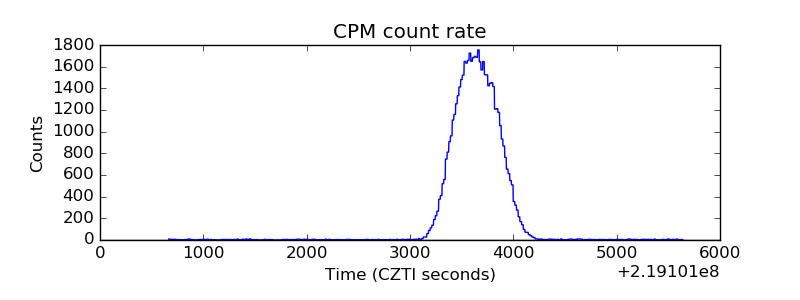 |
| CZT Counter | 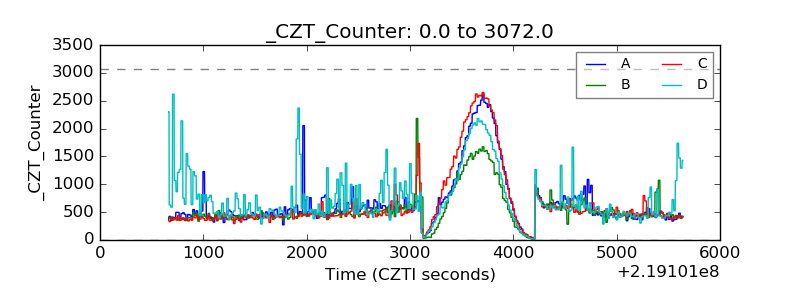 |
| +2.5 Volts monitor |  |
| +5 Volts monitor | 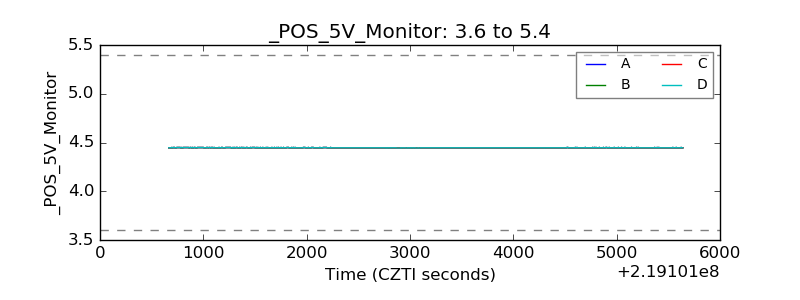 |
| _ROLL_ROT | 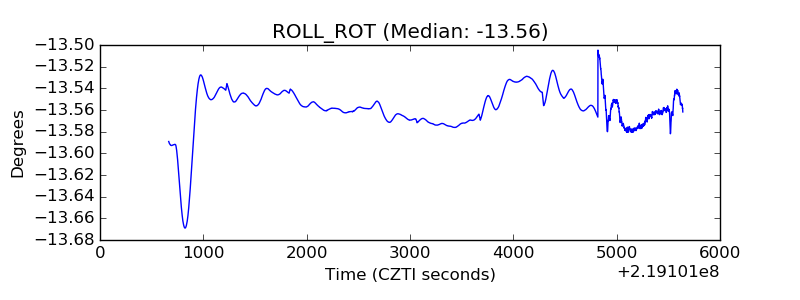 |
| _Roll_DEC | 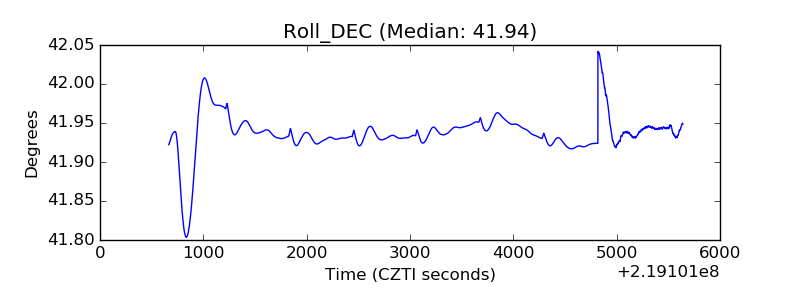 |
| _Roll_RA | 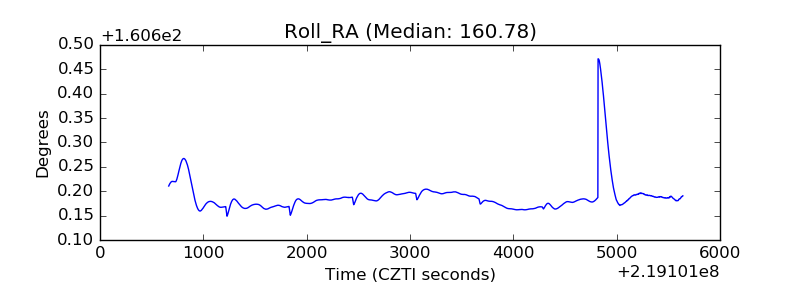 |
| Veto Counter | 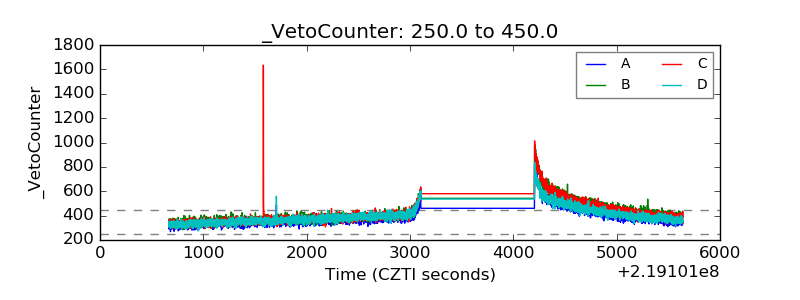 |