| Param | Original file | Final file |
|---|---|---|
| Filename | modeM0/AS1G06_136T02_9000000876_06512cztM0_level2.evt | modeM0/AS1G06_136T02_9000000876_06512cztM0_level2_quad_clean.evt |
| Size (bytes) | 429,117,120 | 100,664,640 |
| Size | 409.2 MB | 96.0 MB |
| Events in quadrant A | 3,109,361 | 653,156 |
| Events in quadrant B | 3,117,357 | 674,062 |
| Events in quadrant C | 2,965,643 | 652,732 |
| Events in quadrant D | 3,359,431 | 613,354 |
| Mode M0 | |||
|---|---|---|---|
| Quadrant | BADHDUFLAG | Total packets | Discarded packets |
| A | 0 | 13719 | 3 |
| B | 0 | 13610 | 2 |
| C | 0 | 13520 | 2 |
| D | 0 | 14658 | 2 |
| Mode M9 | |||
|---|---|---|---|
| Quadrant | BADHDUFLAG | Total packets | Discarded packets |
| A | 0 | 20 | 0 |
| B | 0 | 20 | 0 |
| C | 0 | 20 | 0 |
| D | 0 | 21 | 0 |
| Mode SS | |||
|---|---|---|---|
| Quadrant | BADHDUFLAG | Total packets | Discarded packets |
| A | 0 | 134 | 0 |
| B | 0 | 134 | 0 |
| C | 0 | 134 | 0 |
| D | 0 | 134 | 0 |
| Quadrant | Total seconds | Saturated seconds | Saturation percentage |
|---|---|---|---|
| A | 6523 | 34 | 0.521233% |
| B | 6523 | 29 | 0.444581% |
| C | 6523 | 14 | 0.214625% |
| D | 6523 | 83 | 1.272421% |
Noise dominated data is calculated using 1-second bins in cleaned event files. If a bin has >2000 counts, and if more than 50% of those come from <1% of pixels, then it is considered to be noise-dominated and hence unusable.
| Quadrant | # 1 sec bins | Bins with >0 counts | Bins with >2000 counts | High rate bins dominated by noise | Noise dominated (total time) | Noise dominated (detector-on time) | Marked lightcurve |
|---|---|---|---|---|---|---|---|
| A | 7823 | 6524 | 0 | 0 | 0.00% | 0.00% | 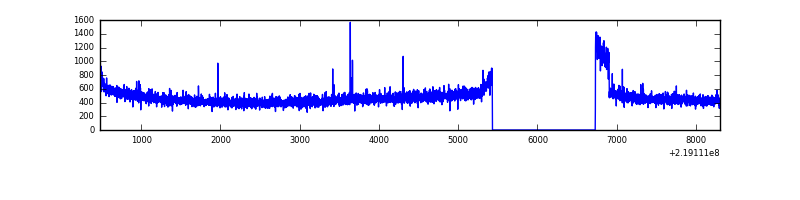 |
| B | 7823 | 6524 | 2 | 2 | 0.03% | 0.03% | 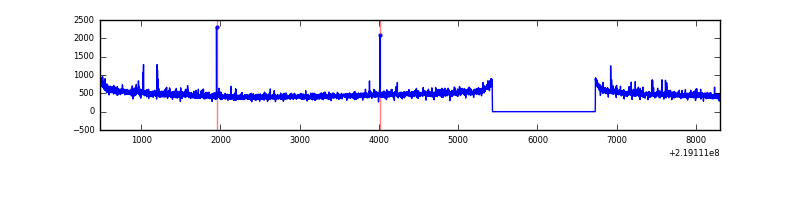 |
| C | 7823 | 6524 | 0 | 0 | 0.00% | 0.00% | 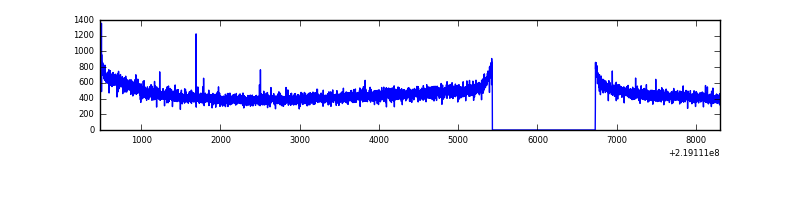 |
| D | 7823 | 6524 | 41 | 41 | 0.52% | 0.63% | 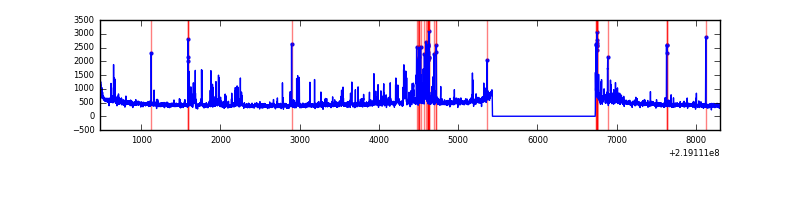 |
Top three noisy pixels from each quadrant. If the there are fewer than three noisy pixels in the level2.evt file, extra rows are filled as -1
| Pixel properties | Quadrant properties | ||||||
|---|---|---|---|---|---|---|---|
| Quadrant | DetID | PixID | Counts | Sigma | Mean | Median | Sigma |
| A | 15 | 236 | 99356 | 631.22 | 771 | 756 | 156.2 |
| A | 8 | 15 | 40081 | 251.75 | 771 | 756 | 156.2 |
| A | 0 | 226 | 7526 | 43.34 | 771 | 756 | 156.2 |
| B | 0 | 219 | 15289 | 98.15 | 785 | 766 | 148.0 |
| B | 4 | 81 | 14750 | 94.51 | 785 | 766 | 148.0 |
| B | 12 | 111 | 14676 | 94.01 | 785 | 766 | 148.0 |
| C | 1 | 16 | 31701 | 179.17 | 750 | 755 | 172.7 |
| C | 13 | 61 | 6019 | 30.48 | 750 | 755 | 172.7 |
| C | 12 | 4 | 3170 | 13.98 | 750 | 755 | 172.7 |
| D | 2 | 152 | 322565 | 1786.9 | 736 | 712 | 180.1 |
| D | 10 | 172 | 71279 | 391.78 | 736 | 712 | 180.1 |
| D | 2 | 14 | 44471 | 242.95 | 736 | 712 | 180.1 |
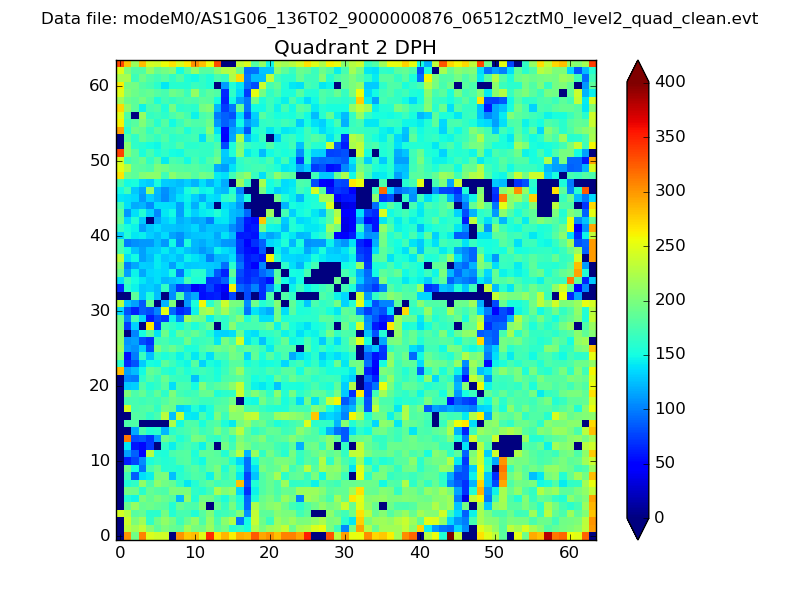
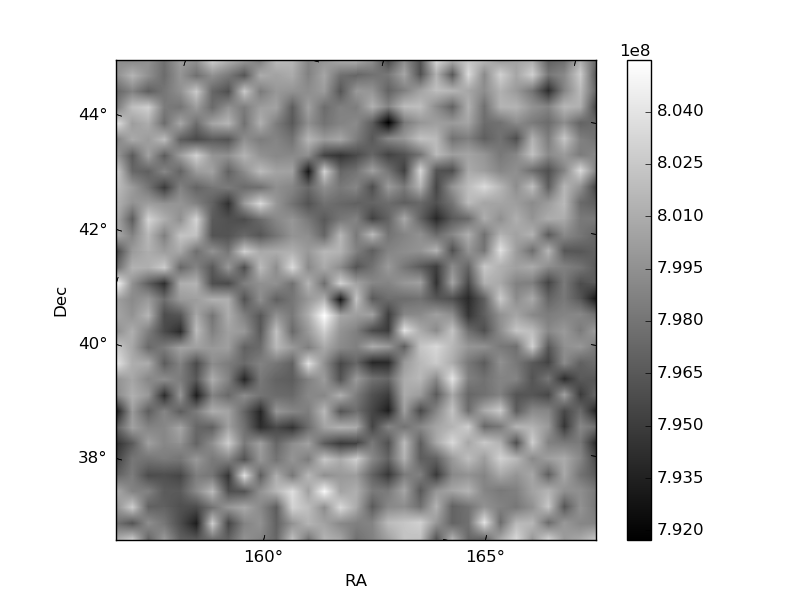
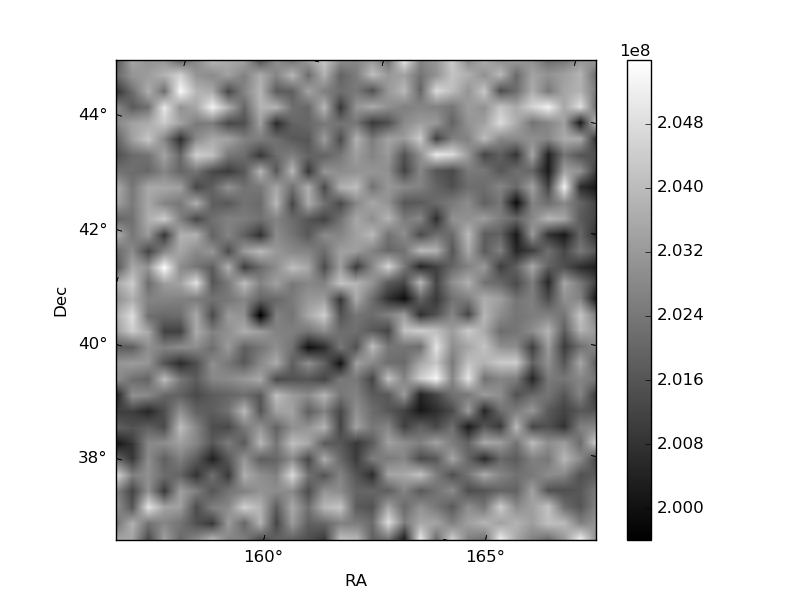
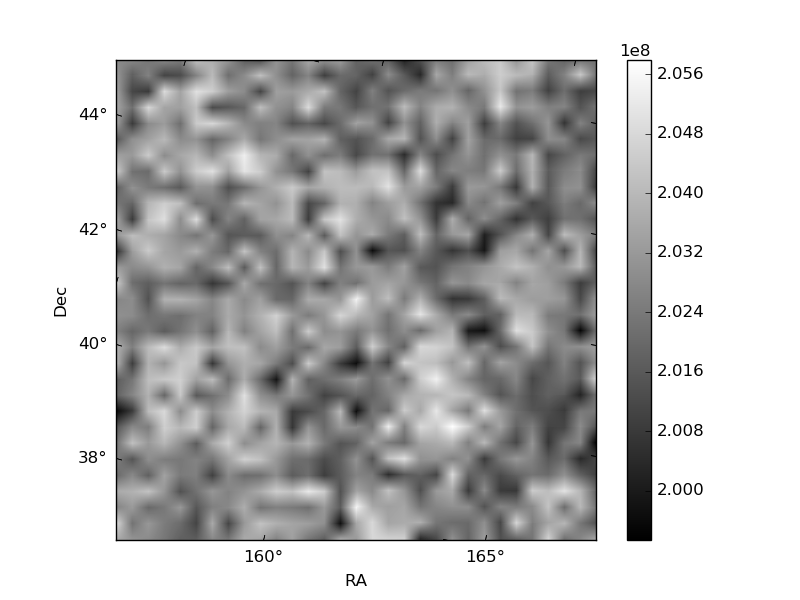
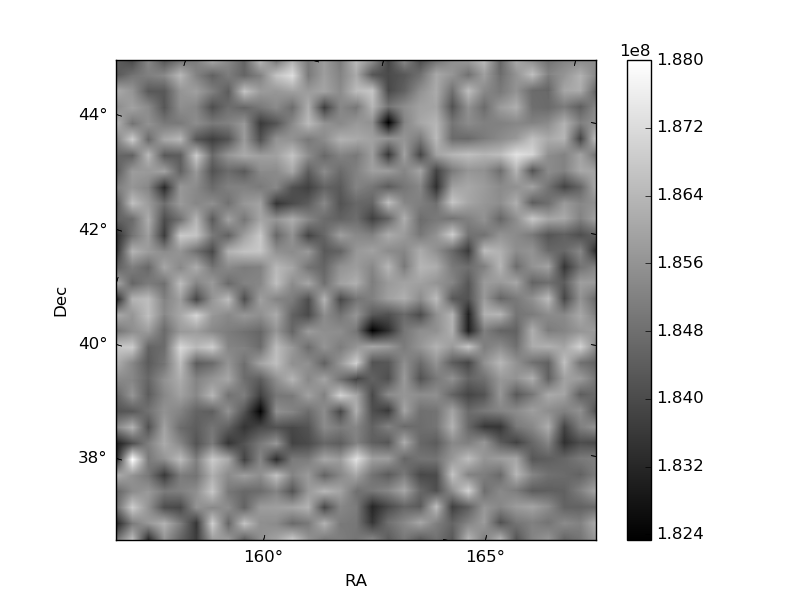
Histogram calculated using DETX and DETY for each event in the final _common_clean file
| Quadrant A | 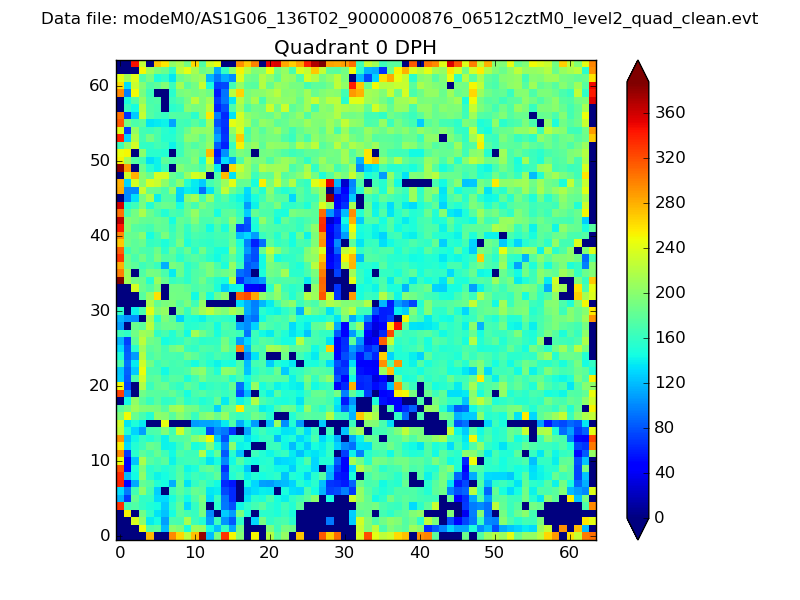 |
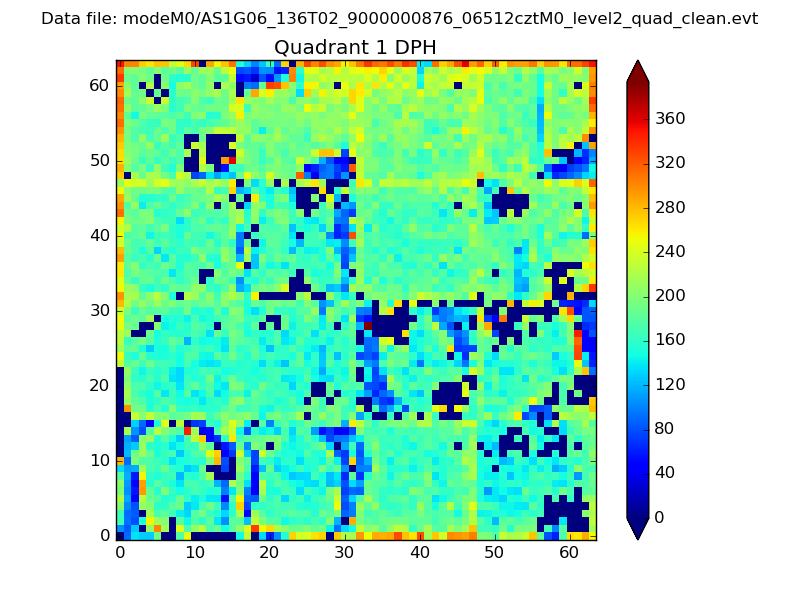 |
Quadrant B |
|---|---|---|---|
| Quadrant D | 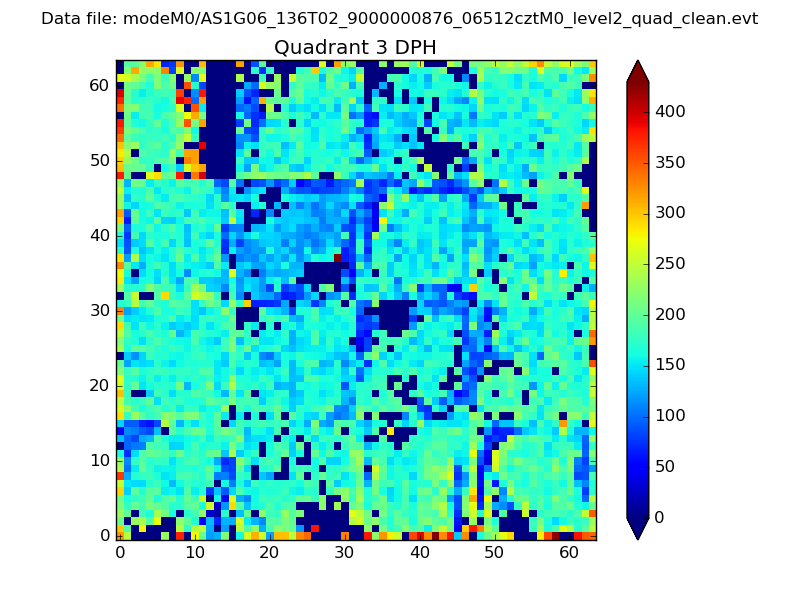 |
 |
Quadrant C |
| Plot type | Count rate plots | Images |
|---|---|---|
| Comparison with Poisson distribution Blue bars denote a histogram of data divided into 1 sec bins. Red curve is a Poisson curve with rate = median count rate of data. |
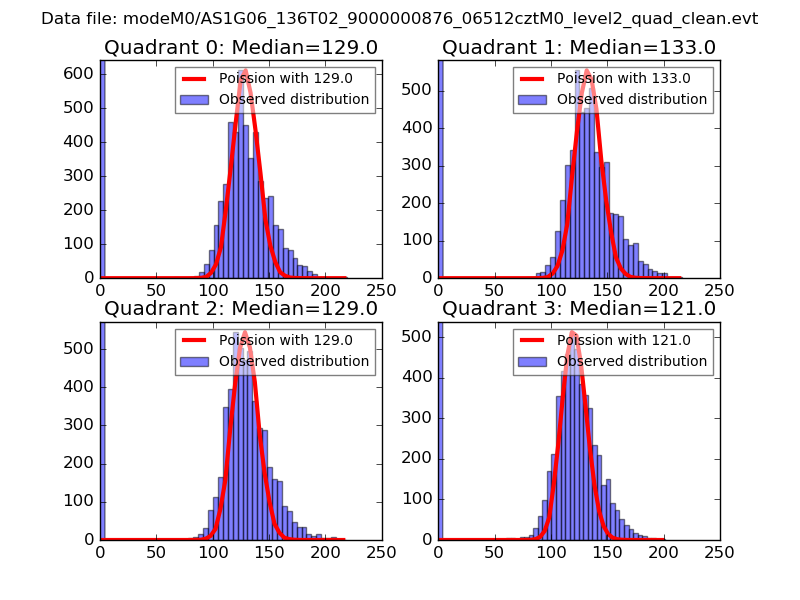 |
 |
| Quadrant-wise count rates Data is divided into 100 sec bins |
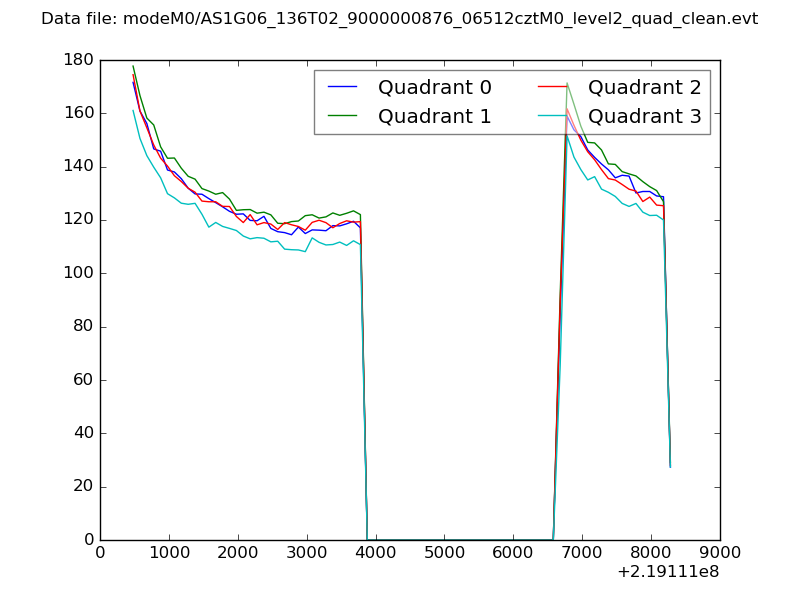 |
|
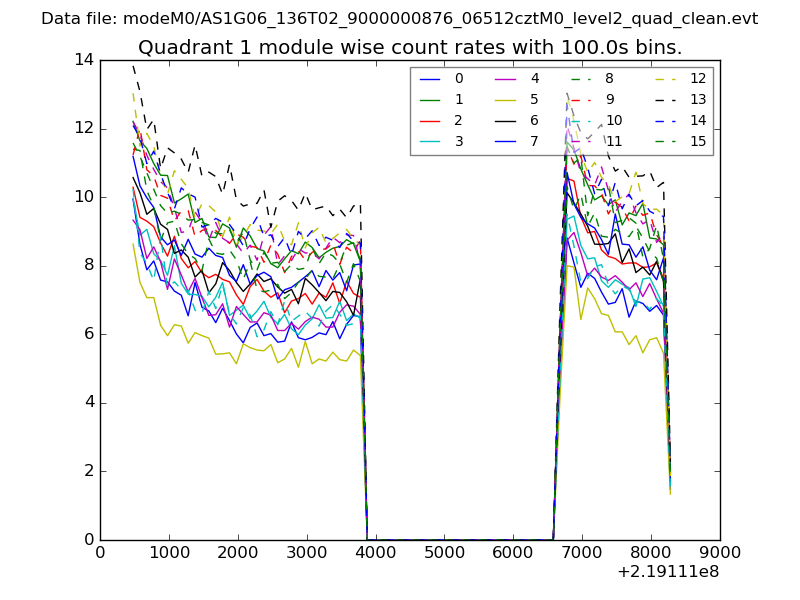
| Module-wise count rates for Quadrant A Data is divided into 100 sec bins |
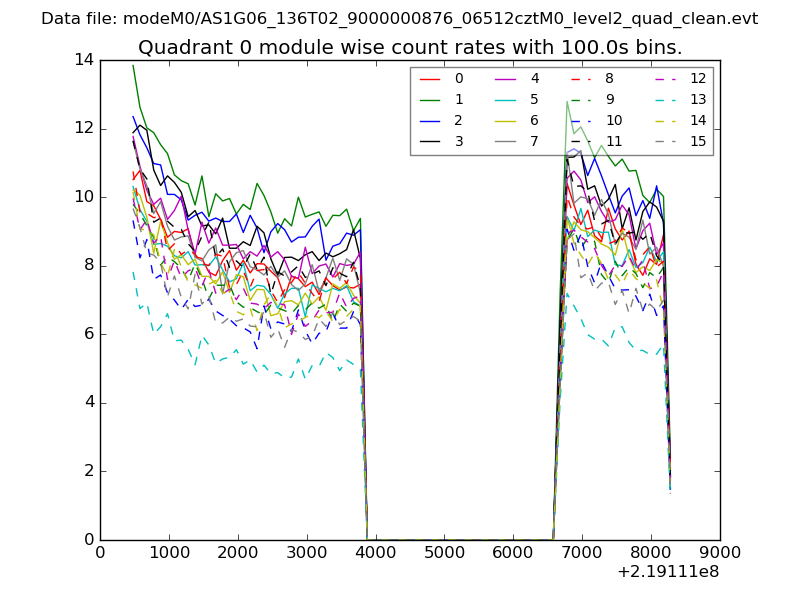 |
 |
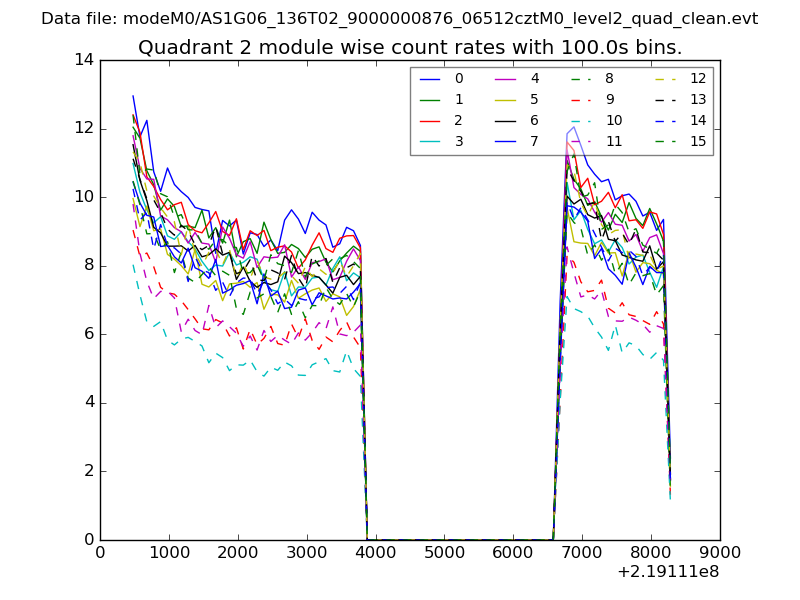
| Module-wise count rates for Quadrant B Data is divided into 100 sec bins |
 |
 |
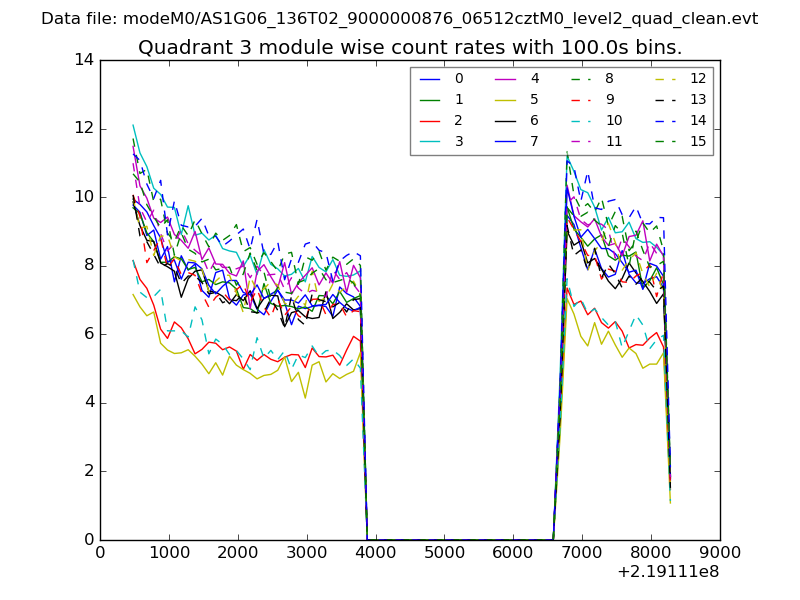
| Module-wise count rates for Quadrant C Data is divided into 100 sec bins |
 |
 |
| Module-wise count rates for Quadrant D Data is divided into 100 sec bins |
 |
 |
| Parameter | Plot |
|---|---|
| CZT HV Monitor | 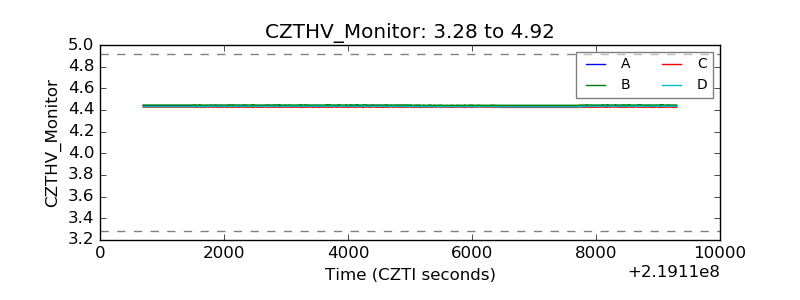 |
| D_VDD | 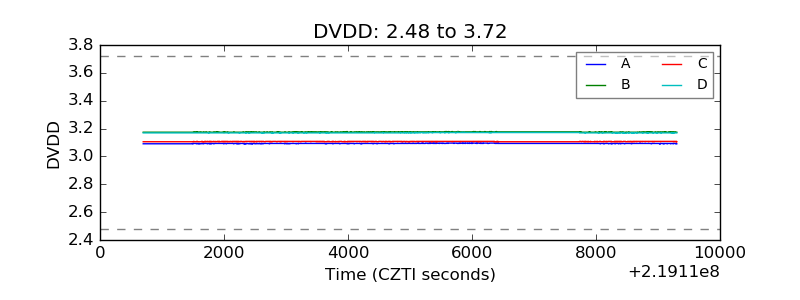 |
| Temperature 1 | 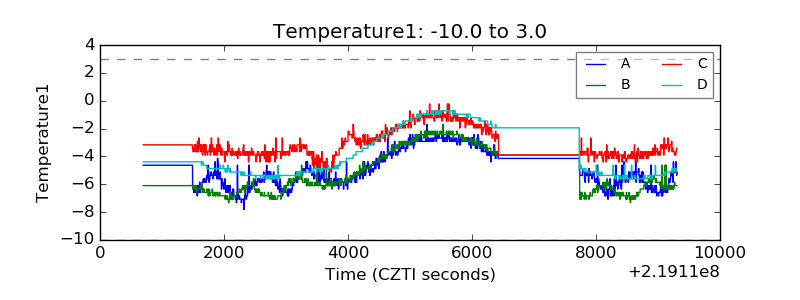 |
| Veto HV Monitor | 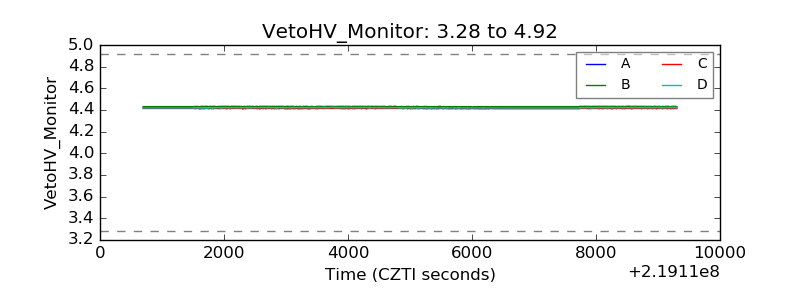 |
| Veto LLD | 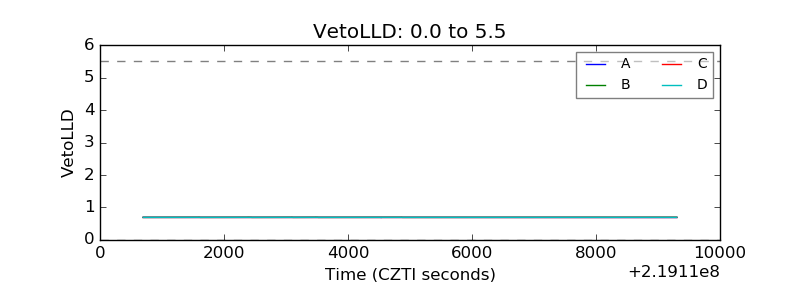 |
| Alpha Counter | 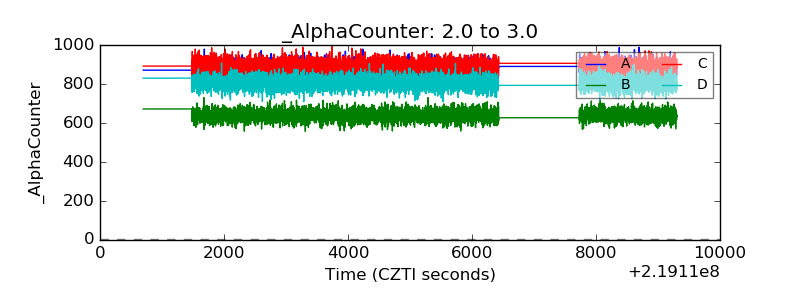 |
| _CPM_Rate | 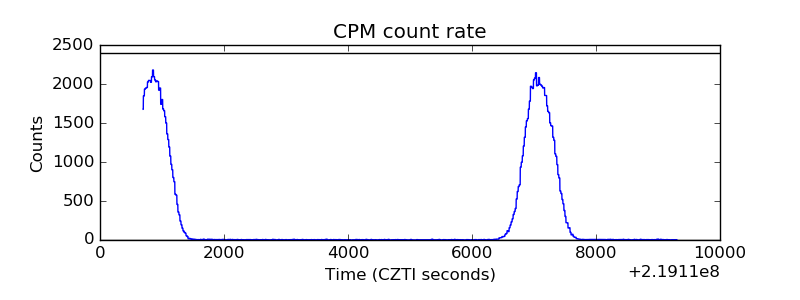 |
| CZT Counter | 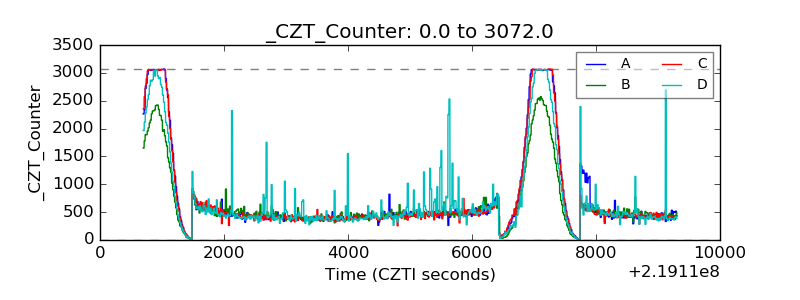 |
| +2.5 Volts monitor |  |
| +5 Volts monitor | 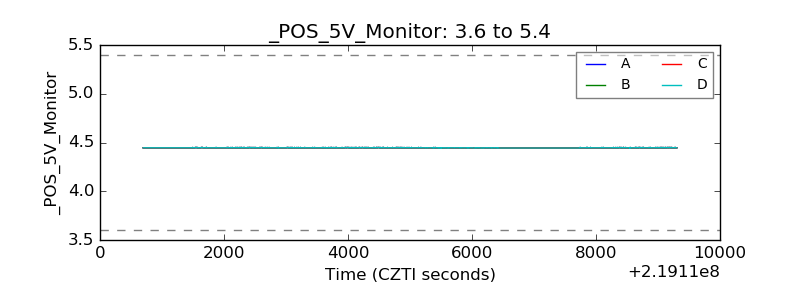 |
| _ROLL_ROT | 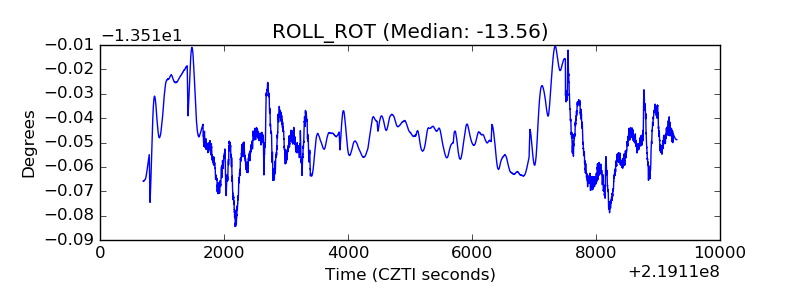 |
| _Roll_DEC | 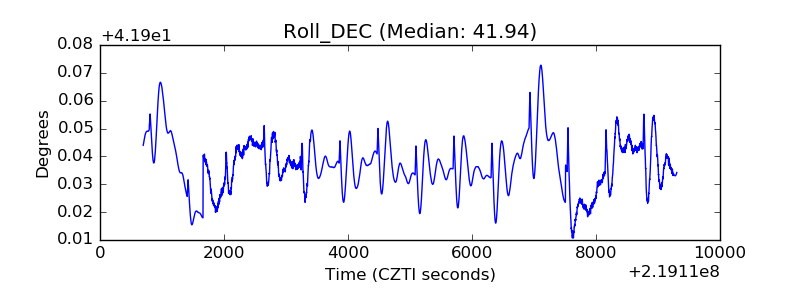 |
| _Roll_RA | 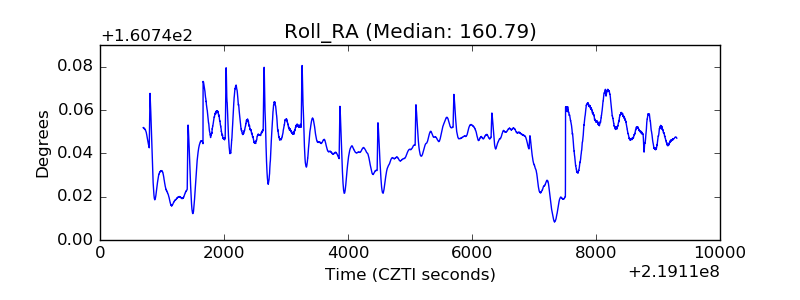 |
| Veto Counter | 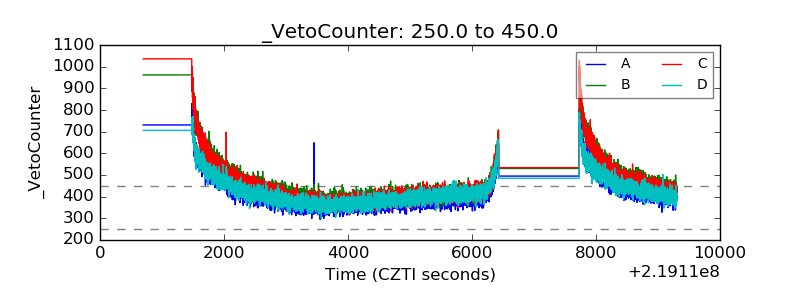 |