| Param | Original file | Final file |
|---|---|---|
| Filename | modeM0/AS1G06_136T02_9000000876_06513cztM0_level2.evt | modeM0/AS1G06_136T02_9000000876_06513cztM0_level2_quad_clean.evt |
| Size (bytes) | 428,152,320 | 94,674,240 |
| Size | 408.3 MB | 90.3 MB |
| Events in quadrant A | 3,187,214 | 608,909 |
| Events in quadrant B | 3,130,524 | 626,296 |
| Events in quadrant C | 2,944,047 | 604,963 |
| Events in quadrant D | 3,260,080 | 570,943 |
| Mode M0 | |||
|---|---|---|---|
| Quadrant | BADHDUFLAG | Total packets | Discarded packets |
| A | 0 | 13898 | 3 |
| B | 0 | 13629 | 2 |
| C | 0 | 13363 | 2 |
| D | 0 | 14362 | 2 |
| Mode M9 | |||
|---|---|---|---|
| Quadrant | BADHDUFLAG | Total packets | Discarded packets |
| A | 0 | 17 | 0 |
| B | 0 | 17 | 0 |
| C | 0 | 17 | 0 |
| D | 0 | 18 | 0 |
| Mode SS | |||
|---|---|---|---|
| Quadrant | BADHDUFLAG | Total packets | Discarded packets |
| A | 0 | 134 | 0 |
| B | 0 | 134 | 0 |
| C | 0 | 134 | 0 |
| D | 0 | 134 | 0 |
| Quadrant | Total seconds | Saturated seconds | Saturation percentage |
|---|---|---|---|
| A | 6534 | 34 | 0.520355% |
| B | 6534 | 43 | 0.658096% |
| C | 6534 | 9 | 0.137741% |
| D | 6534 | 57 | 0.872360% |
Noise dominated data is calculated using 1-second bins in cleaned event files. If a bin has >2000 counts, and if more than 50% of those come from <1% of pixels, then it is considered to be noise-dominated and hence unusable.
| Quadrant | # 1 sec bins | Bins with >0 counts | Bins with >2000 counts | High rate bins dominated by noise | Noise dominated (total time) | Noise dominated (detector-on time) | Marked lightcurve |
|---|---|---|---|---|---|---|---|
| A | 7869 | 6535 | 0 | 0 | 0.00% | 0.00% | 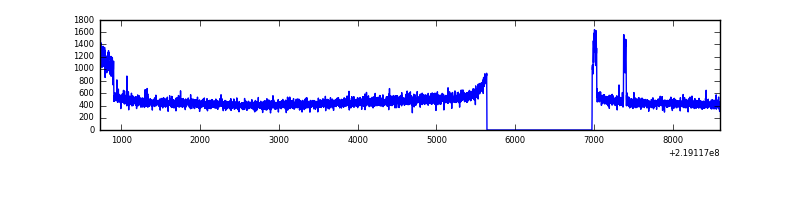 |
| B | 7869 | 6535 | 3 | 3 | 0.04% | 0.05% | 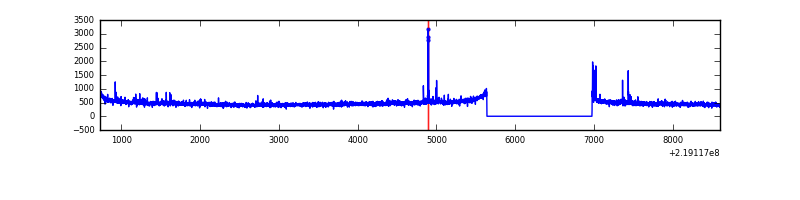 |
| C | 7869 | 6535 | 0 | 0 | 0.00% | 0.00% | 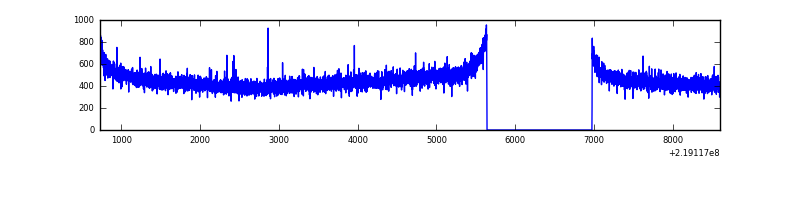 |
| D | 7869 | 6535 | 30 | 30 | 0.38% | 0.46% | 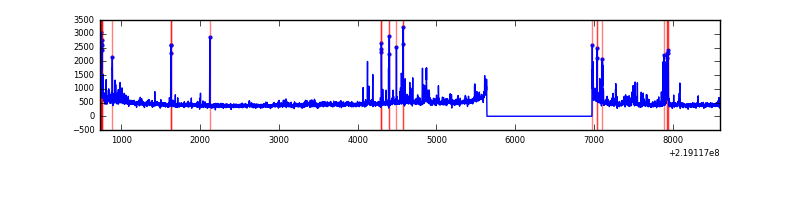 |
Top three noisy pixels from each quadrant. If the there are fewer than three noisy pixels in the level2.evt file, extra rows are filled as -1
| Pixel properties | Quadrant properties | ||||||
|---|---|---|---|---|---|---|---|
| Quadrant | DetID | PixID | Counts | Sigma | Mean | Median | Sigma |
| A | 15 | 236 | 168411 | 1074.35 | 775 | 758 | 156.1 |
| A | 8 | 15 | 33882 | 212.27 | 775 | 758 | 156.1 |
| A | 0 | 226 | 7496 | 43.18 | 775 | 758 | 156.1 |
| B | 0 | 219 | 24617 | 161.94 | 784 | 768 | 147.3 |
| B | 4 | 48 | 22862 | 150.03 | 784 | 768 | 147.3 |
| B | 5 | 32 | 16931 | 109.75 | 784 | 768 | 147.3 |
| C | 8 | 128 | 6495 | 33.39 | 749 | 754 | 172.0 |
| C | 4 | 254 | 6298 | 32.24 | 749 | 754 | 172.0 |
| C | 13 | 61 | 5964 | 30.3 | 749 | 754 | 172.0 |
| D | 2 | 152 | 134411 | 749.73 | 741 | 718 | 178.3 |
| D | 2 | 136 | 86834 | 482.93 | 741 | 718 | 178.3 |
| D | 2 | 14 | 48398 | 267.38 | 741 | 718 | 178.3 |
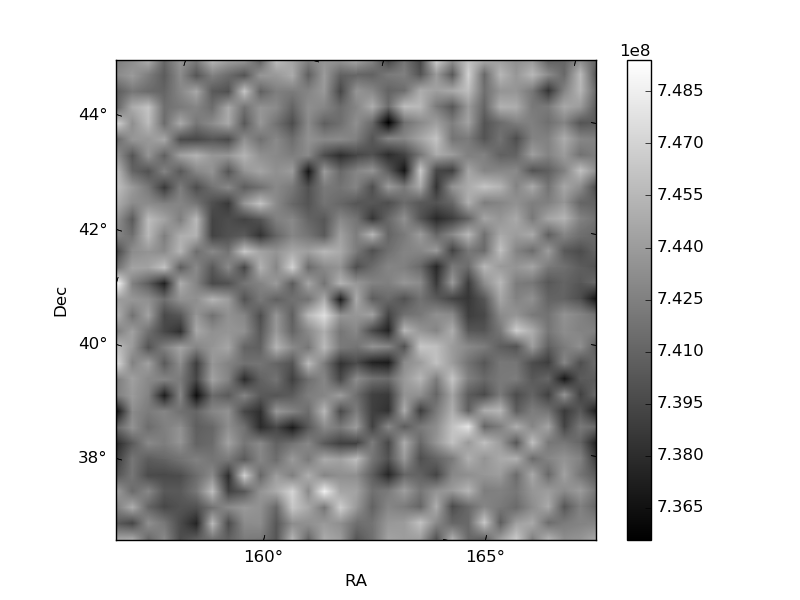
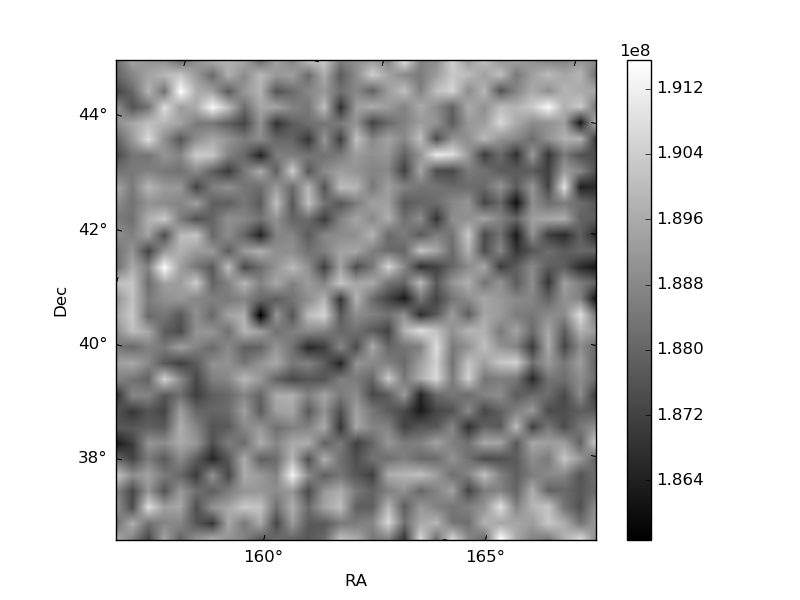
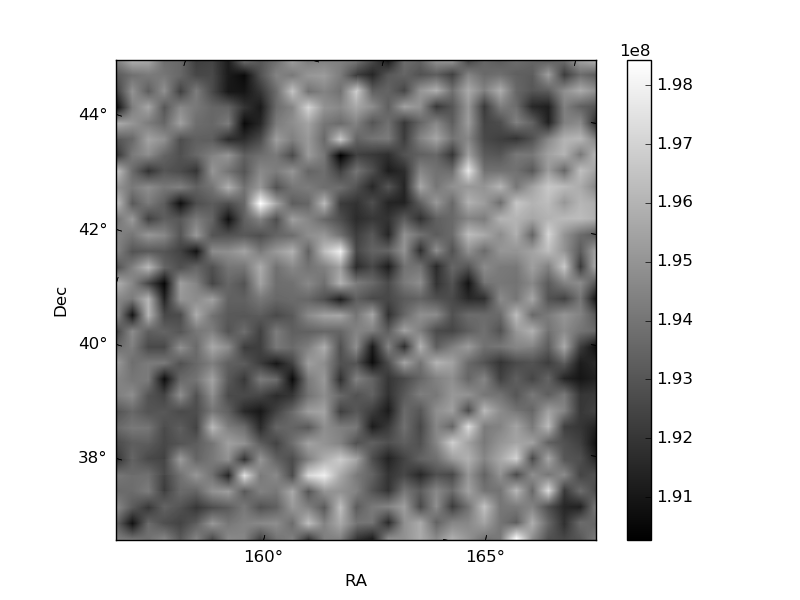
Histogram calculated using DETX and DETY for each event in the final _common_clean file
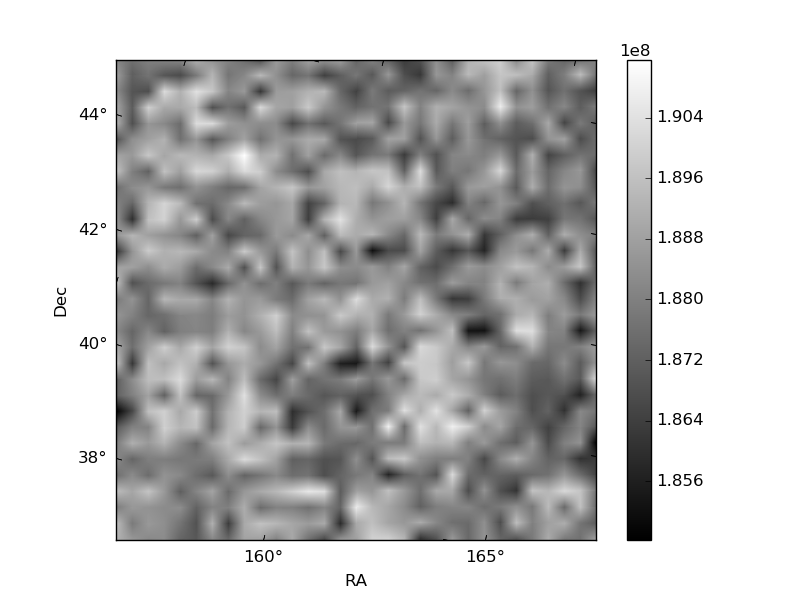
| Quadrant A | 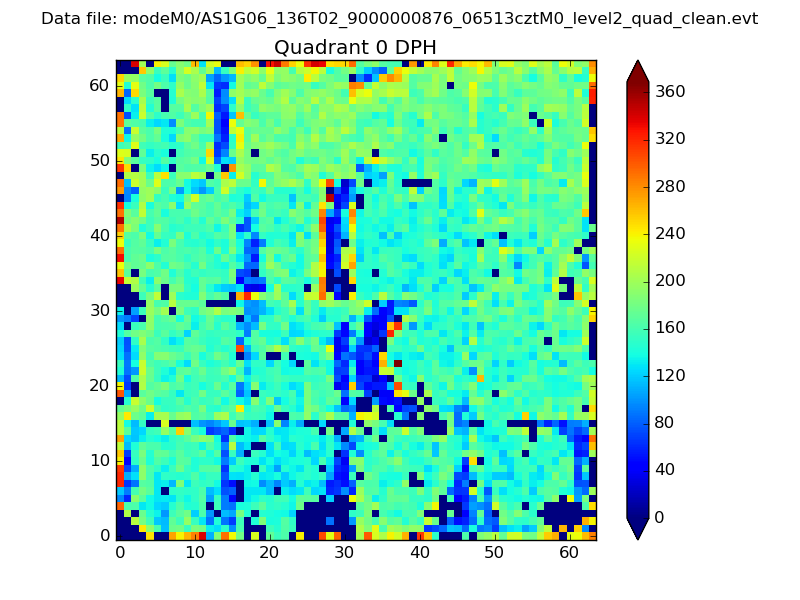 |
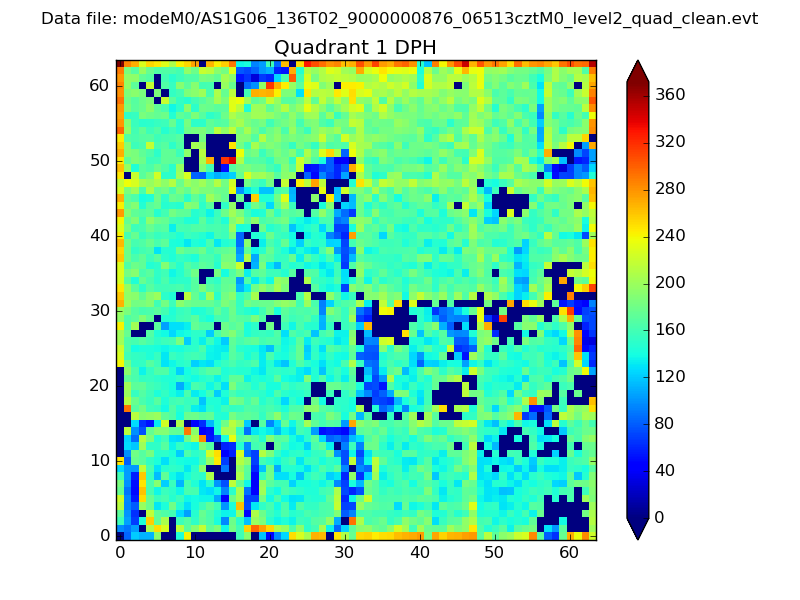 |
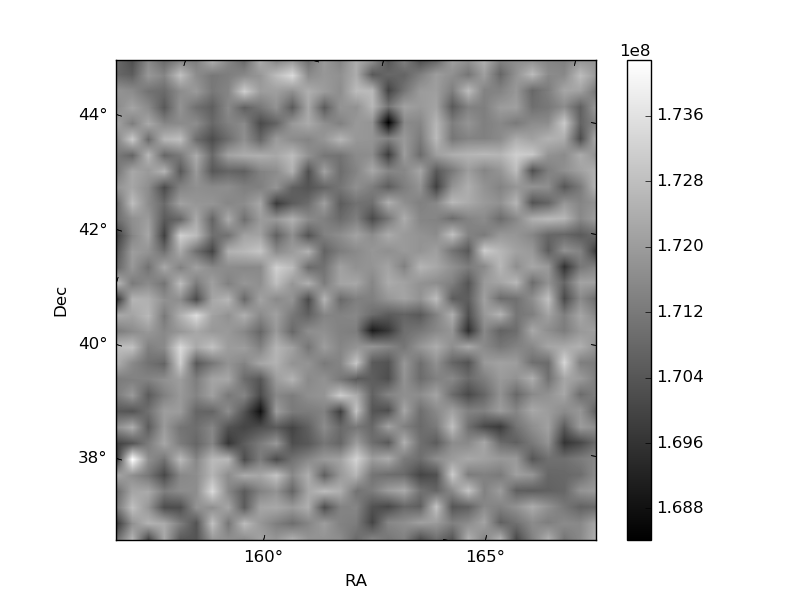
Quadrant B |
|---|---|---|---|
| Quadrant D | 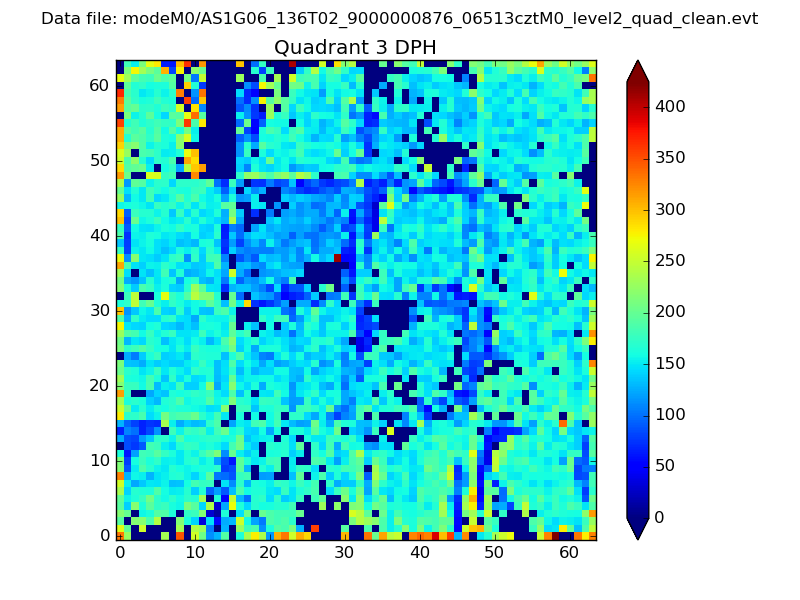 |
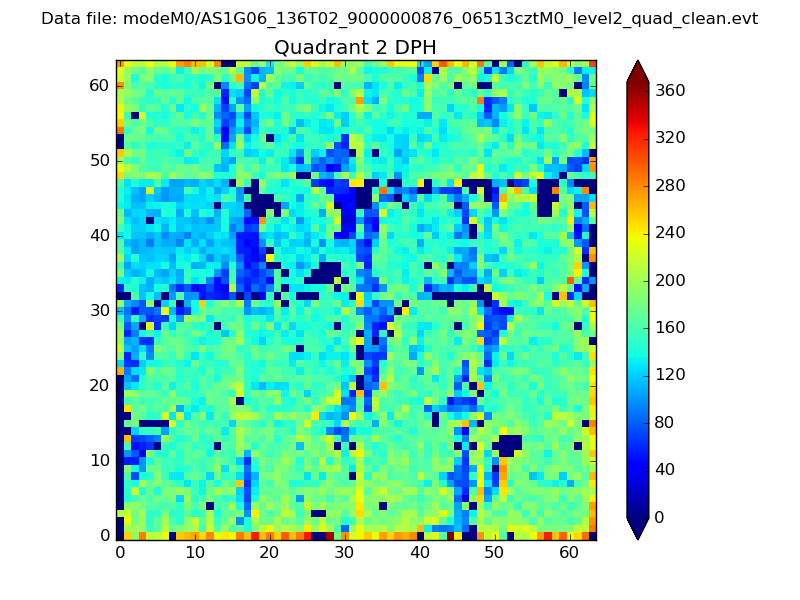 |
Quadrant C |
| Plot type | Count rate plots | Images |
|---|---|---|
| Comparison with Poisson distribution Blue bars denote a histogram of data divided into 1 sec bins. Red curve is a Poisson curve with rate = median count rate of data. |
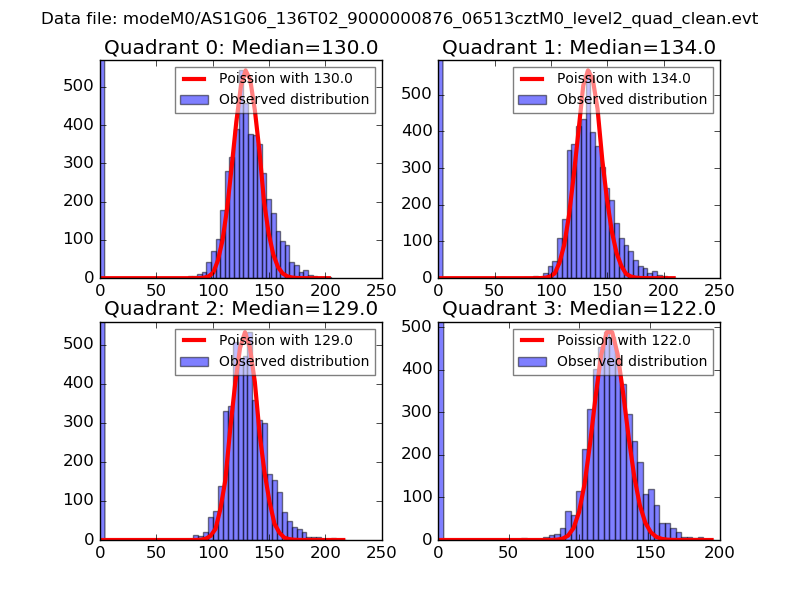 |
 |
| Quadrant-wise count rates Data is divided into 100 sec bins |
 |
|
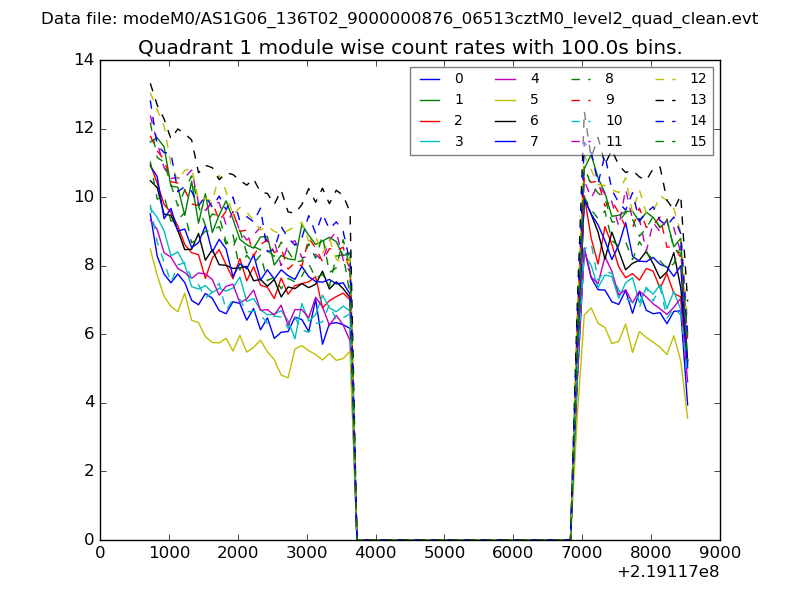
| Module-wise count rates for Quadrant A Data is divided into 100 sec bins |
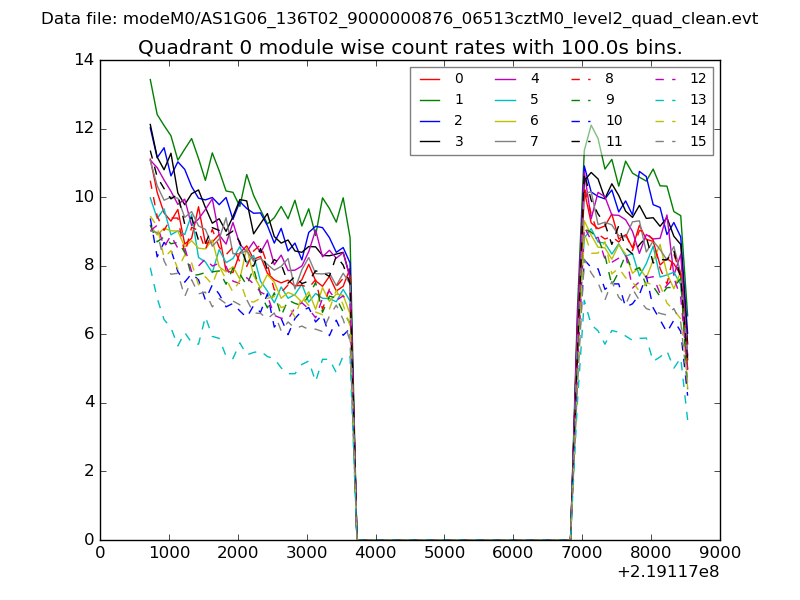 |
 |
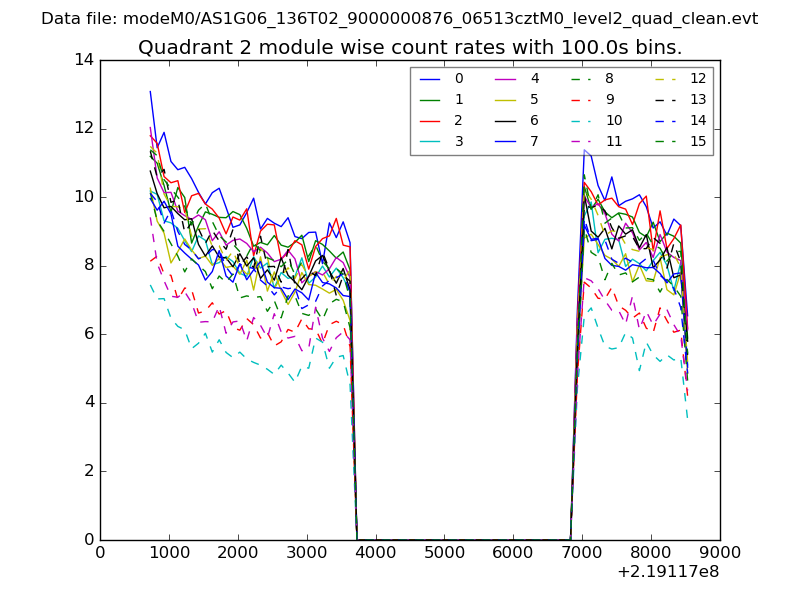
| Module-wise count rates for Quadrant B Data is divided into 100 sec bins |
 |
 |
| Module-wise count rates for Quadrant C Data is divided into 100 sec bins |
 |
 |
| Module-wise count rates for Quadrant D Data is divided into 100 sec bins |
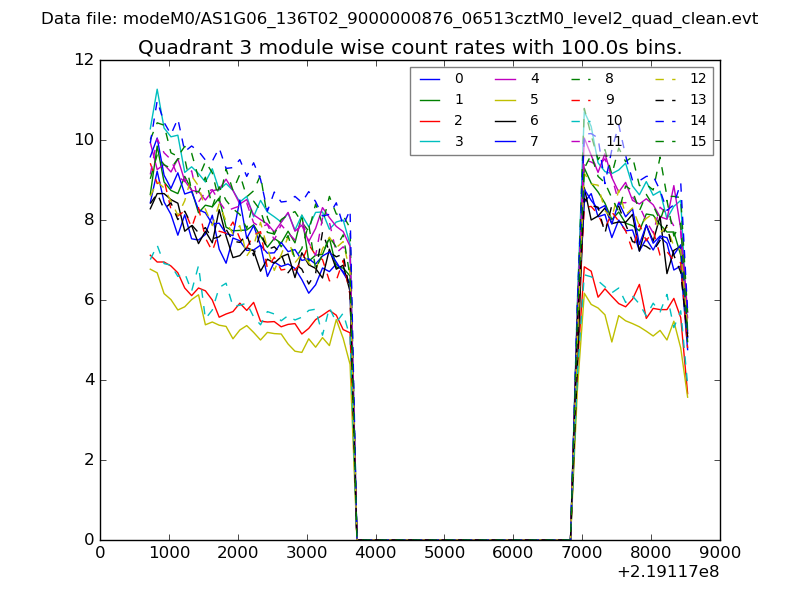 |
 |
| Parameter | Plot |
|---|---|
| CZT HV Monitor | 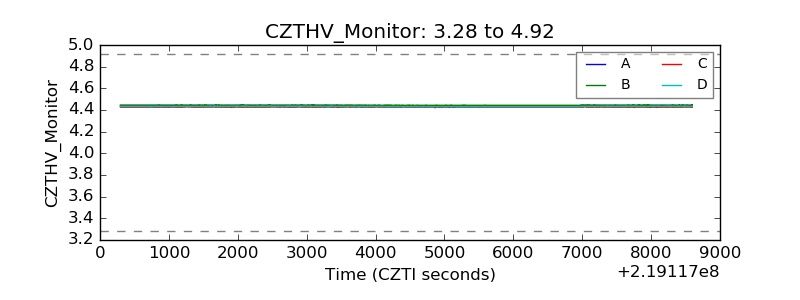 |
| D_VDD | 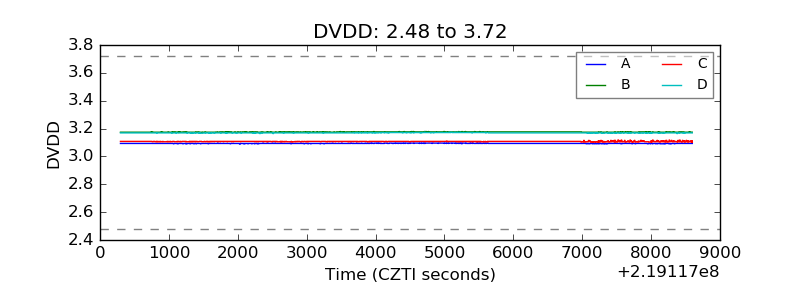 |
| Temperature 1 | 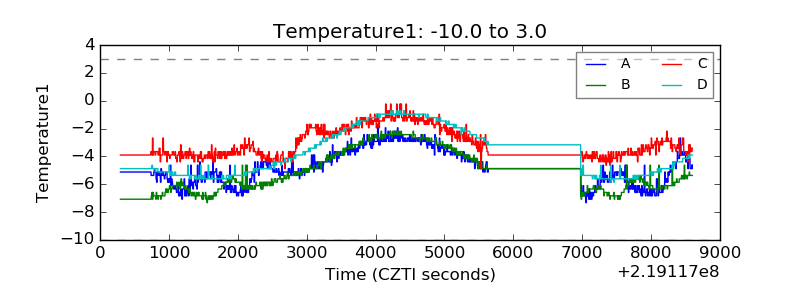 |
| Veto HV Monitor | 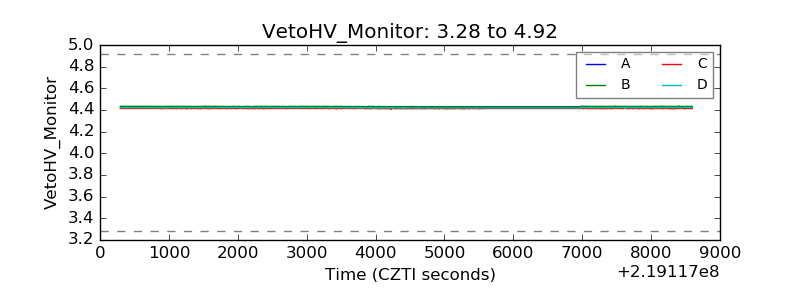 |
| Veto LLD | 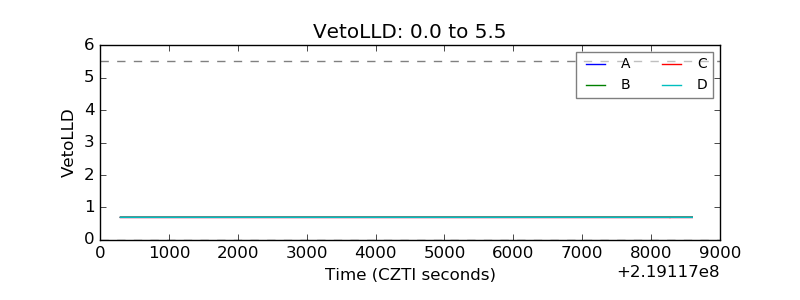 |
| Alpha Counter | 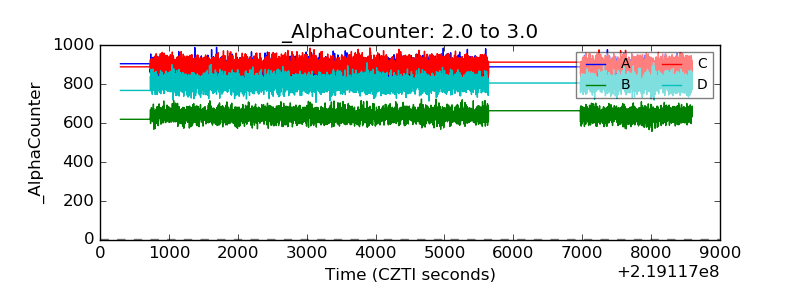 |
| _CPM_Rate | 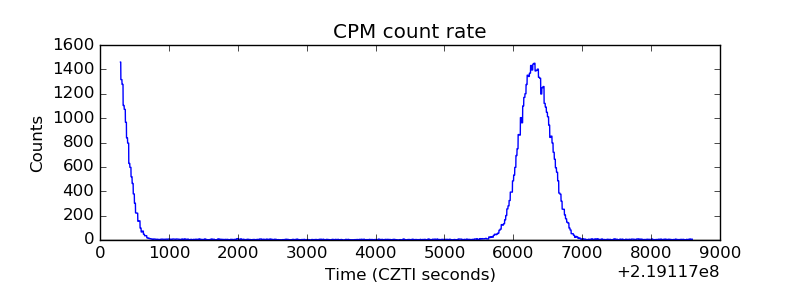 |
| CZT Counter | 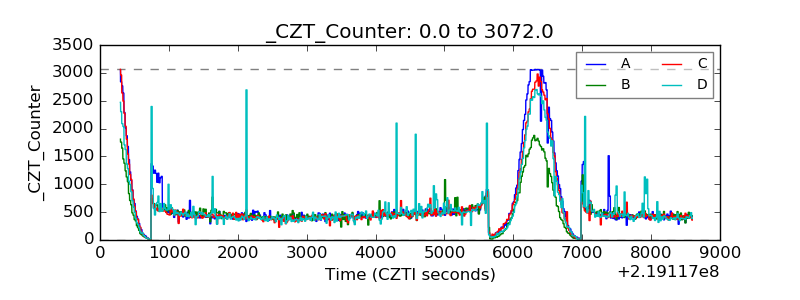 |
| +2.5 Volts monitor |  |
| +5 Volts monitor |  |
| _ROLL_ROT | 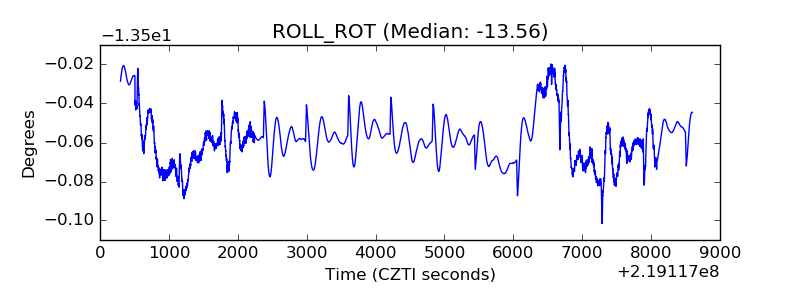 |
| _Roll_DEC | 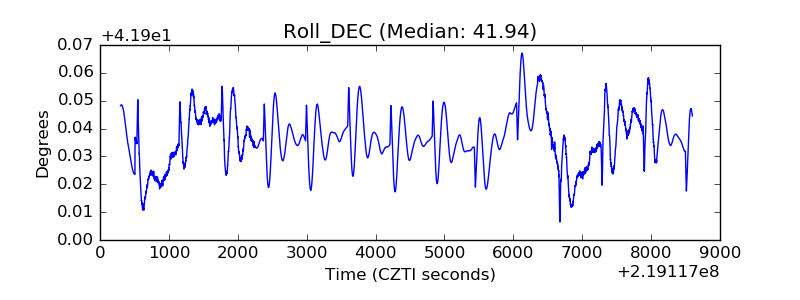 |
| _Roll_RA | 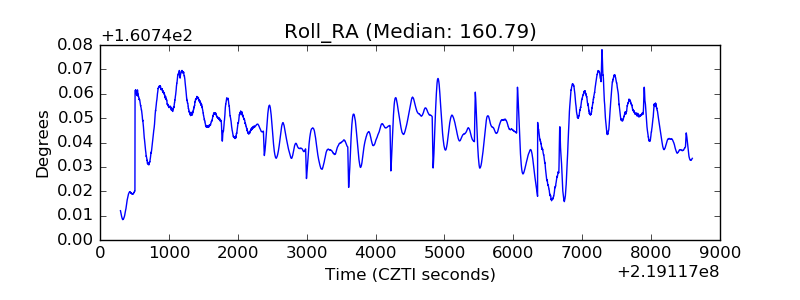 |
| Veto Counter | 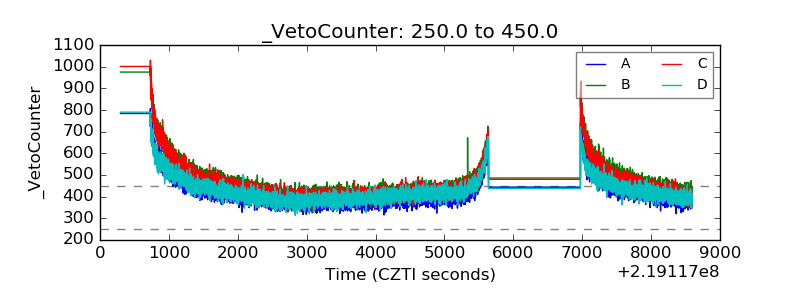 |