| Param | Original file | Final file |
|---|---|---|
| Filename | modeM0/AS1G06_136T02_9000000876_06515cztM0_level2.evt | modeM0/AS1G06_136T02_9000000876_06515cztM0_level2_quad_clean.evt |
| Size (bytes) | 422,153,280 | 75,096,000 |
| Size | 402.6 MB | 71.6 MB |
| Events in quadrant A | 2,858,260 | 467,791 |
| Events in quadrant B | 2,799,894 | 478,001 |
| Events in quadrant C | 2,636,130 | 469,978 |
| Events in quadrant D | 4,089,397 | 445,620 |
| Mode M0 | |||
|---|---|---|---|
| Quadrant | BADHDUFLAG | Total packets | Discarded packets |
| A | 0 | 12522 | 2 |
| B | 0 | 12304 | 1 |
| C | 0 | 12088 | 1 |
| D | 0 | 16315 | 1 |
| Mode M9 | |||
|---|---|---|---|
| Quadrant | BADHDUFLAG | Total packets | Discarded packets |
| A | 0 | 10 | 0 |
| B | 0 | 10 | 0 |
| C | 0 | 10 | 0 |
| D | 0 | 10 | 0 |
| Mode SS | |||
|---|---|---|---|
| Quadrant | BADHDUFLAG | Total packets | Discarded packets |
| A | 0 | 120 | 0 |
| B | 0 | 120 | 0 |
| C | 0 | 120 | 0 |
| D | 0 | 120 | 0 |
| Quadrant | Total seconds | Saturated seconds | Saturation percentage |
|---|---|---|---|
| A | 5902 | 96 | 1.626567% |
| B | 5902 | 89 | 1.507963% |
| C | 5902 | 45 | 0.762453% |
| D | 5902 | 190 | 3.219248% |
Noise dominated data is calculated using 1-second bins in cleaned event files. If a bin has >2000 counts, and if more than 50% of those come from <1% of pixels, then it is considered to be noise-dominated and hence unusable.
| Quadrant | # 1 sec bins | Bins with >0 counts | Bins with >2000 counts | High rate bins dominated by noise | Noise dominated (total time) | Noise dominated (detector-on time) | Marked lightcurve |
|---|---|---|---|---|---|---|---|
| A | 6887 | 5903 | 0 | 0 | 0.00% | 0.00% | 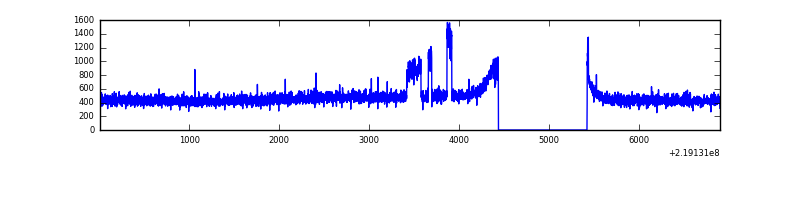 |
| B | 6887 | 5903 | 9 | 9 | 0.13% | 0.15% | 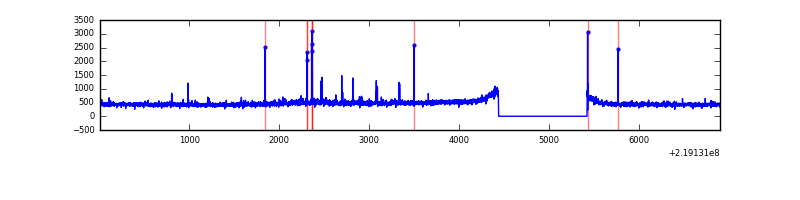 |
| C | 6887 | 5903 | 0 | 0 | 0.00% | 0.00% | 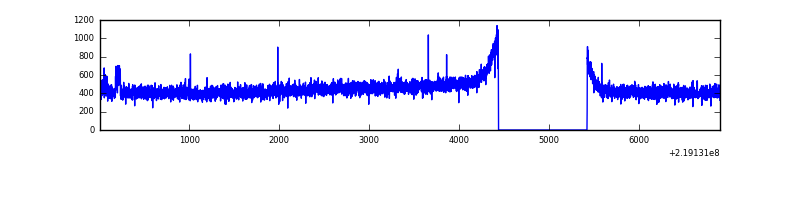 |
| D | 6887 | 5903 | 95 | 95 | 1.38% | 1.61% | 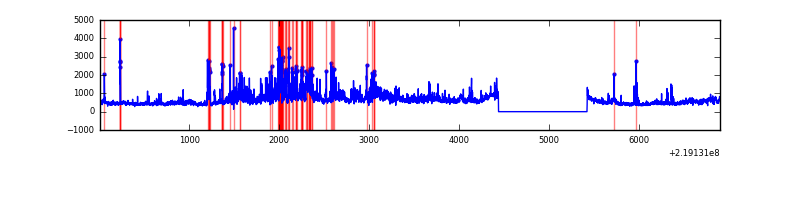 |
Top three noisy pixels from each quadrant. If the there are fewer than three noisy pixels in the level2.evt file, extra rows are filled as -1
| Pixel properties | Quadrant properties | ||||||
|---|---|---|---|---|---|---|---|
| Quadrant | DetID | PixID | Counts | Sigma | Mean | Median | Sigma |
| A | 15 | 236 | 139577 | 981.31 | 692 | 676 | 141.5 |
| A | 8 | 15 | 49577 | 345.48 | 692 | 676 | 141.5 |
| A | 0 | 226 | 6726 | 42.74 | 692 | 676 | 141.5 |
| B | 0 | 214 | 53682 | 399.14 | 692 | 674 | 132.8 |
| B | 4 | 80 | 15706 | 113.19 | 692 | 674 | 132.8 |
| B | 0 | 197 | 14987 | 107.77 | 692 | 674 | 132.8 |
| C | 4 | 254 | 16501 | 102.65 | 667 | 668 | 154.2 |
| C | 1 | 16 | 13928 | 85.97 | 667 | 668 | 154.2 |
| C | 13 | 61 | 5364 | 30.45 | 667 | 668 | 154.2 |
| D | 11 | 241 | 509031 | 3128.38 | 664 | 643 | 162.5 |
| D | 2 | 152 | 415294 | 2551.57 | 664 | 643 | 162.5 |
| D | 2 | 136 | 238385 | 1462.95 | 664 | 643 | 162.5 |
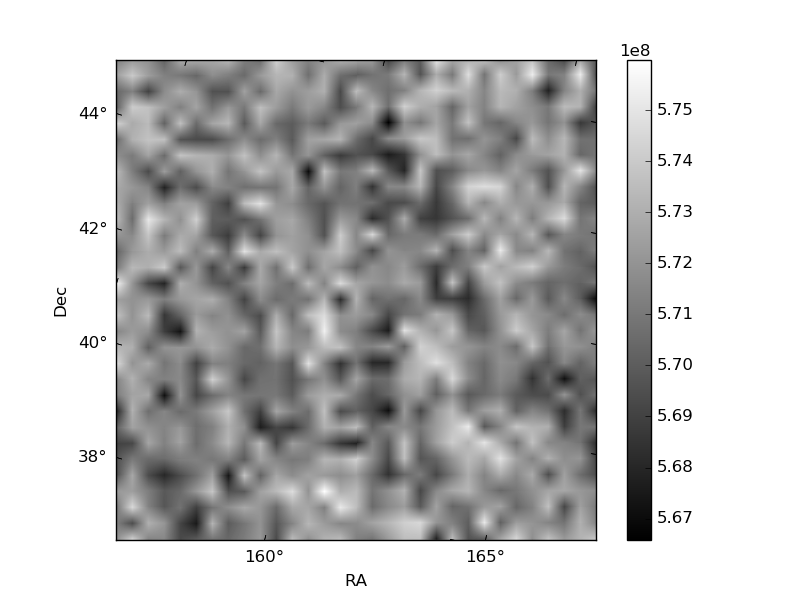
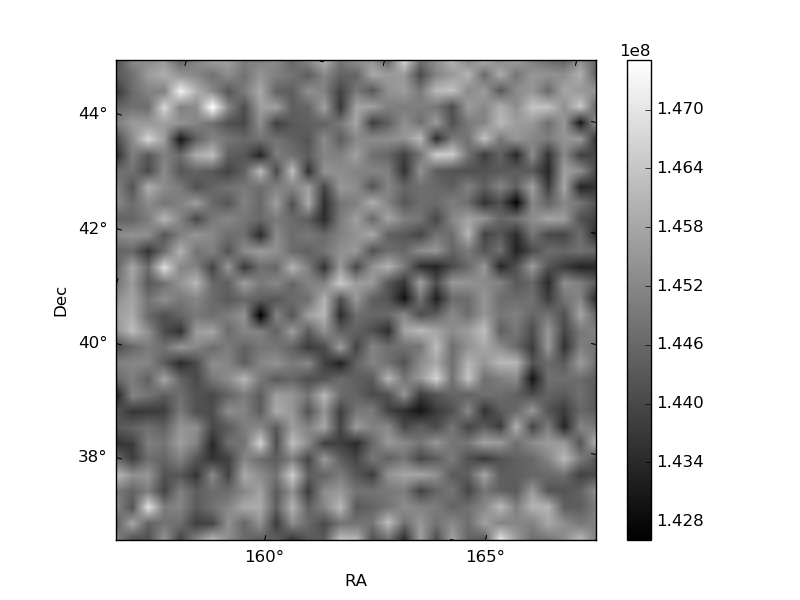
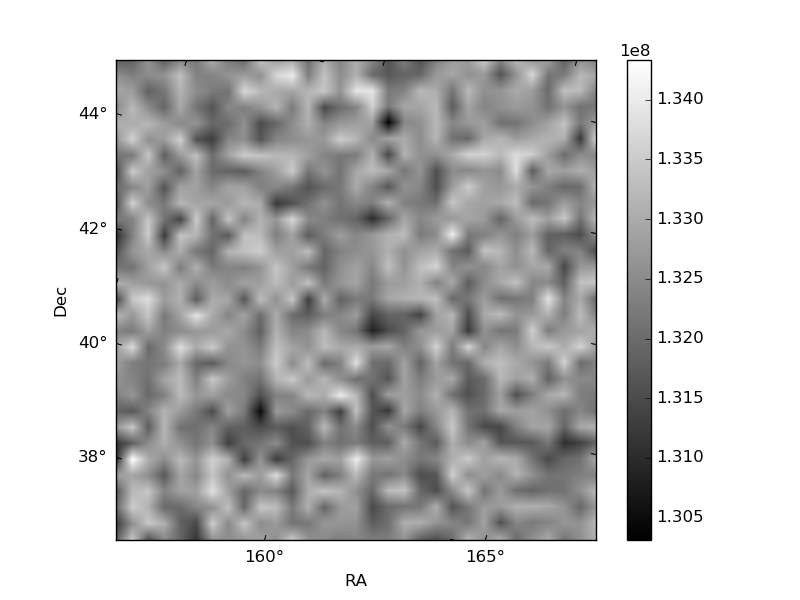
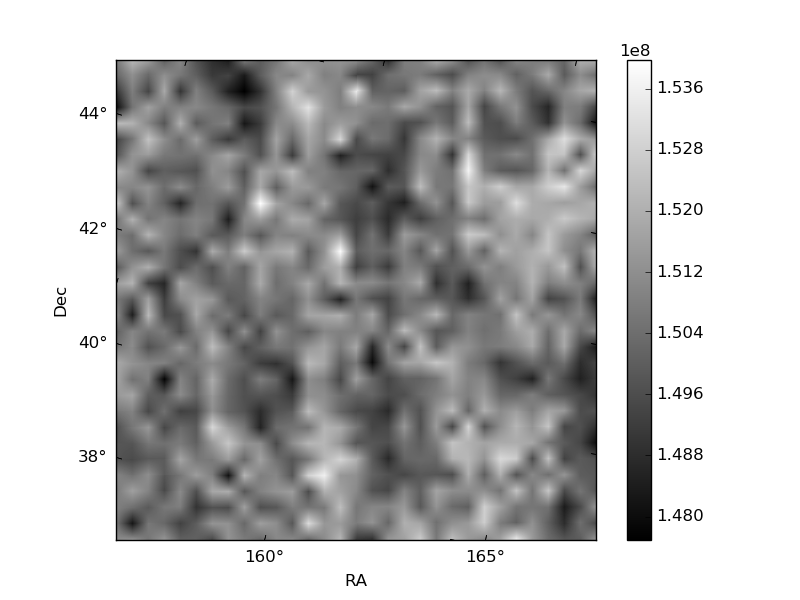
Histogram calculated using DETX and DETY for each event in the final _common_clean file
| Quadrant A | 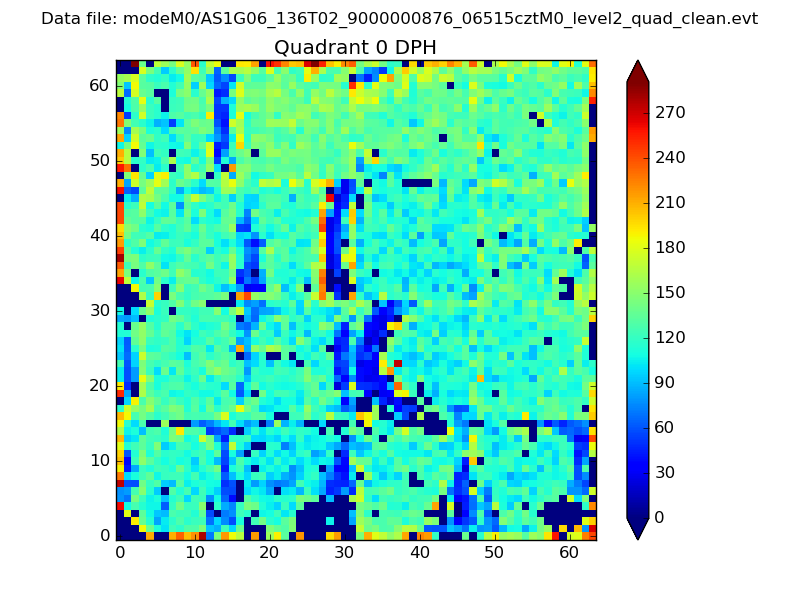 |
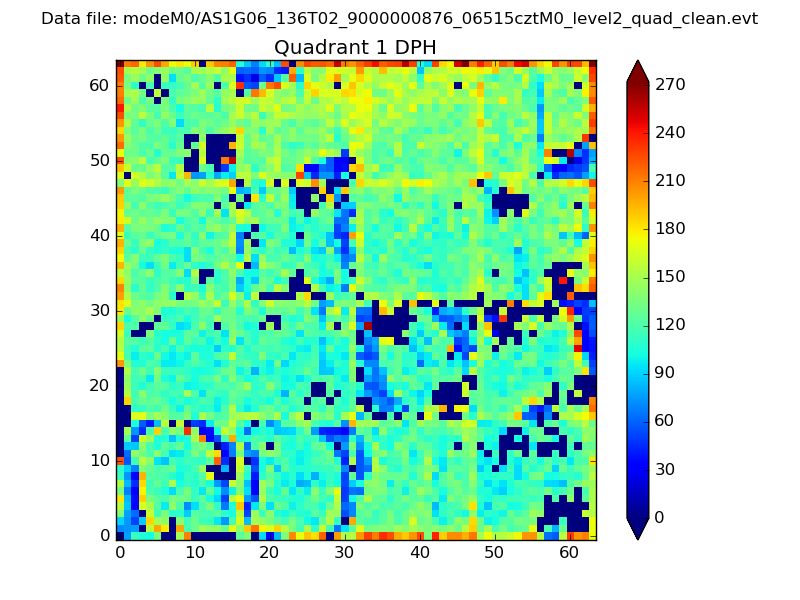 |
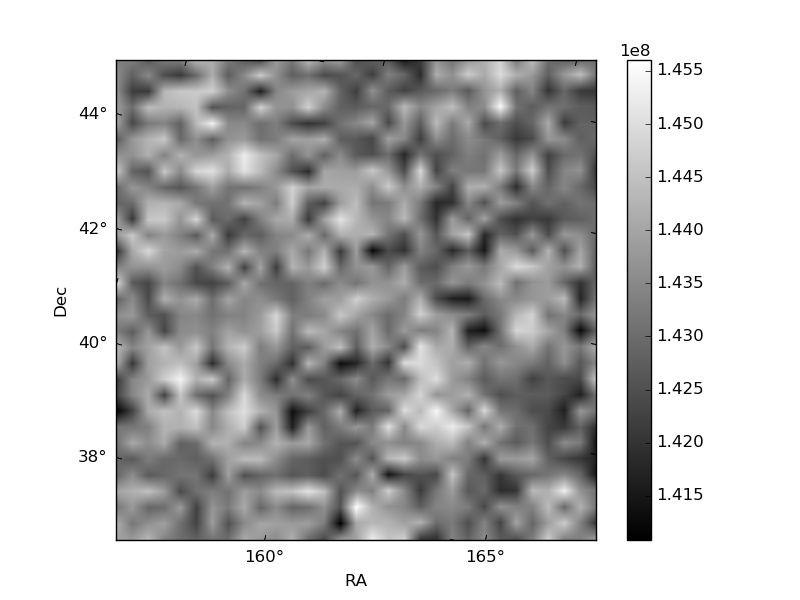
Quadrant B |
|---|---|---|---|
| Quadrant D | 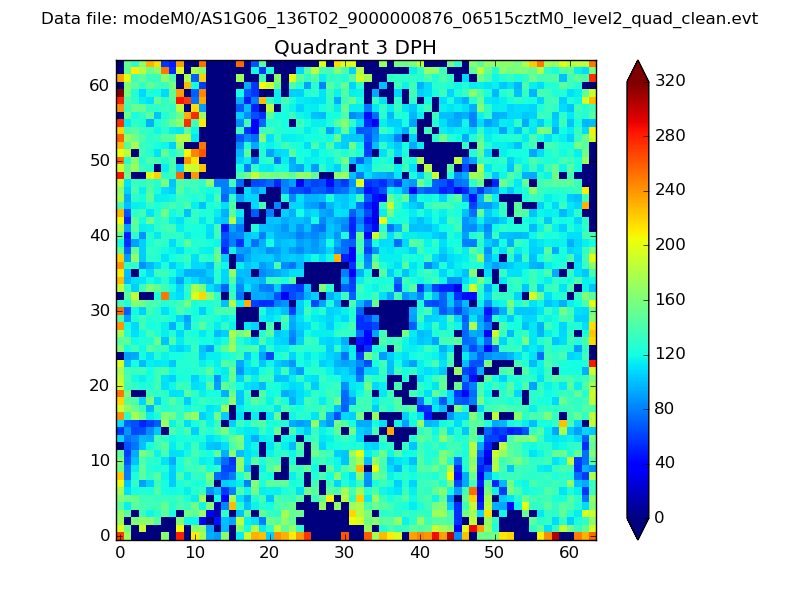 |
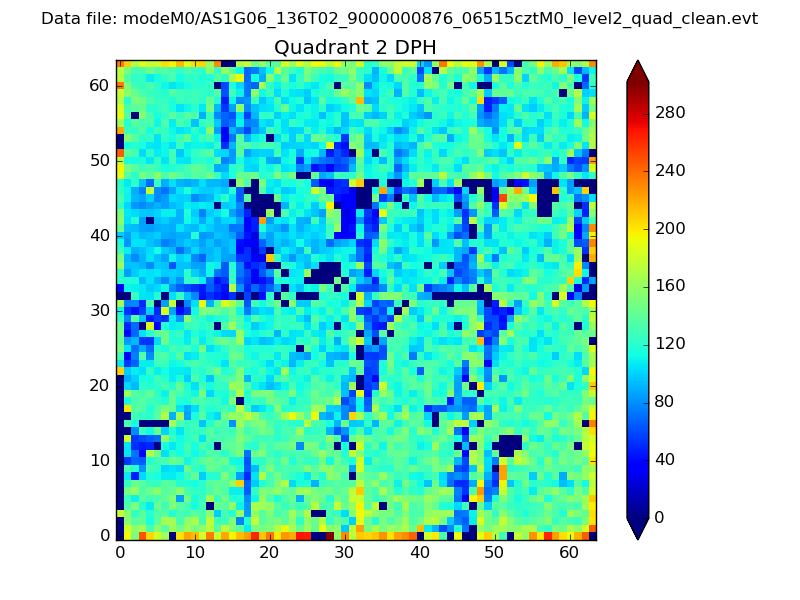 |
Quadrant C |
| Plot type | Count rate plots | Images |
|---|---|---|
| Comparison with Poisson distribution Blue bars denote a histogram of data divided into 1 sec bins. Red curve is a Poisson curve with rate = median count rate of data. |
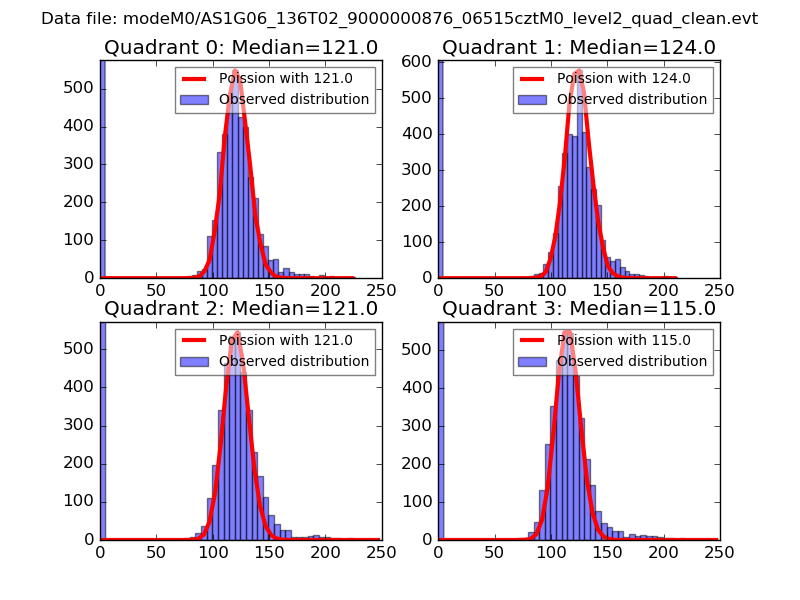 |
 |
| Quadrant-wise count rates Data is divided into 100 sec bins |
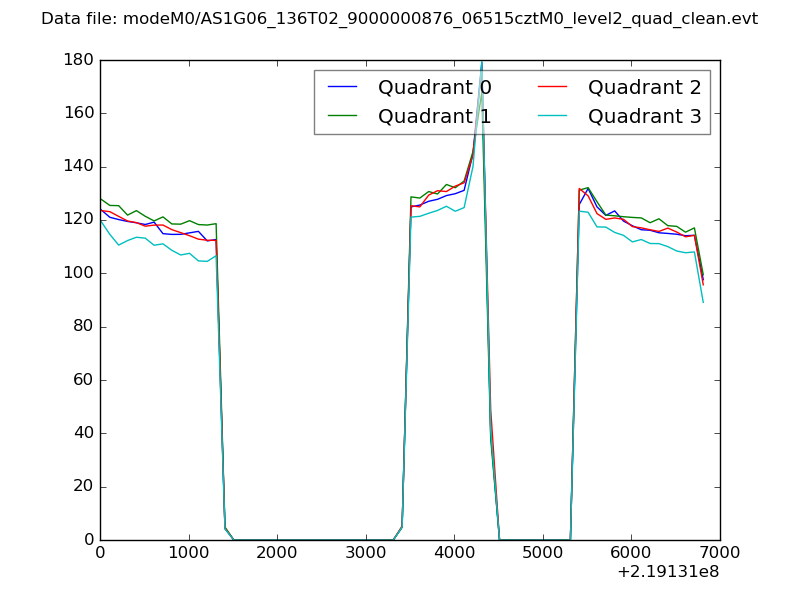 |
|
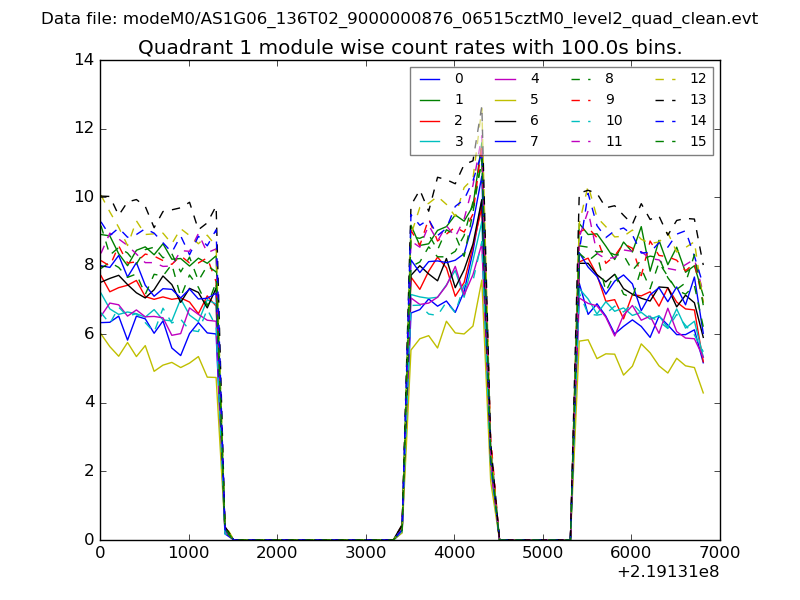
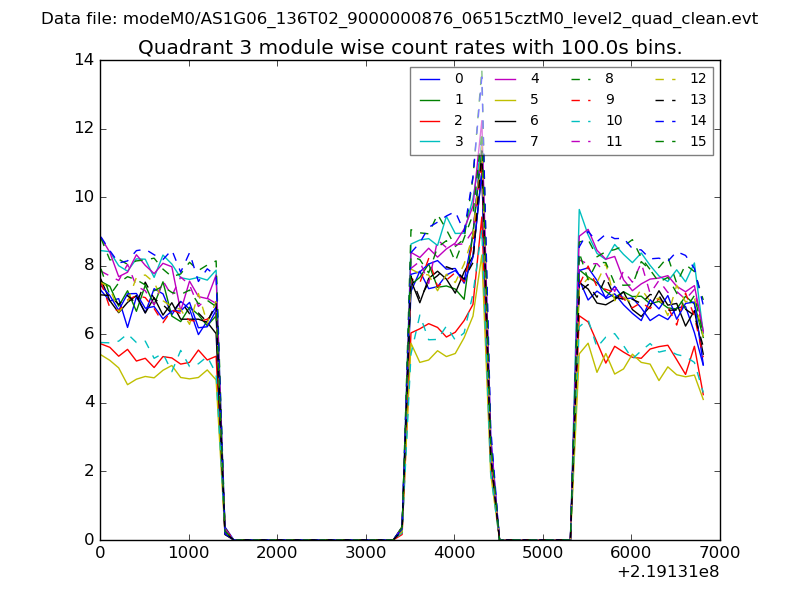
| Module-wise count rates for Quadrant A Data is divided into 100 sec bins |
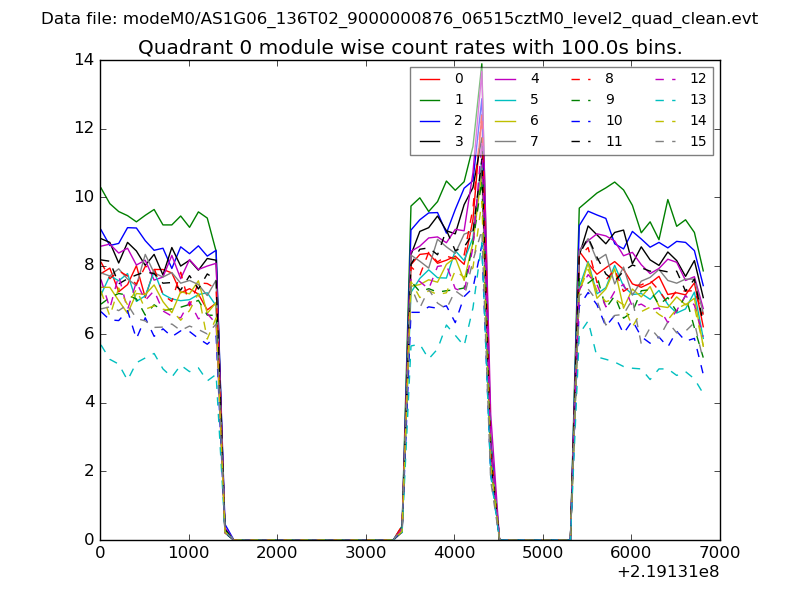 |
 |
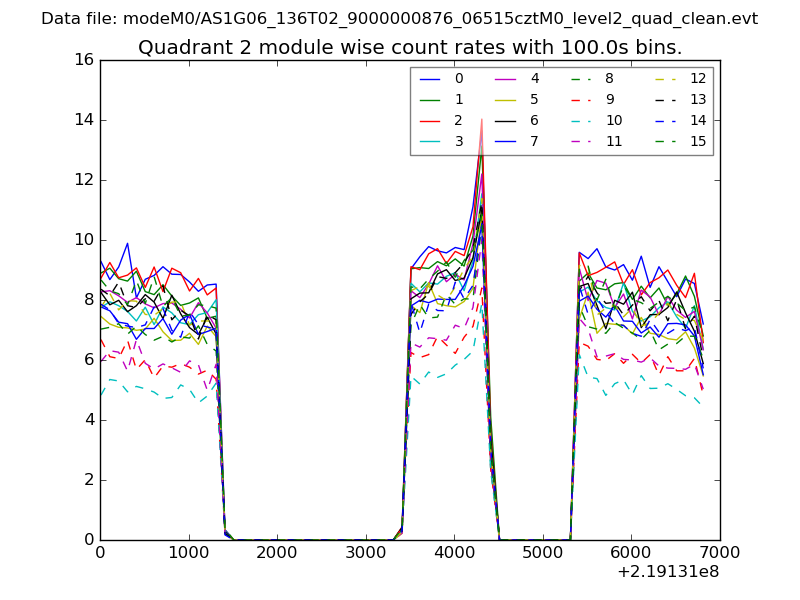
| Module-wise count rates for Quadrant B Data is divided into 100 sec bins |
 |
 |
| Module-wise count rates for Quadrant C Data is divided into 100 sec bins |
 |
 |
| Module-wise count rates for Quadrant D Data is divided into 100 sec bins |
 |
 |
| Parameter | Plot |
|---|---|
| CZT HV Monitor | 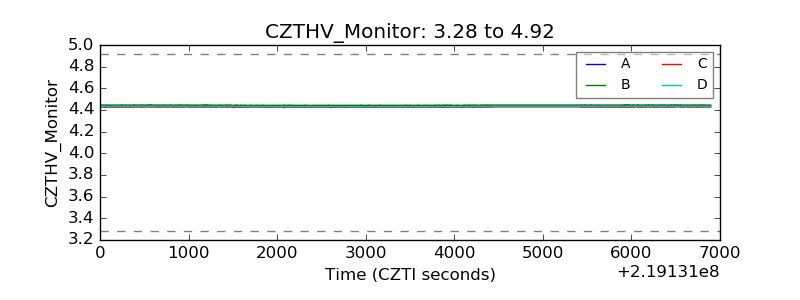 |
| D_VDD | 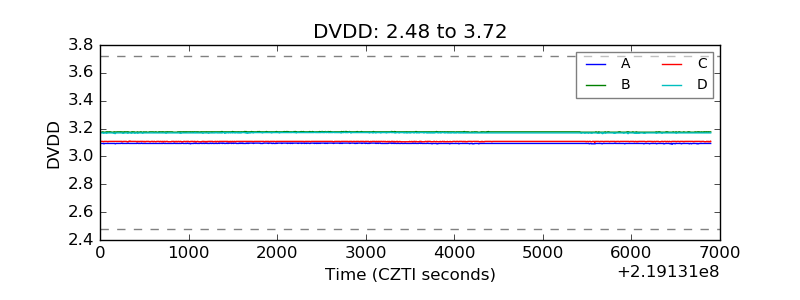 |
| Temperature 1 | 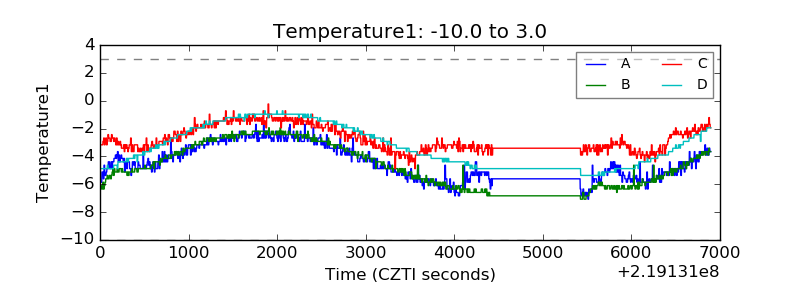 |
| Veto HV Monitor | 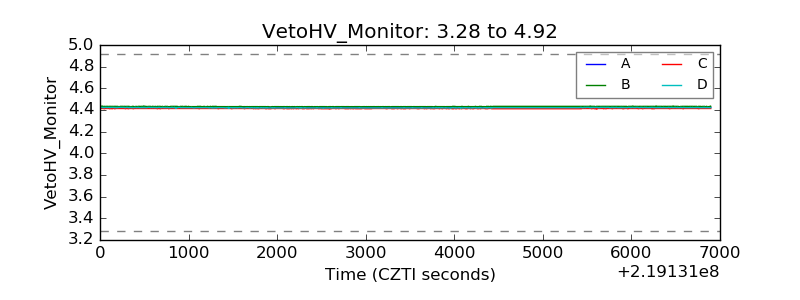 |
| Veto LLD | 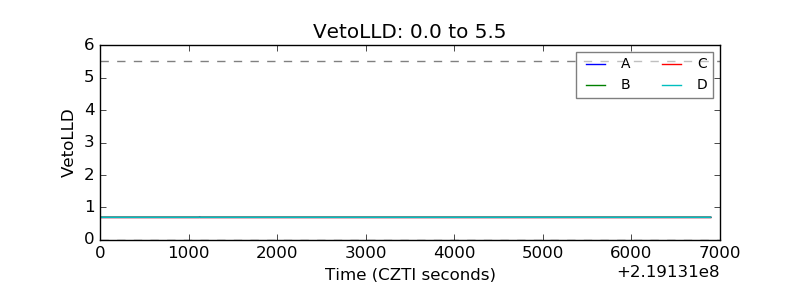 |
| Alpha Counter | 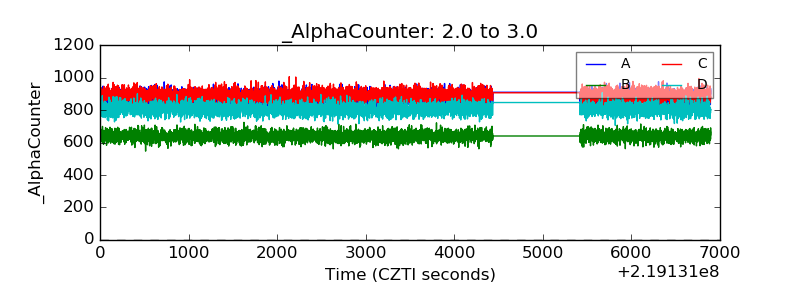 |
| _CPM_Rate | 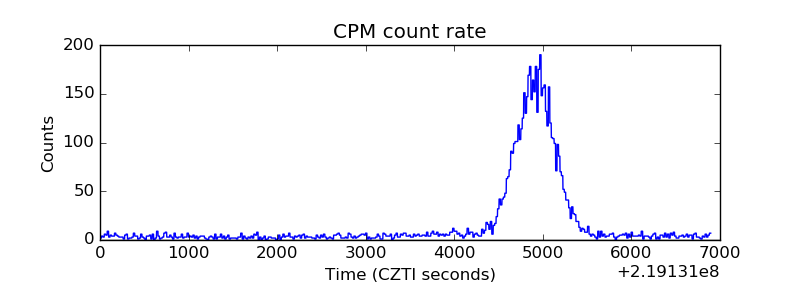 |
| CZT Counter | 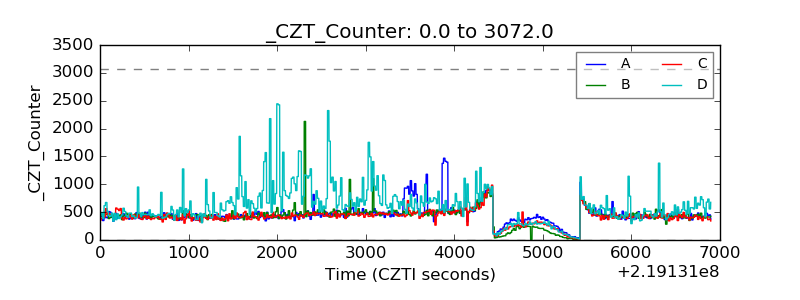 |
| +2.5 Volts monitor |  |
| +5 Volts monitor |  |
| _ROLL_ROT | 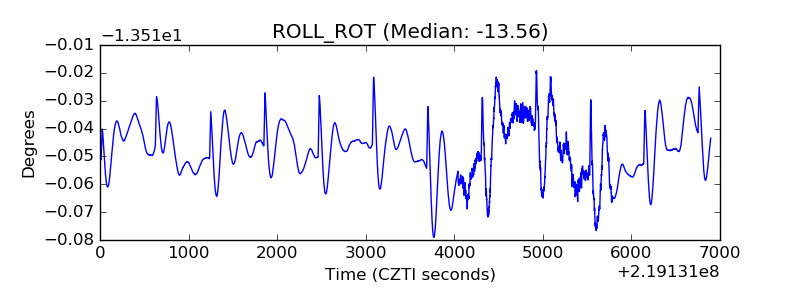 |
| _Roll_DEC | 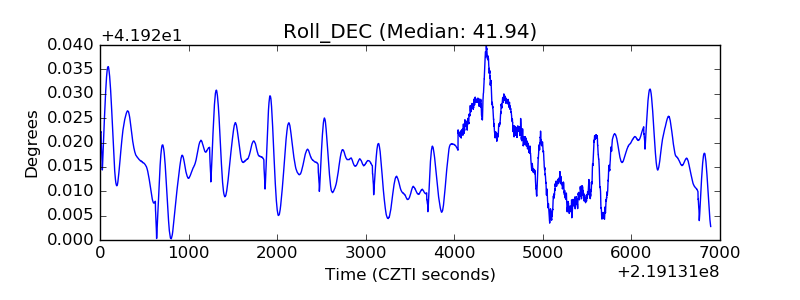 |
| _Roll_RA | 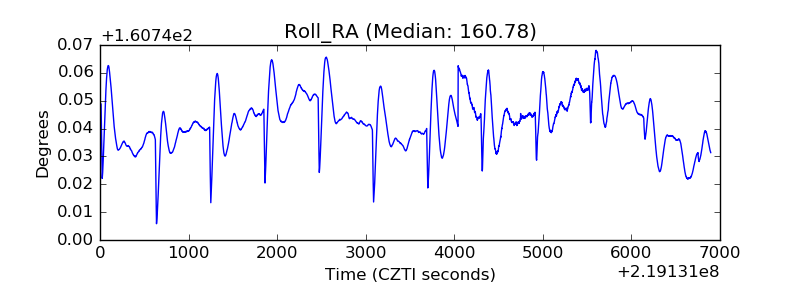 |
| Veto Counter | 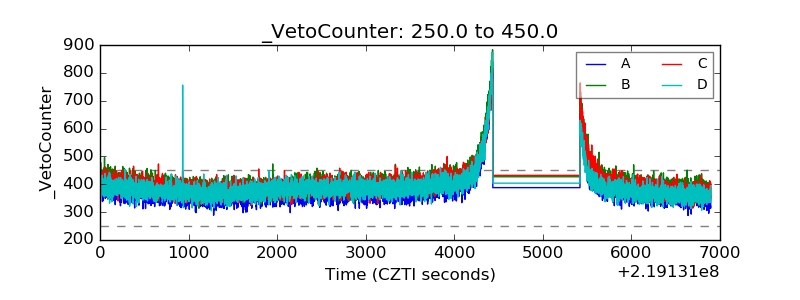 |