| Param | Original file | Final file |
|---|---|---|
| Filename | modeM0/AS1G06_136T02_9000000876_06516cztM0_level2.evt | modeM0/AS1G06_136T02_9000000876_06516cztM0_level2_quad_clean.evt |
| Size (bytes) | 441,823,680 | 88,079,040 |
| Size | 421.4 MB | 84.0 MB |
| Events in quadrant A | 3,136,400 | 550,634 |
| Events in quadrant B | 3,292,465 | 560,655 |
| Events in quadrant C | 2,968,348 | 554,037 |
| Events in quadrant D | 3,522,195 | 529,295 |
| Mode M0 | |||
|---|---|---|---|
| Quadrant | BADHDUFLAG | Total packets | Discarded packets |
| A | 0 | 14049 | 2 |
| B | 0 | 14447 | 1 |
| C | 0 | 13812 | 1 |
| D | 0 | 15096 | 1 |
| Mode M9 | |||
|---|---|---|---|
| Quadrant | BADHDUFLAG | Total packets | Discarded packets |
| A | 0 | 6 | 0 |
| B | 0 | 6 | 0 |
| C | 0 | 6 | 0 |
| D | 0 | 6 | 0 |
| Mode SS | |||
|---|---|---|---|
| Quadrant | BADHDUFLAG | Total packets | Discarded packets |
| A | 0 | 136 | 0 |
| B | 0 | 136 | 0 |
| C | 0 | 136 | 0 |
| D | 0 | 136 | 0 |
| Quadrant | Total seconds | Saturated seconds | Saturation percentage |
|---|---|---|---|
| A | 6784 | 160 | 2.358491% |
| B | 6784 | 174 | 2.564858% |
| C | 6784 | 81 | 1.193986% |
| D | 6784 | 114 | 1.680425% |
Noise dominated data is calculated using 1-second bins in cleaned event files. If a bin has >2000 counts, and if more than 50% of those come from <1% of pixels, then it is considered to be noise-dominated and hence unusable.
| Quadrant | # 1 sec bins | Bins with >0 counts | Bins with >2000 counts | High rate bins dominated by noise | Noise dominated (total time) | Noise dominated (detector-on time) | Marked lightcurve |
|---|---|---|---|---|---|---|---|
| A | 7344 | 6785 | 0 | 0 | 0.00% | 0.00% | 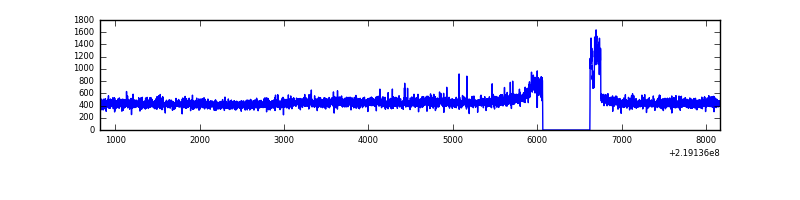 |
| B | 7344 | 6785 | 34 | 34 | 0.46% | 0.50% | 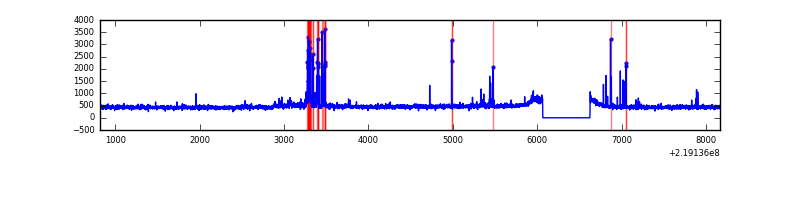 |
| C | 7344 | 6785 | 0 | 0 | 0.00% | 0.00% | 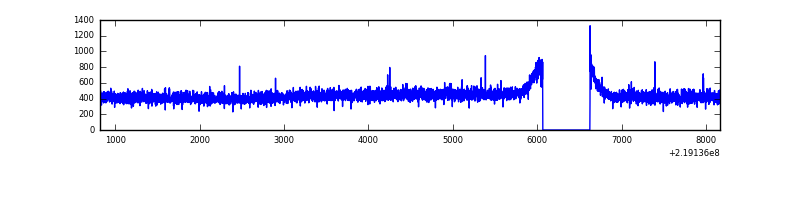 |
| D | 7344 | 6785 | 9 | 9 | 0.12% | 0.13% | 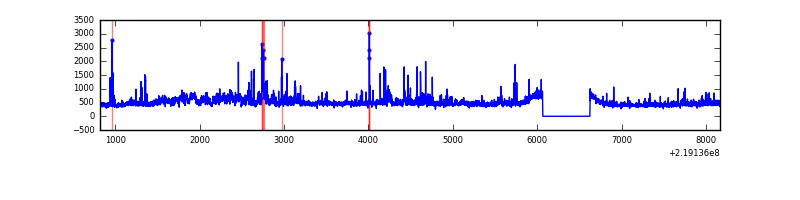 |
Top three noisy pixels from each quadrant. If the there are fewer than three noisy pixels in the level2.evt file, extra rows are filled as -1
| Pixel properties | Quadrant properties | ||||||
|---|---|---|---|---|---|---|---|
| Quadrant | DetID | PixID | Counts | Sigma | Mean | Median | Sigma |
| A | 15 | 236 | 72325 | 449.39 | 780 | 761 | 159.2 |
| A | 8 | 15 | 58261 | 361.08 | 780 | 761 | 159.2 |
| A | 0 | 226 | 7542 | 42.58 | 780 | 761 | 159.2 |
| B | 0 | 228 | 142331 | 933.69 | 782 | 761 | 151.6 |
| B | 4 | 172 | 25689 | 164.41 | 782 | 761 | 151.6 |
| B | 0 | 214 | 23168 | 147.78 | 782 | 761 | 151.6 |
| C | 4 | 254 | 14365 | 77.59 | 754 | 757 | 175.4 |
| C | 13 | 61 | 5915 | 29.41 | 754 | 757 | 175.4 |
| C | 12 | 4 | 4361 | 20.55 | 754 | 757 | 175.4 |
| D | 11 | 241 | 247389 | 1322.24 | 758 | 734 | 186.5 |
| D | 2 | 136 | 124019 | 660.89 | 758 | 734 | 186.5 |
| D | 2 | 152 | 96570 | 513.75 | 758 | 734 | 186.5 |
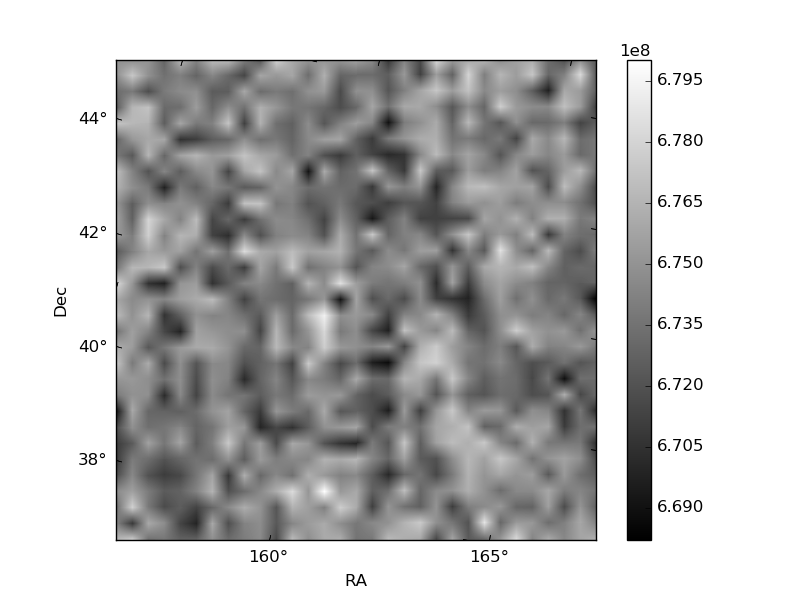
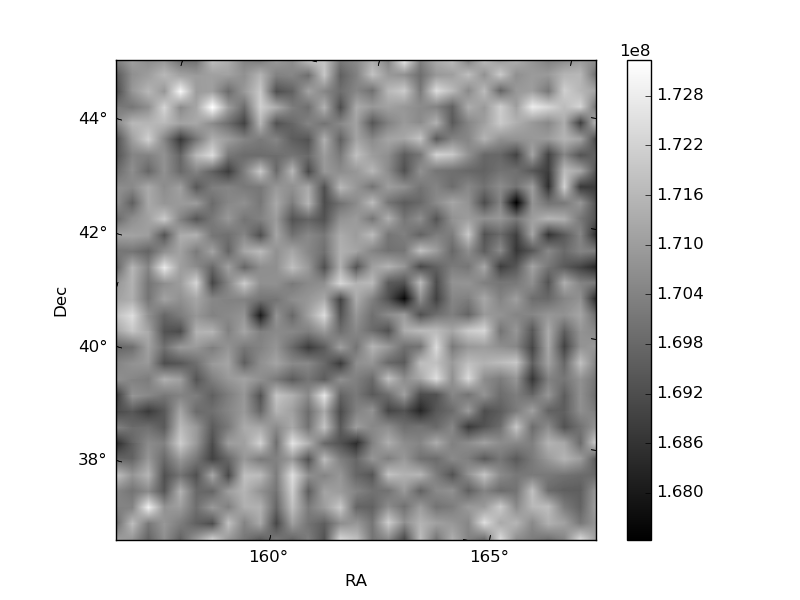
Histogram calculated using DETX and DETY for each event in the final _common_clean file
| Quadrant A | 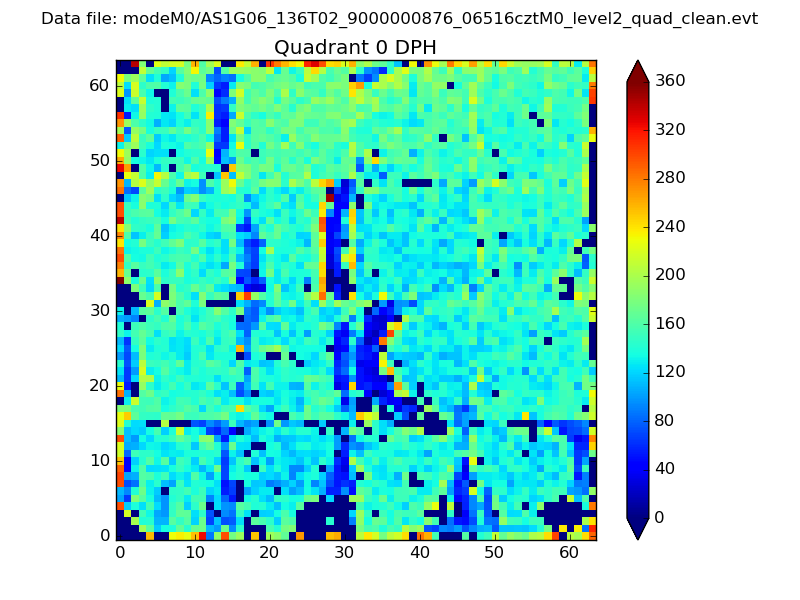 |
 |
Quadrant B |
|---|---|---|---|
| Quadrant D | 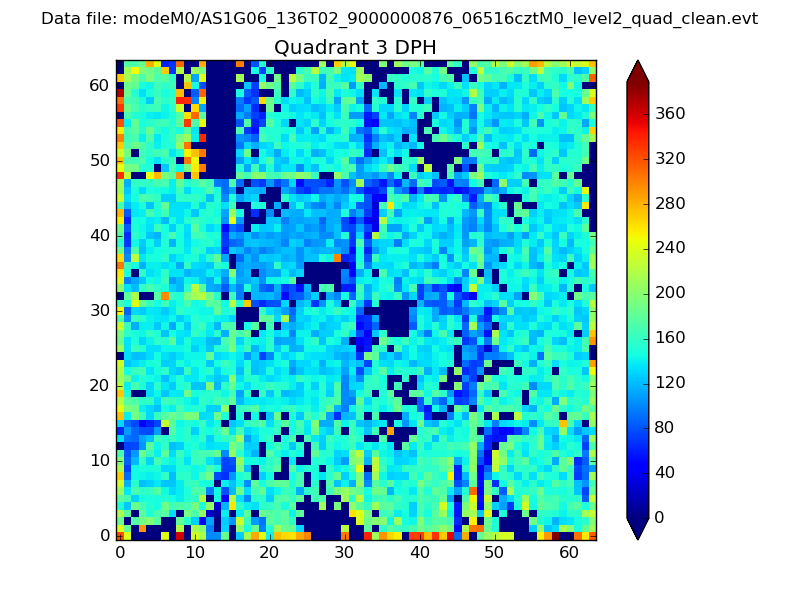 |
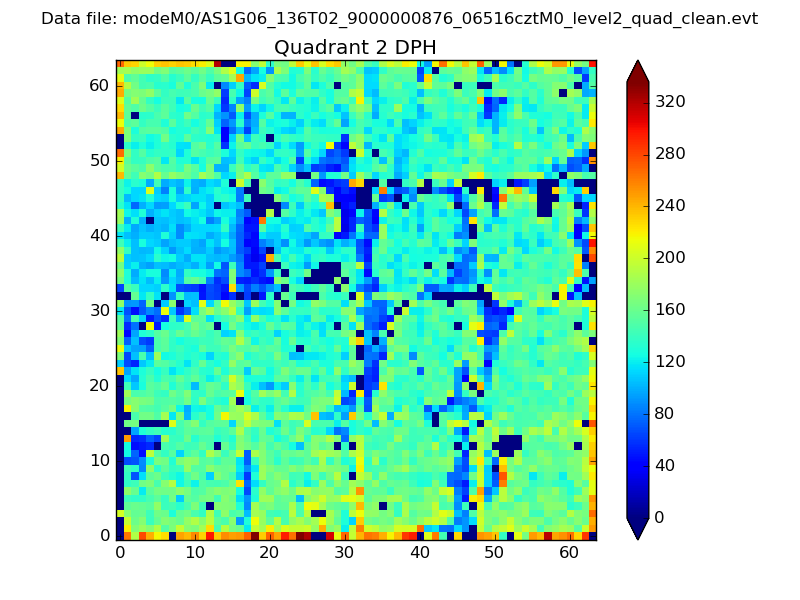 |
Quadrant C |
| Plot type | Count rate plots | Images |
|---|---|---|
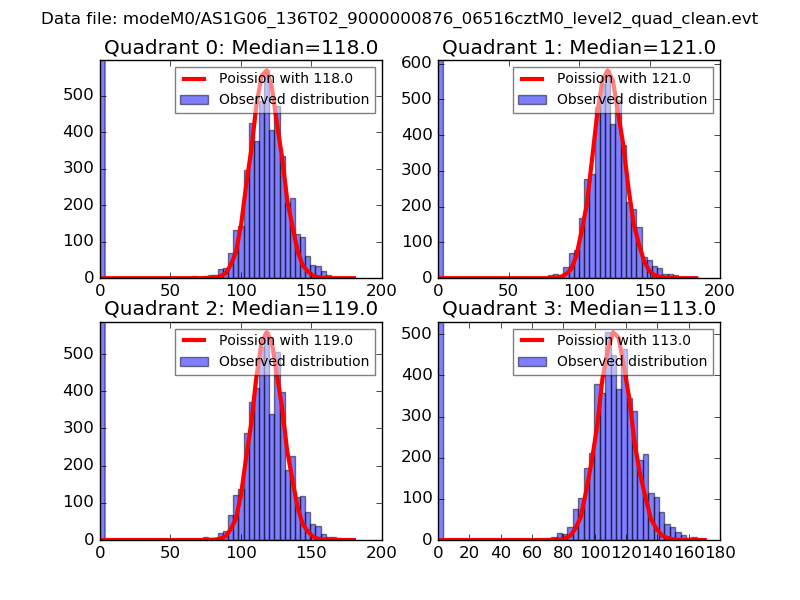
| Comparison with Poisson distribution Blue bars denote a histogram of data divided into 1 sec bins. Red curve is a Poisson curve with rate = median count rate of data. |
 |
 |
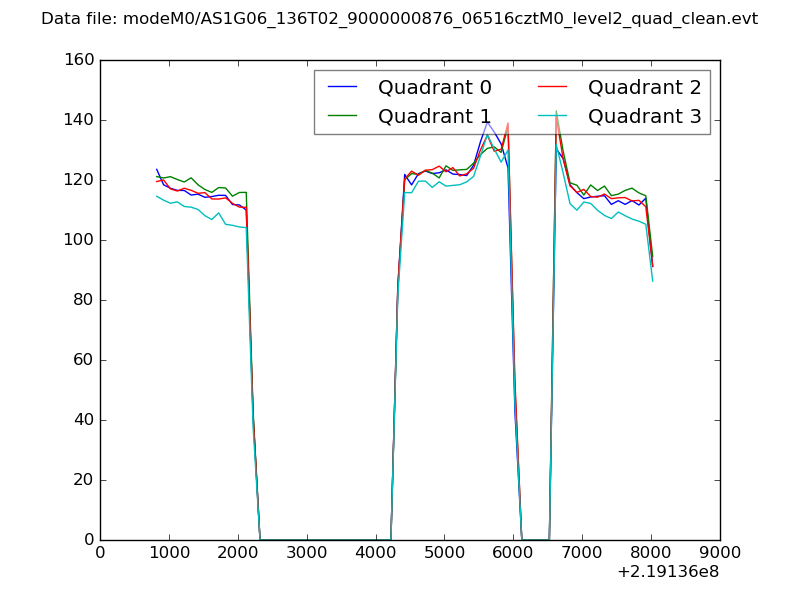
| Quadrant-wise count rates Data is divided into 100 sec bins |
 |
|
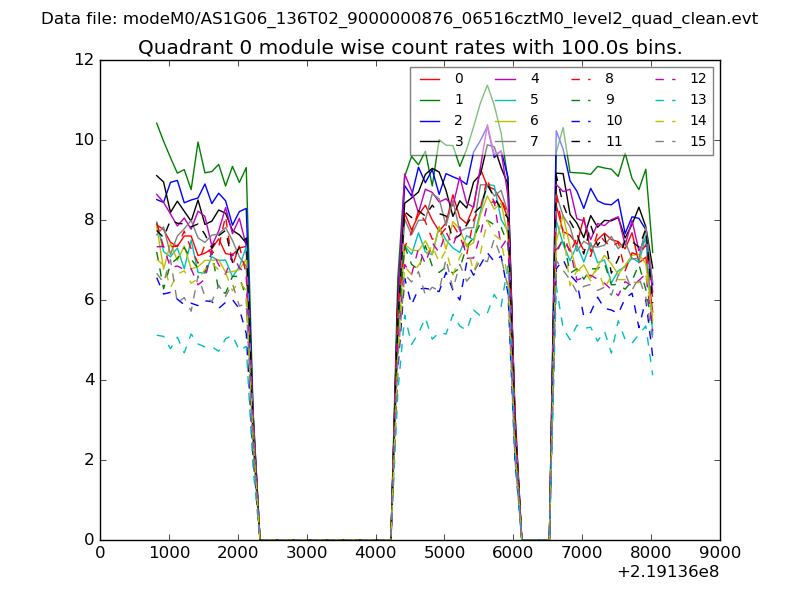
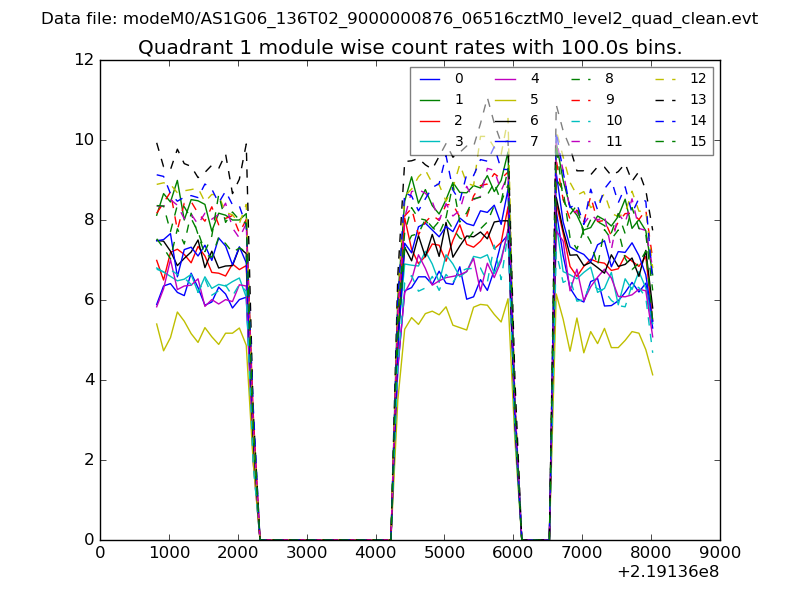
| Module-wise count rates for Quadrant A Data is divided into 100 sec bins |
 |
 |
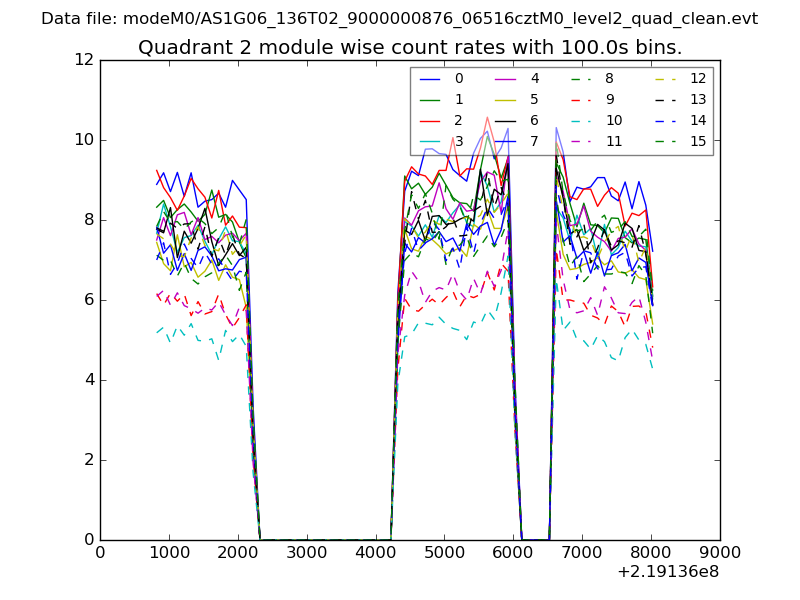
| Module-wise count rates for Quadrant B Data is divided into 100 sec bins |
 |
 |
| Module-wise count rates for Quadrant C Data is divided into 100 sec bins |
 |
 |
| Module-wise count rates for Quadrant D Data is divided into 100 sec bins |
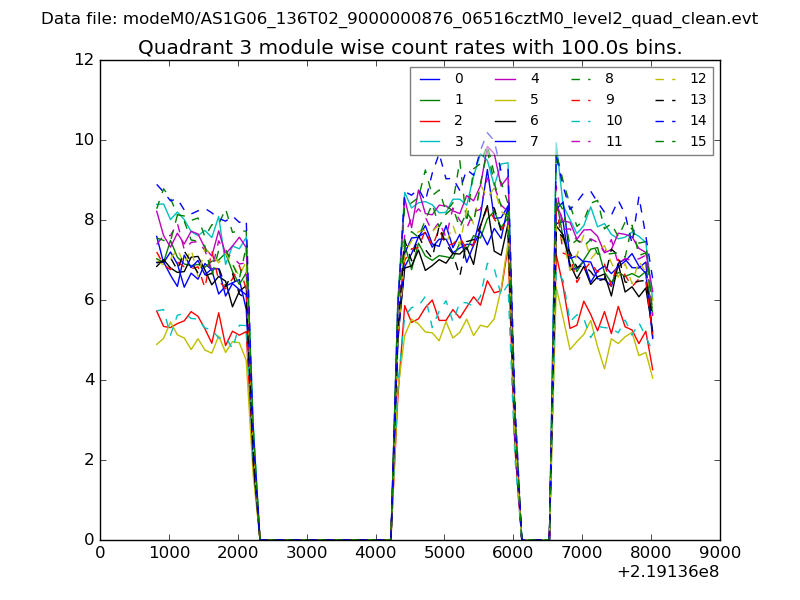 |
 |
| Parameter | Plot |
|---|---|
| CZT HV Monitor | 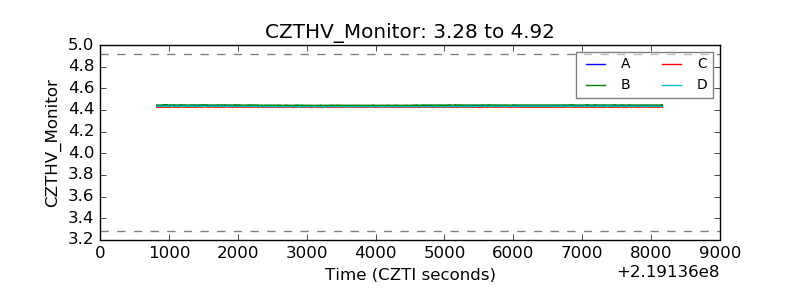 |
| D_VDD | 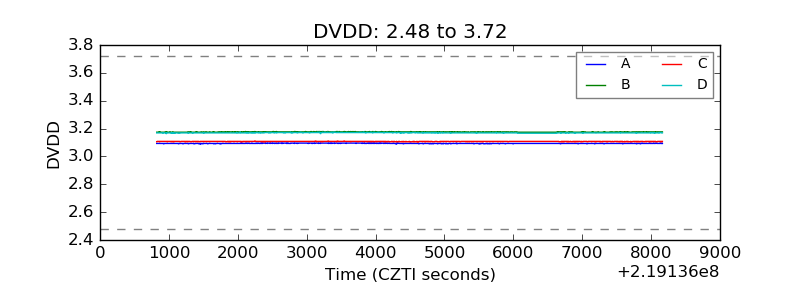 |
| Temperature 1 | 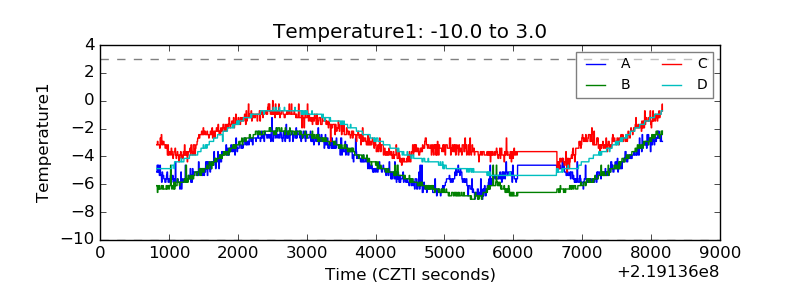 |
| Veto HV Monitor | 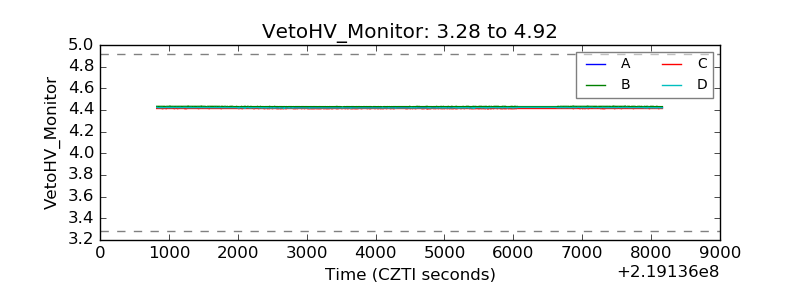 |
| Veto LLD | 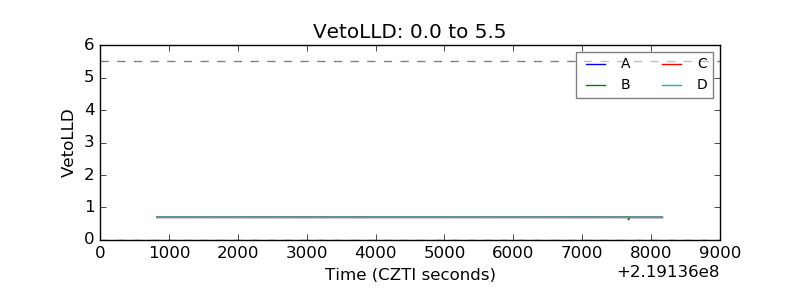 |
| Alpha Counter |  |
| _CPM_Rate | 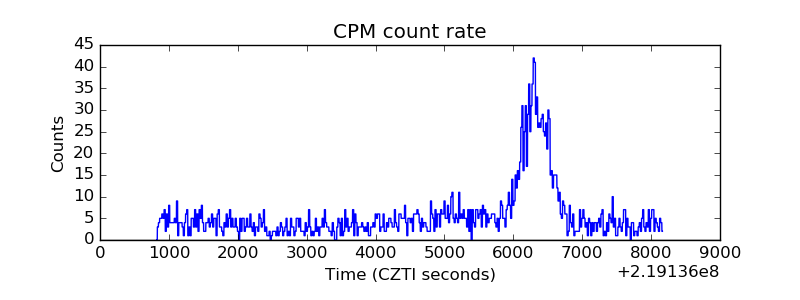 |
| CZT Counter | 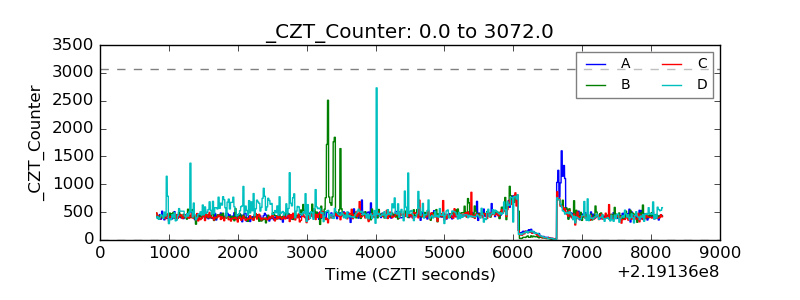 |
| +2.5 Volts monitor | 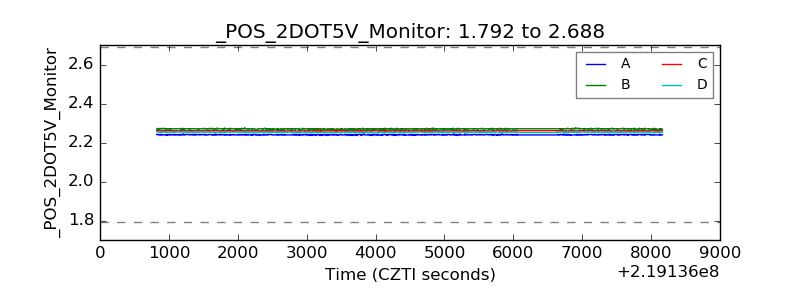 |
| +5 Volts monitor |  |
| _ROLL_ROT | 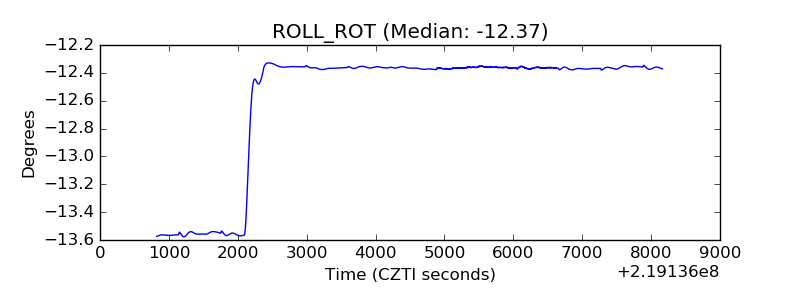 |
| _Roll_DEC | 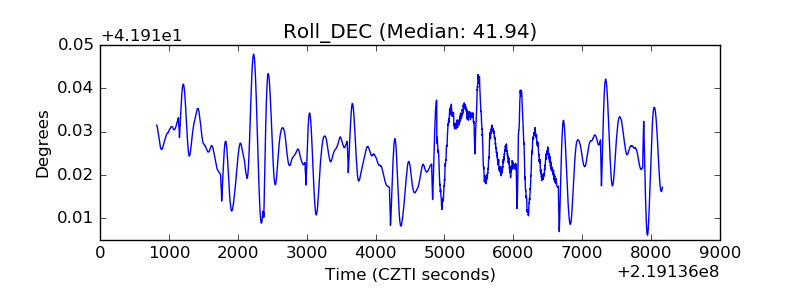 |
| _Roll_RA | 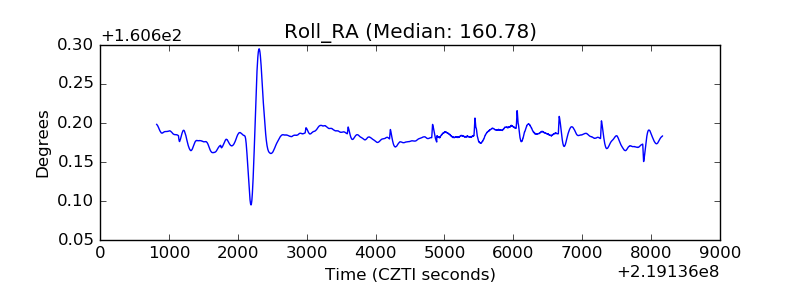 |
| Veto Counter | 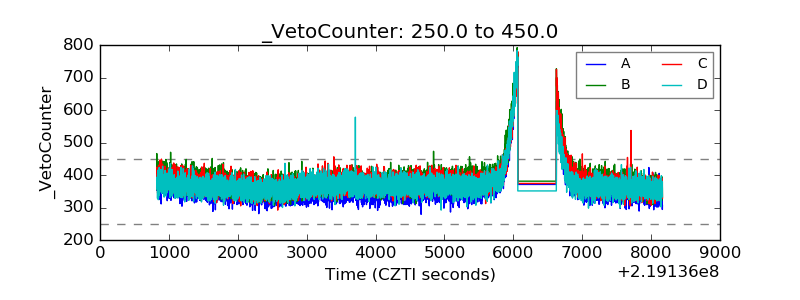 |