| Param | Original file | Final file |
|---|---|---|
| Filename | modeM0/AS1G06_136T02_9000000876_06517cztM0_level2.evt | modeM0/AS1G06_136T02_9000000876_06517cztM0_level2_quad_clean.evt |
| Size (bytes) | 518,915,520 | 95,644,800 |
| Size | 494.9 MB | 91.2 MB |
| Events in quadrant A | 3,517,099 | 598,812 |
| Events in quadrant B | 3,952,536 | 602,063 |
| Events in quadrant C | 3,384,978 | 594,704 |
| Events in quadrant D | 4,343,732 | 571,130 |
| Mode M0 | |||
|---|---|---|---|
| Quadrant | BADHDUFLAG | Total packets | Discarded packets |
| A | 0 | 15655 | 2 |
| B | 0 | 17030 | 1 |
| C | 0 | 15725 | 1 |
| D | 0 | 18183 | 1 |
| Mode M9 | |||
|---|---|---|---|
| Quadrant | BADHDUFLAG | Total packets | Discarded packets |
| A | 0 | 1 | 0 |
| B | 0 | 1 | 0 |
| C | 0 | 1 | 0 |
| D | 0 | 1 | 0 |
| Mode SS | |||
|---|---|---|---|
| Quadrant | BADHDUFLAG | Total packets | Discarded packets |
| A | 0 | 154 | 0 |
| B | 0 | 154 | 0 |
| C | 0 | 154 | 0 |
| D | 0 | 154 | 0 |
| Quadrant | Total seconds | Saturated seconds | Saturation percentage |
|---|---|---|---|
| A | 7610 | 162 | 2.128778% |
| B | 7610 | 202 | 2.654402% |
| C | 7610 | 154 | 2.023653% |
| D | 7610 | 218 | 2.864652% |
Noise dominated data is calculated using 1-second bins in cleaned event files. If a bin has >2000 counts, and if more than 50% of those come from <1% of pixels, then it is considered to be noise-dominated and hence unusable.
| Quadrant | # 1 sec bins | Bins with >0 counts | Bins with >2000 counts | High rate bins dominated by noise | Noise dominated (total time) | Noise dominated (detector-on time) | Marked lightcurve |
|---|---|---|---|---|---|---|---|
| A | 7705 | 7612 | 1 | 1 | 0.01% | 0.01% | 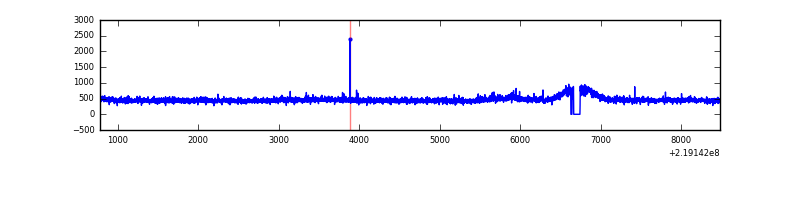 |
| B | 7705 | 7612 | 28 | 28 | 0.36% | 0.37% | 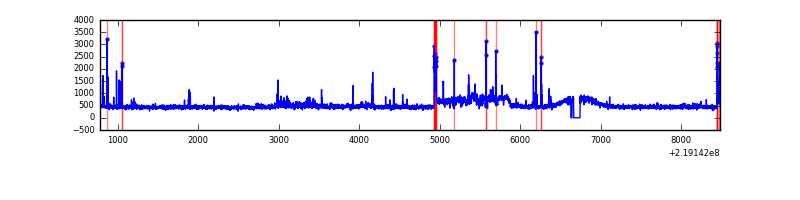 |
| C | 7705 | 7612 | 1 | 1 | 0.01% | 0.01% | 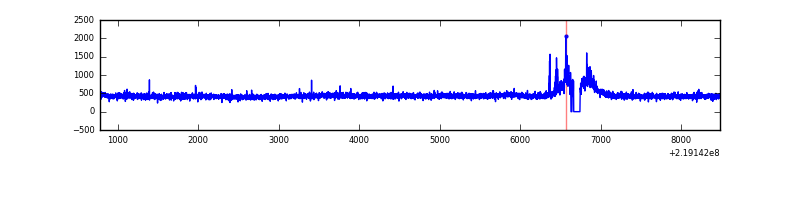 |
| D | 7705 | 7612 | 47 | 47 | 0.61% | 0.62% | 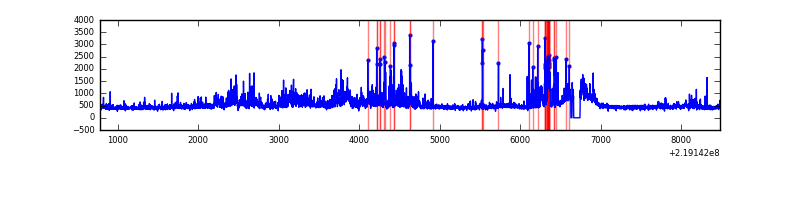 |
Top three noisy pixels from each quadrant. If the there are fewer than three noisy pixels in the level2.evt file, extra rows are filled as -1
| Pixel properties | Quadrant properties | ||||||
|---|---|---|---|---|---|---|---|
| Quadrant | DetID | PixID | Counts | Sigma | Mean | Median | Sigma |
| A | 8 | 15 | 94755 | 519.59 | 885 | 864 | 180.7 |
| A | 0 | 226 | 8453 | 42.0 | 885 | 864 | 180.7 |
| A | 12 | 194 | 8112 | 40.11 | 885 | 864 | 180.7 |
| B | 5 | 143 | 342898 | 2007.33 | 885 | 862 | 170.4 |
| B | 4 | 172 | 47194 | 271.91 | 885 | 862 | 170.4 |
| B | 0 | 214 | 43164 | 248.26 | 885 | 862 | 170.4 |
| C | 9 | 237 | 54232 | 269.82 | 849 | 853 | 197.8 |
| C | 4 | 254 | 8927 | 40.81 | 849 | 853 | 197.8 |
| C | 13 | 61 | 6859 | 30.36 | 849 | 853 | 197.8 |
| D | 2 | 152 | 276672 | 1320.11 | 853 | 825 | 209.0 |
| D | 14 | 34 | 200971 | 957.83 | 853 | 825 | 209.0 |
| D | 2 | 136 | 188935 | 900.23 | 853 | 825 | 209.0 |
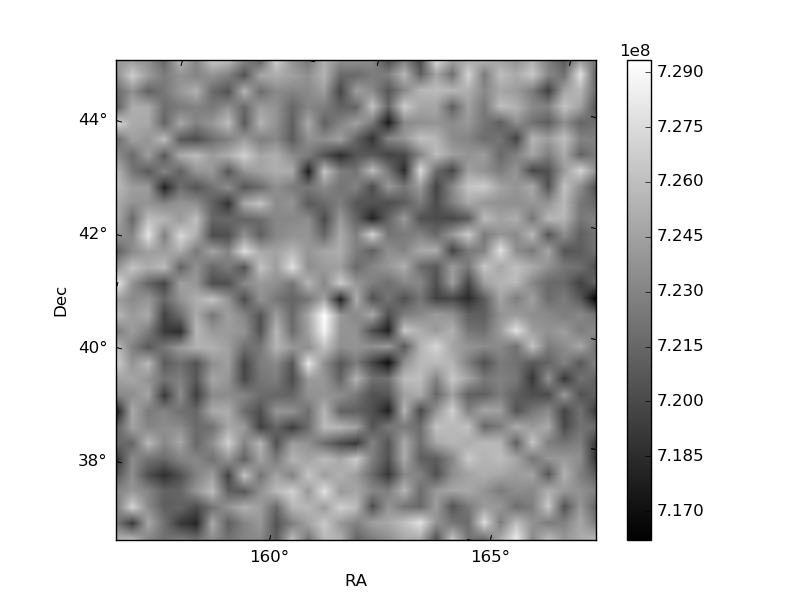
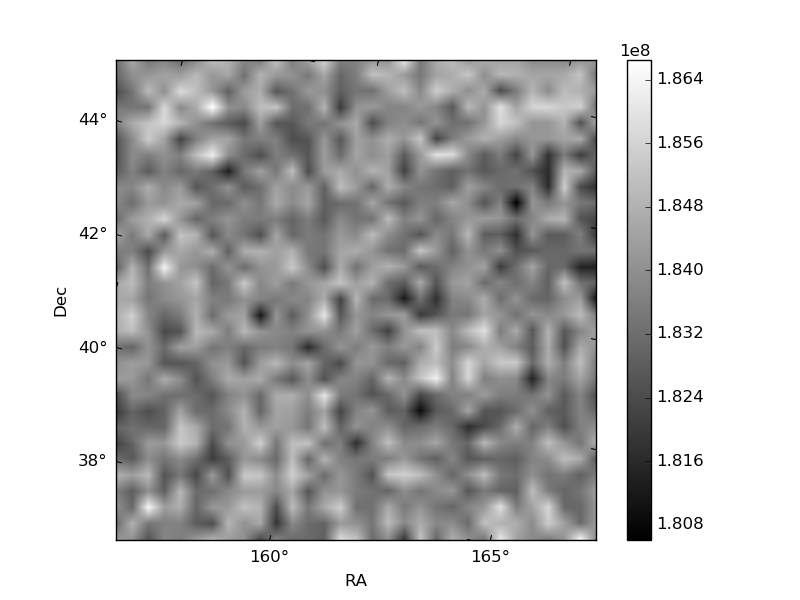
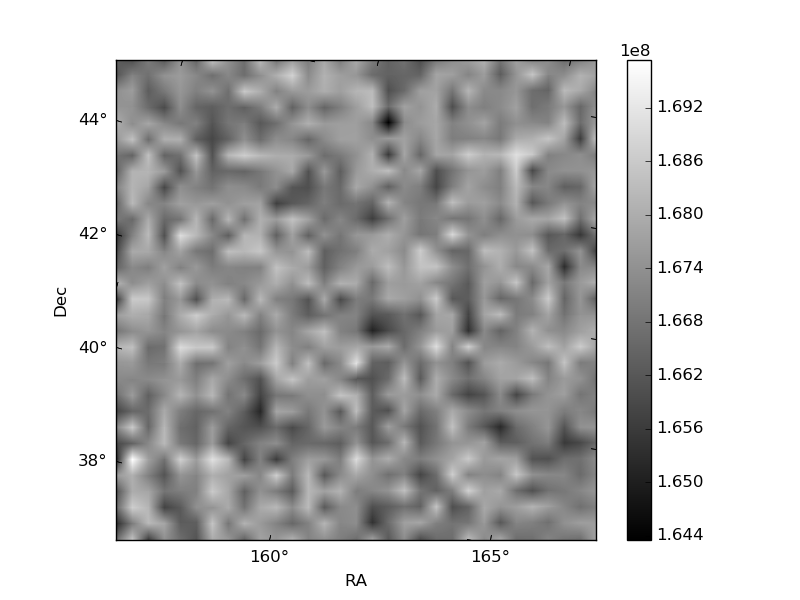
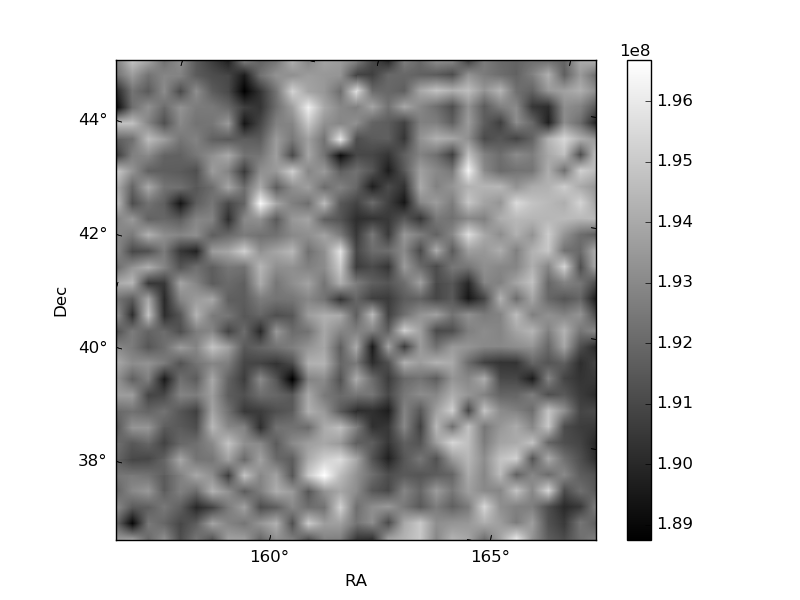
Histogram calculated using DETX and DETY for each event in the final _common_clean file
| Quadrant A | 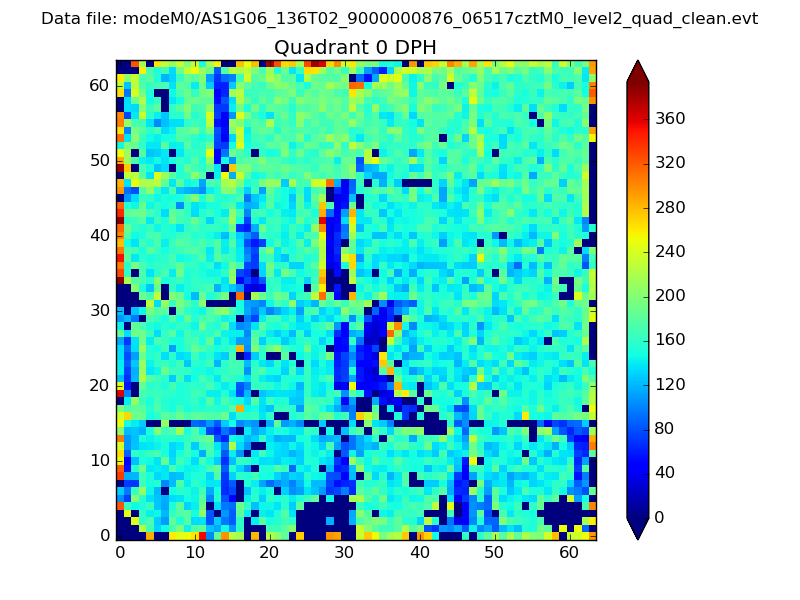 |
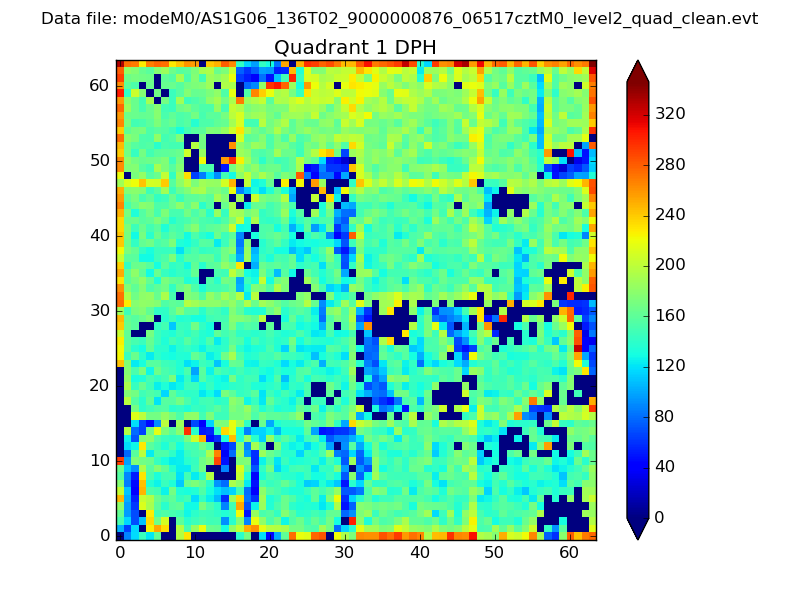 |
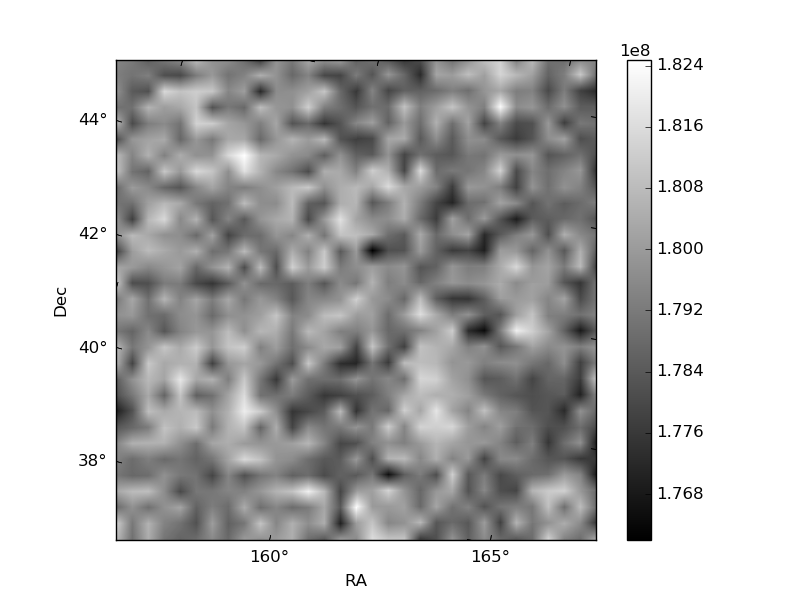
Quadrant B |
|---|---|---|---|
| Quadrant D | 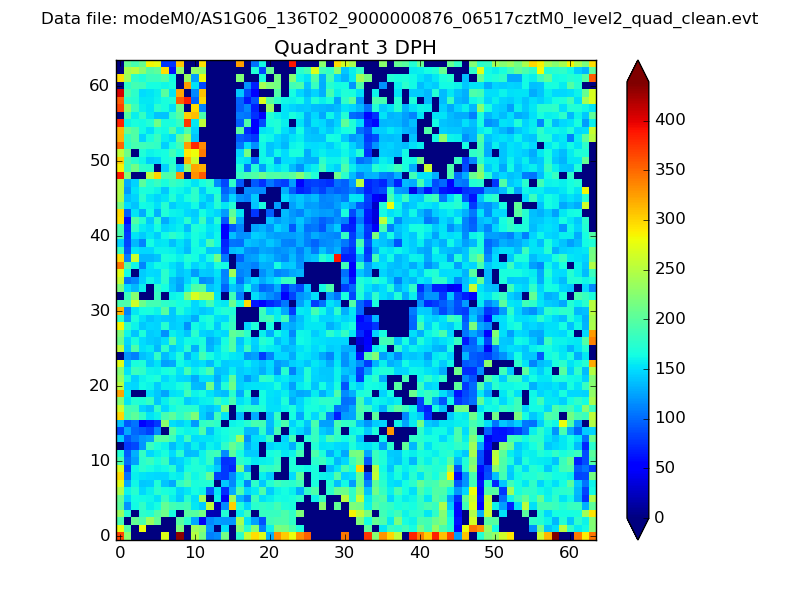 |
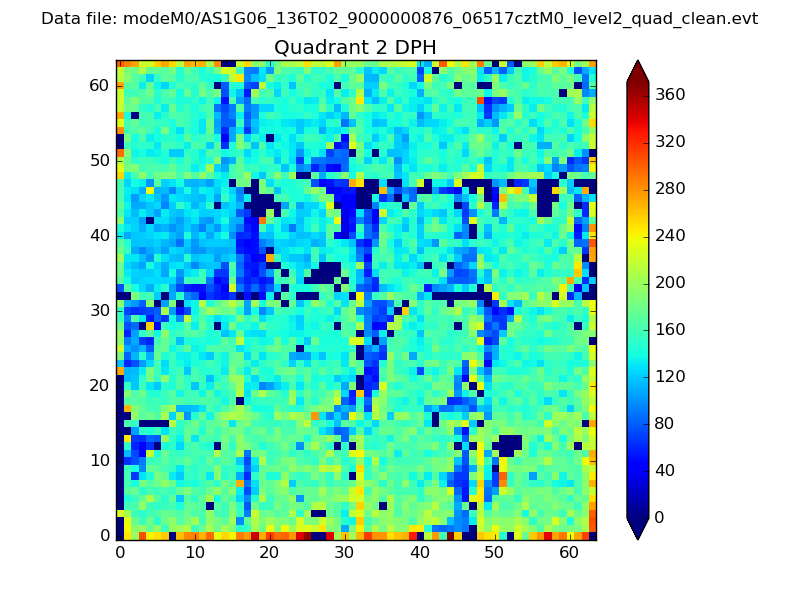 |
Quadrant C |
| Plot type | Count rate plots | Images |
|---|---|---|
| Comparison with Poisson distribution Blue bars denote a histogram of data divided into 1 sec bins. Red curve is a Poisson curve with rate = median count rate of data. |
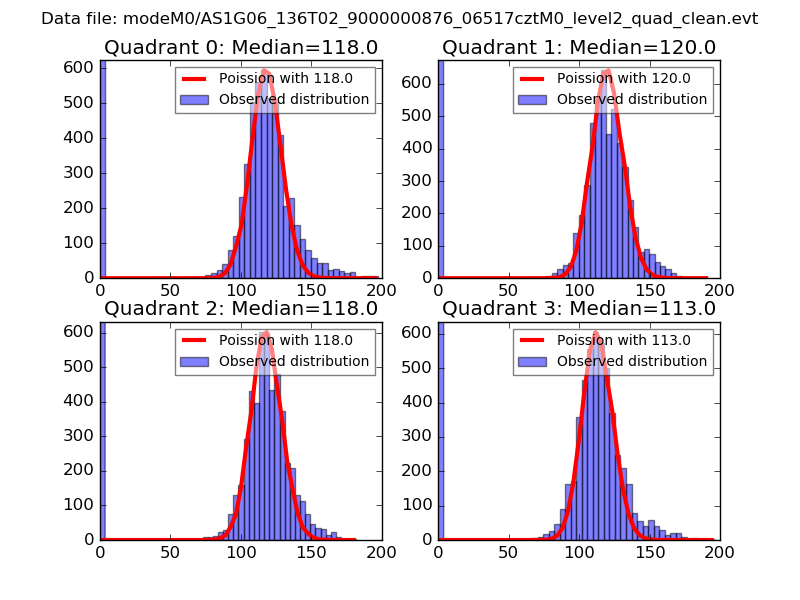 |
 |
| Quadrant-wise count rates Data is divided into 100 sec bins |
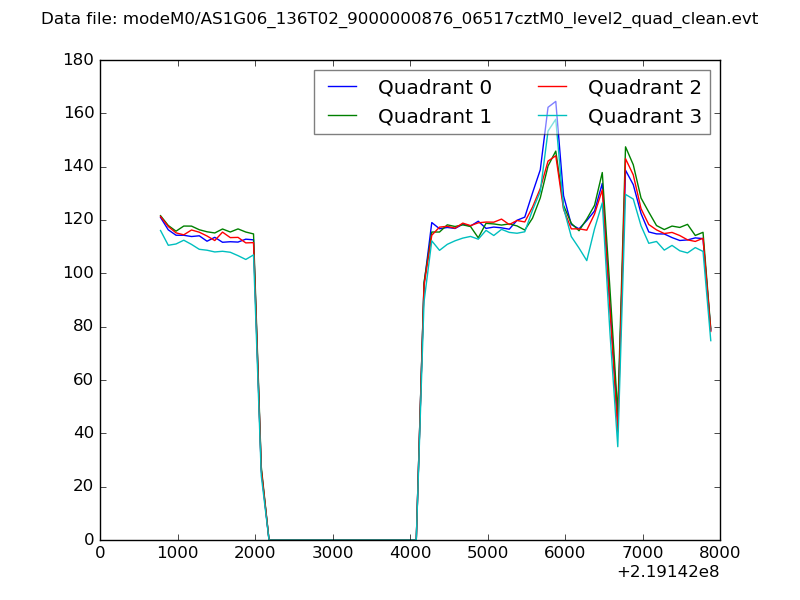 |
|
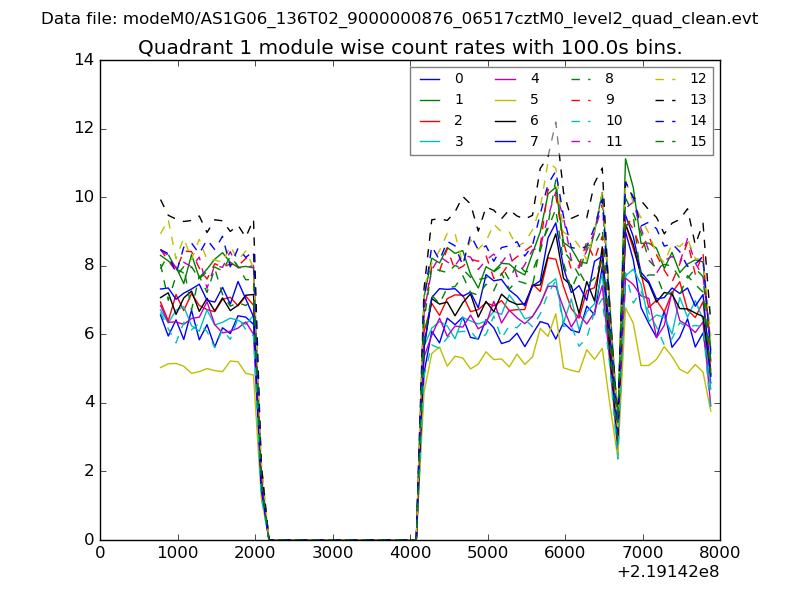
| Module-wise count rates for Quadrant A Data is divided into 100 sec bins |
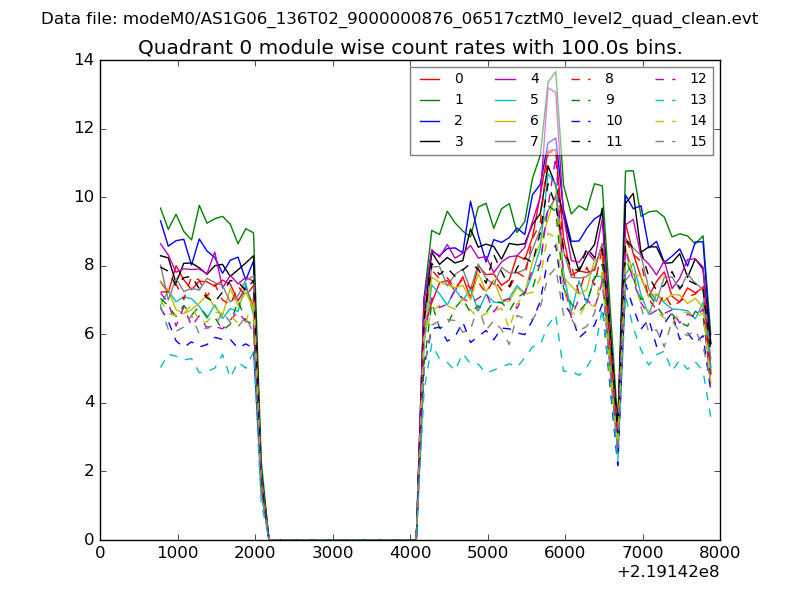 |
 |
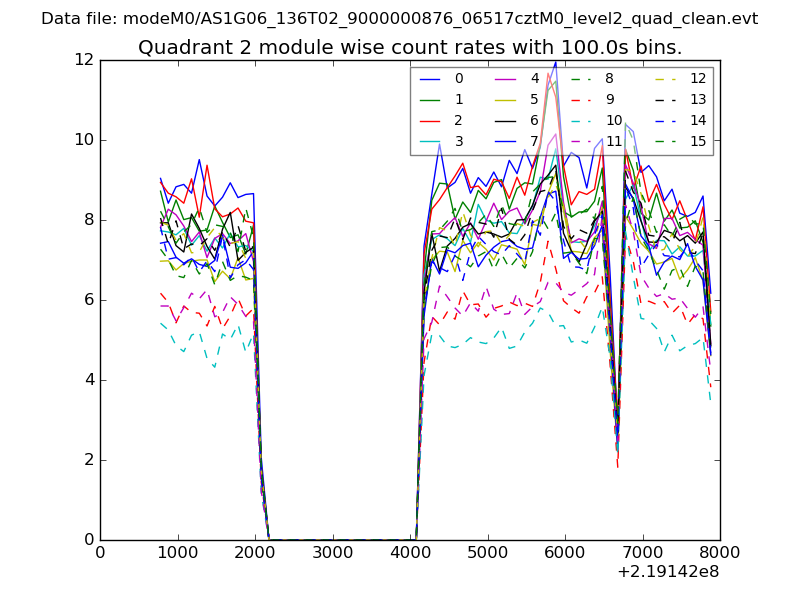
| Module-wise count rates for Quadrant B Data is divided into 100 sec bins |
 |
 |
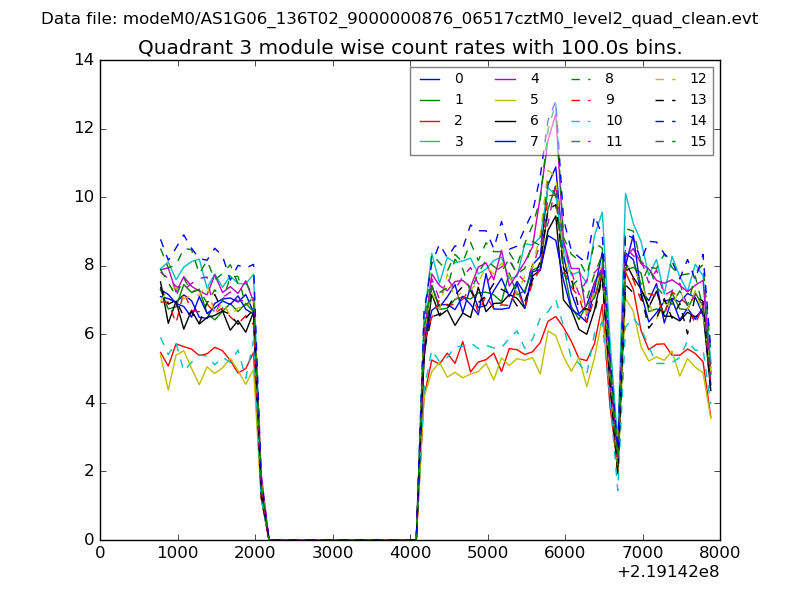
| Module-wise count rates for Quadrant C Data is divided into 100 sec bins |
 |
 |
| Module-wise count rates for Quadrant D Data is divided into 100 sec bins |
 |
 |
| Parameter | Plot |
|---|---|
| CZT HV Monitor | 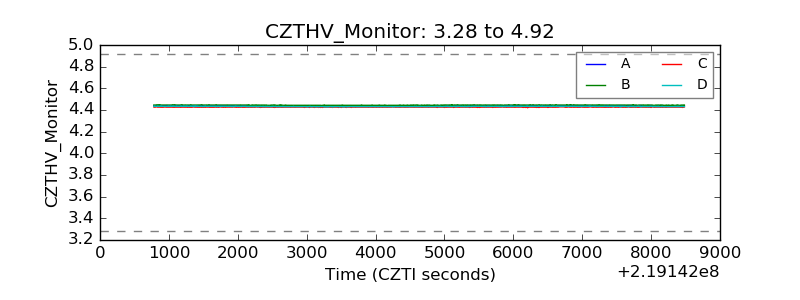 |
| D_VDD | 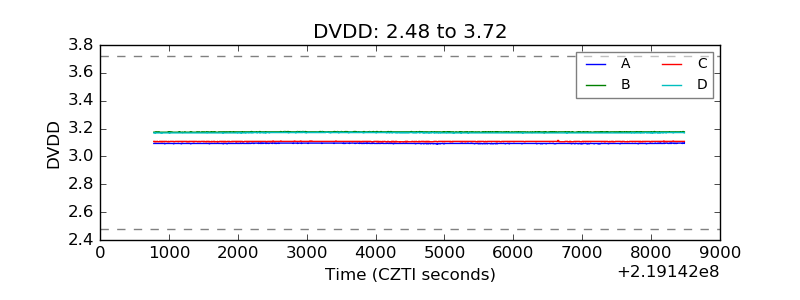 |
| Temperature 1 |  |
| Veto HV Monitor | 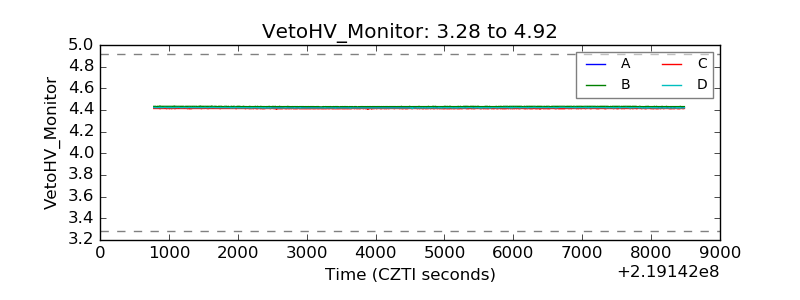 |
| Veto LLD | 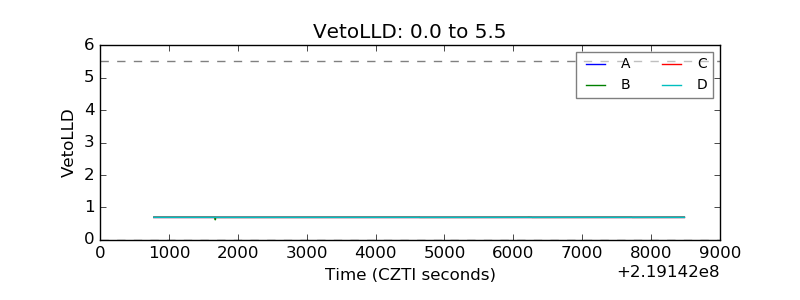 |
| Alpha Counter | 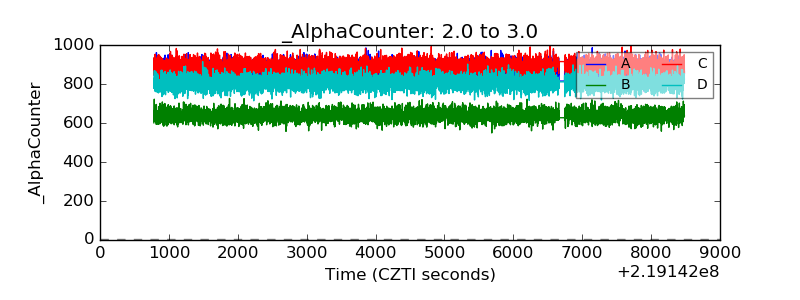 |
| _CPM_Rate | 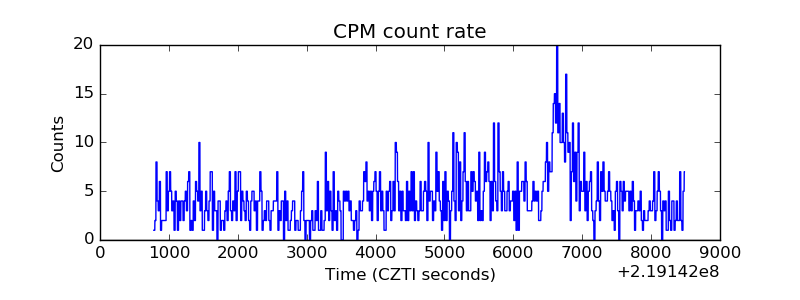 |
| CZT Counter | 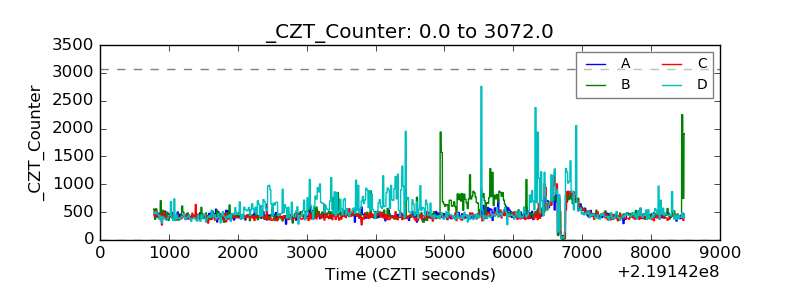 |
| +2.5 Volts monitor |  |
| +5 Volts monitor |  |
| _ROLL_ROT |  |
| _Roll_DEC | 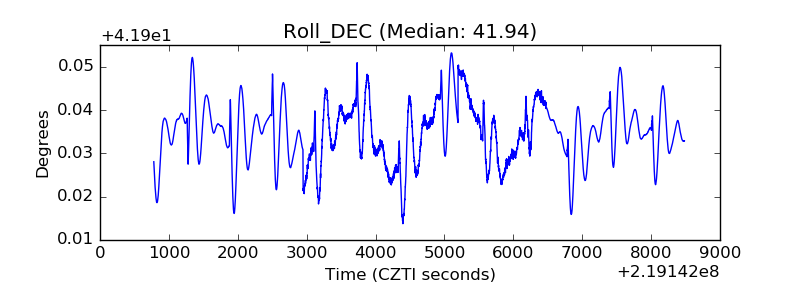 |
| _Roll_RA | 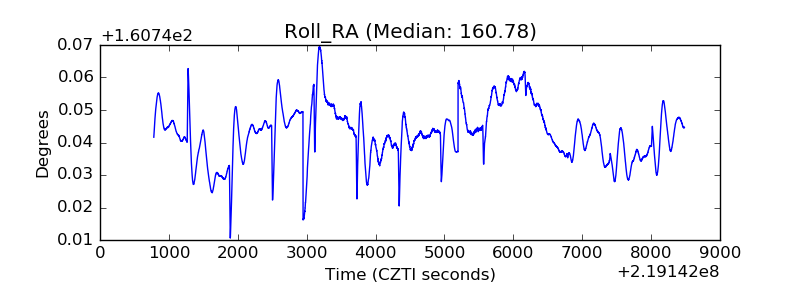 |
| Veto Counter | 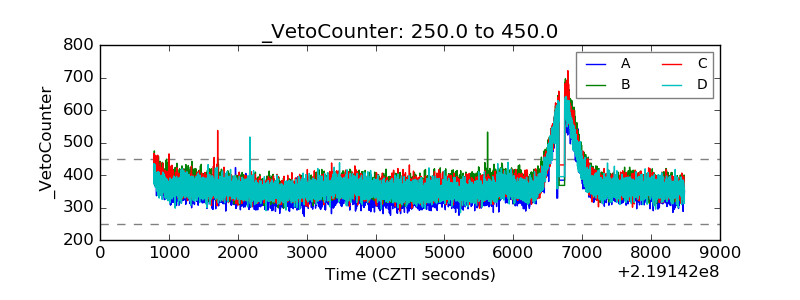 |