| Param | Original file | Final file |
|---|---|---|
| Filename | modeM0/AS1G06_136T02_9000000876_06518cztM0_level2.evt | modeM0/AS1G06_136T02_9000000876_06518cztM0_level2_quad_clean.evt |
| Size (bytes) | 559,702,080 | 87,900,480 |
| Size | 533.8 MB | 83.8 MB |
| Events in quadrant A | 3,606,307 | 533,743 |
| Events in quadrant B | 5,482,099 | 542,345 |
| Events in quadrant C | 3,499,009 | 535,361 |
| Events in quadrant D | 3,841,001 | 515,058 |
| Mode M0 | |||
|---|---|---|---|
| Quadrant | BADHDUFLAG | Total packets | Discarded packets |
| A | 0 | 16086 | 2 |
| B | 0 | 21193 | 1 |
| C | 0 | 15991 | 1 |
| D | 0 | 16715 | 1 |
| Mode SS | |||
|---|---|---|---|
| Quadrant | BADHDUFLAG | Total packets | Discarded packets |
| A | 0 | 154 | 0 |
| B | 0 | 154 | 0 |
| C | 0 | 154 | 0 |
| D | 0 | 154 | 0 |
| Quadrant | Total seconds | Saturated seconds | Saturation percentage |
|---|---|---|---|
| A | 7692 | 219 | 2.847114% |
| B | 7692 | 558 | 7.254290% |
| C | 7692 | 118 | 1.534061% |
| D | 7692 | 144 | 1.872075% |
Noise dominated data is calculated using 1-second bins in cleaned event files. If a bin has >2000 counts, and if more than 50% of those come from <1% of pixels, then it is considered to be noise-dominated and hence unusable.
| Quadrant | # 1 sec bins | Bins with >0 counts | Bins with >2000 counts | High rate bins dominated by noise | Noise dominated (total time) | Noise dominated (detector-on time) | Marked lightcurve |
|---|---|---|---|---|---|---|---|
| A | 7722 | 7694 | 0 | 0 | 0.00% | 0.00% | 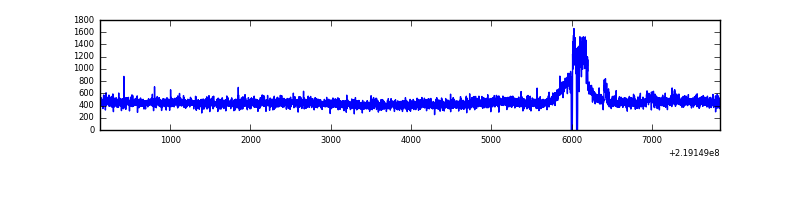 |
| B | 7722 | 7694 | 286 | 286 | 3.70% | 3.72% | 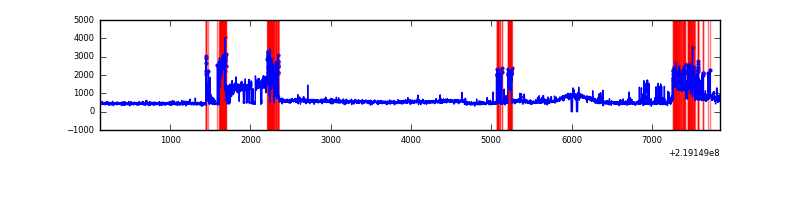 |
| C | 7722 | 7694 | 3 | 3 | 0.04% | 0.04% | 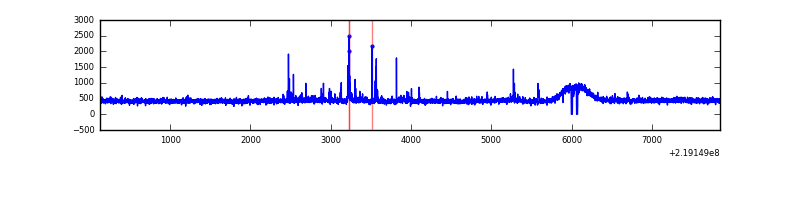 |
| D | 7722 | 7694 | 8 | 8 | 0.10% | 0.10% | 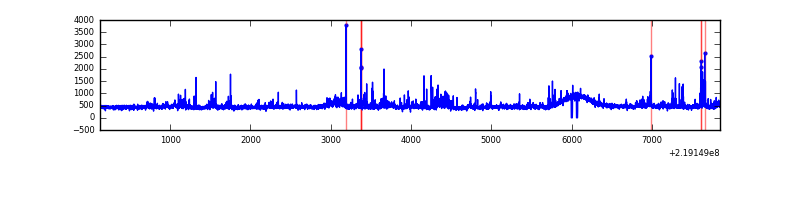 |
Top three noisy pixels from each quadrant. If the there are fewer than three noisy pixels in the level2.evt file, extra rows are filled as -1
| Pixel properties | Quadrant properties | ||||||
|---|---|---|---|---|---|---|---|
| Quadrant | DetID | PixID | Counts | Sigma | Mean | Median | Sigma |
| A | 15 | 236 | 120365 | 651.19 | 895 | 874 | 183.5 |
| A | 8 | 15 | 39090 | 208.27 | 895 | 874 | 183.5 |
| A | 0 | 226 | 8626 | 42.25 | 895 | 874 | 183.5 |
| B | 5 | 143 | 1562719 | 9079.51 | 889 | 865 | 172.0 |
| B | 0 | 228 | 330383 | 1915.58 | 889 | 865 | 172.0 |
| B | 0 | 214 | 60678 | 347.71 | 889 | 865 | 172.0 |
| C | 9 | 237 | 94199 | 462.99 | 867 | 870 | 201.6 |
| C | 7 | 247 | 10219 | 46.38 | 867 | 870 | 201.6 |
| C | 12 | 4 | 7109 | 30.95 | 867 | 870 | 201.6 |
| D | 2 | 136 | 189917 | 879.96 | 872 | 841 | 214.9 |
| D | 11 | 241 | 93776 | 432.52 | 872 | 841 | 214.9 |
| D | 2 | 152 | 73218 | 336.84 | 872 | 841 | 214.9 |
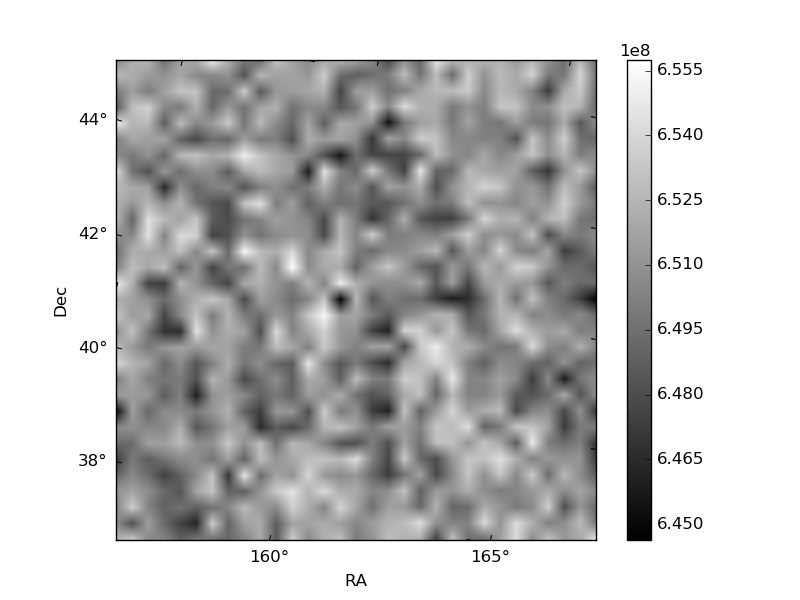
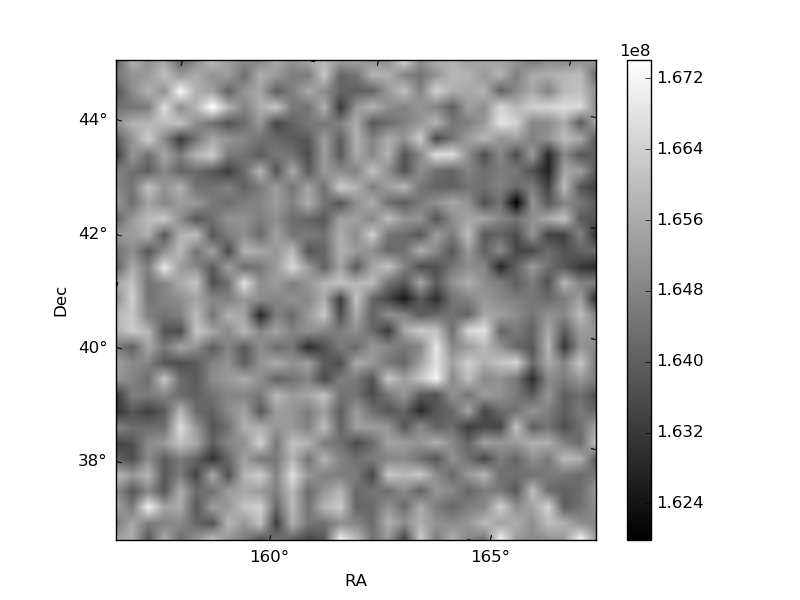
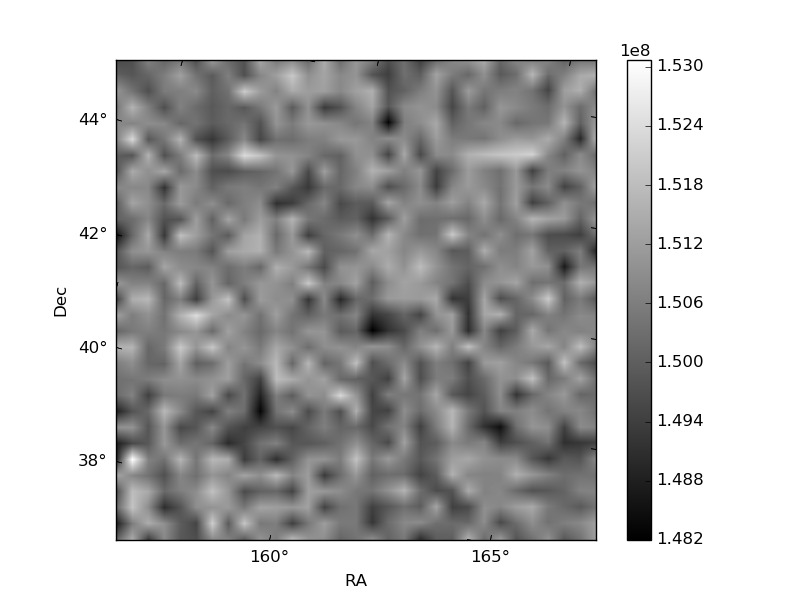
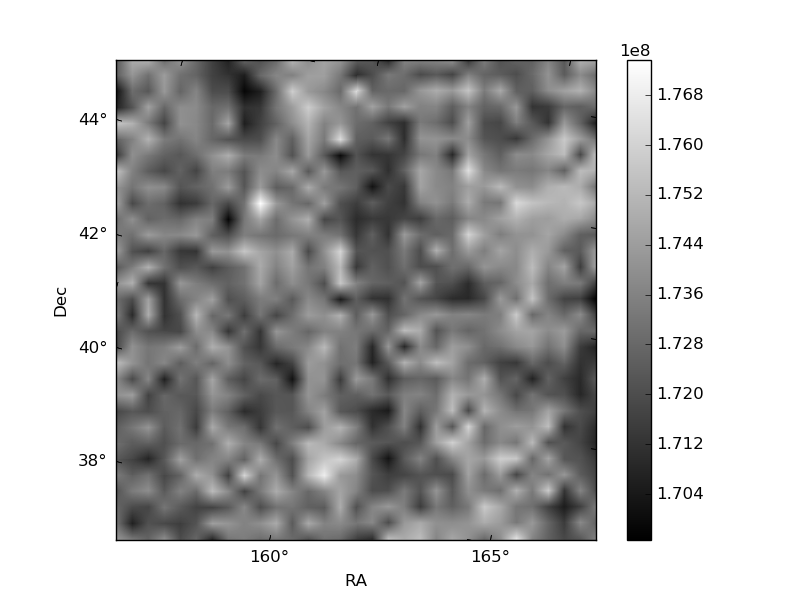
Histogram calculated using DETX and DETY for each event in the final _common_clean file
| Quadrant A | 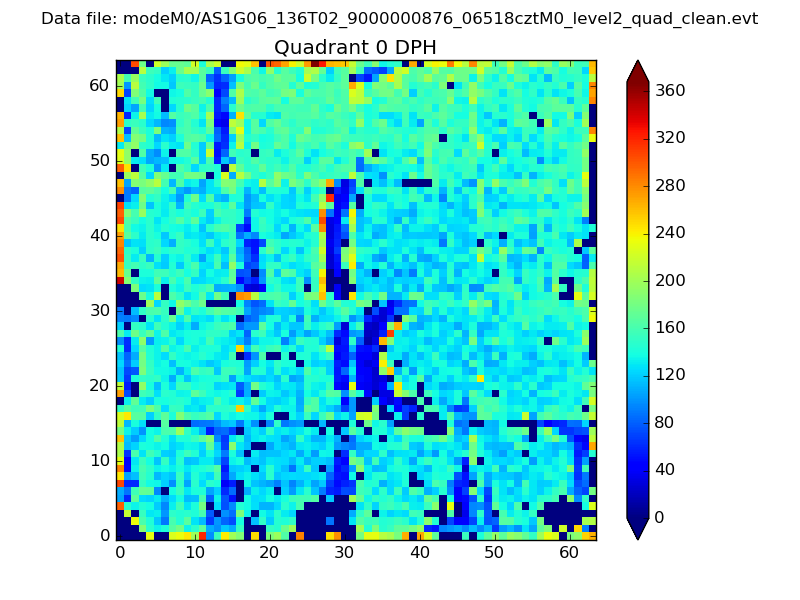 |
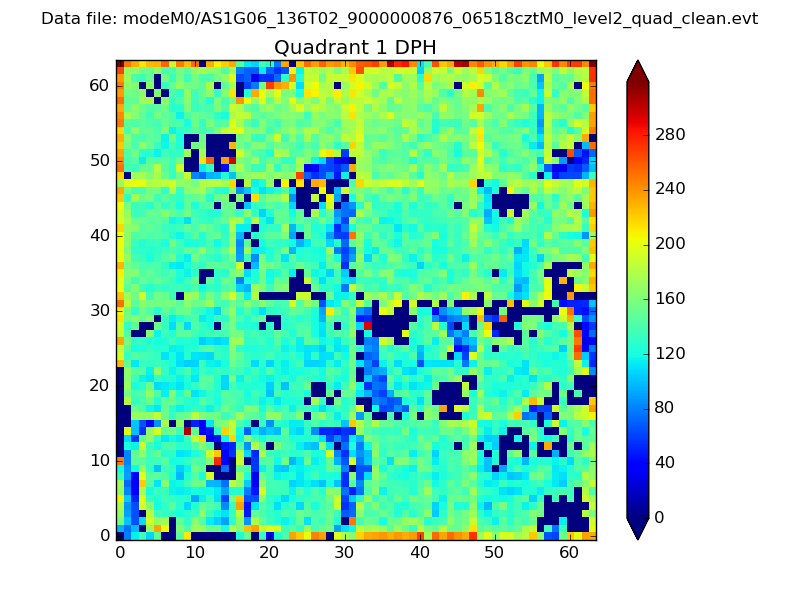 |
Quadrant B |
|---|---|---|---|
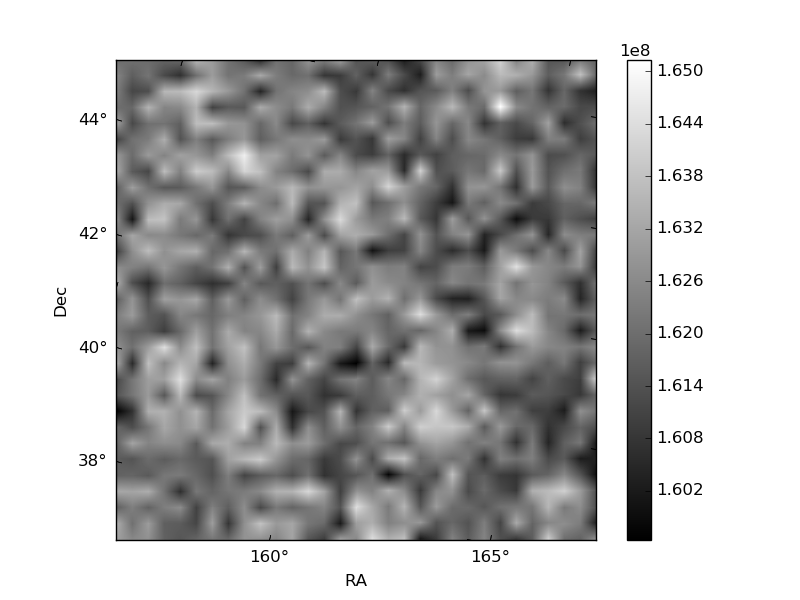
| Quadrant D | 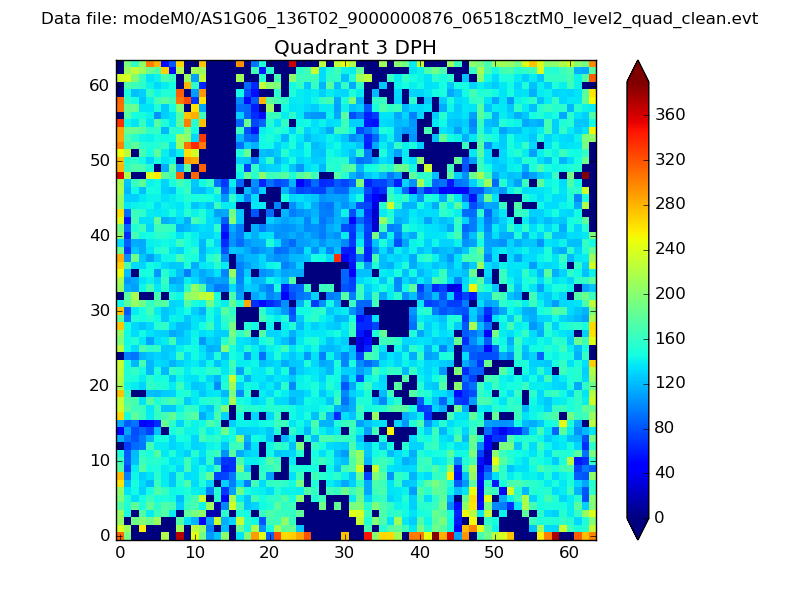 |
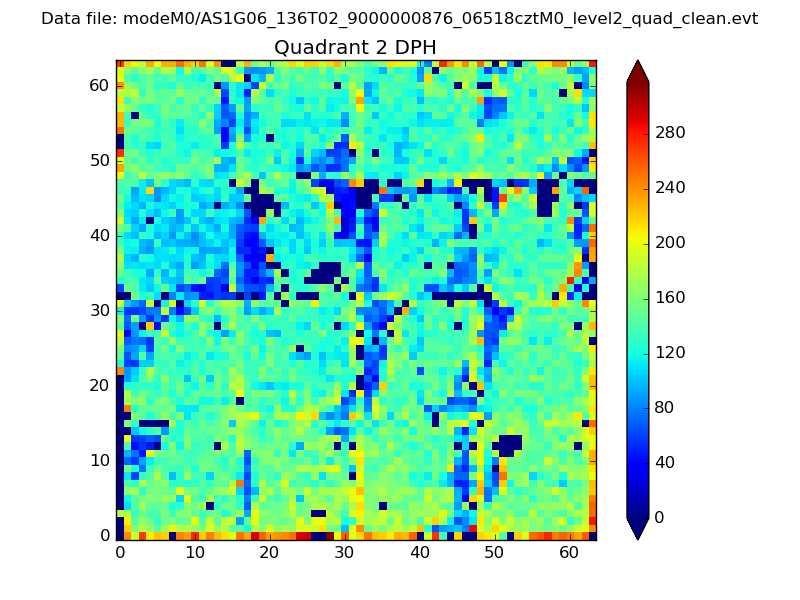 |
Quadrant C |
| Plot type | Count rate plots | Images |
|---|---|---|
| Comparison with Poisson distribution Blue bars denote a histogram of data divided into 1 sec bins. Red curve is a Poisson curve with rate = median count rate of data. |
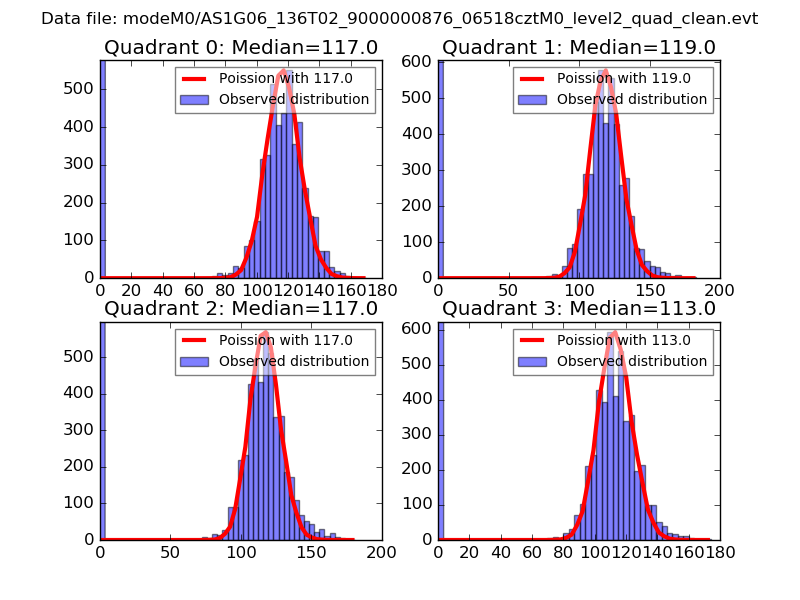 |
 |
| Quadrant-wise count rates Data is divided into 100 sec bins |
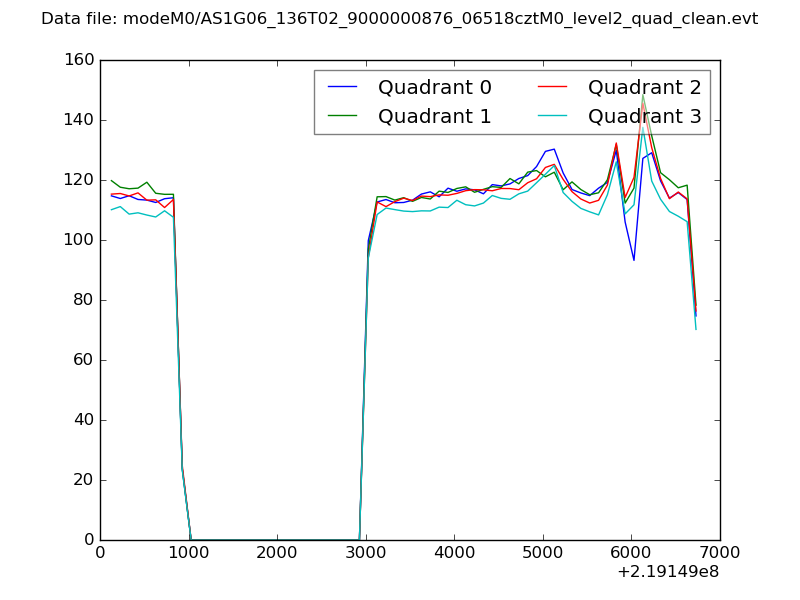 |
|
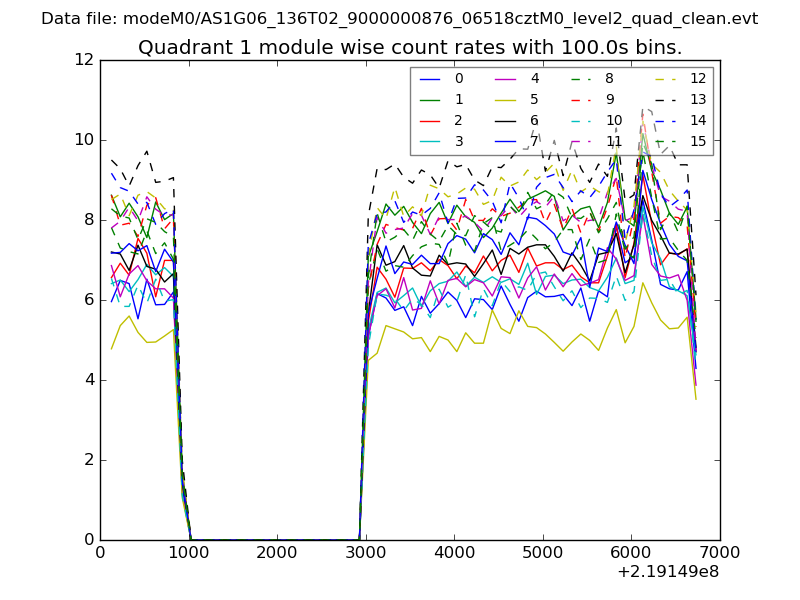
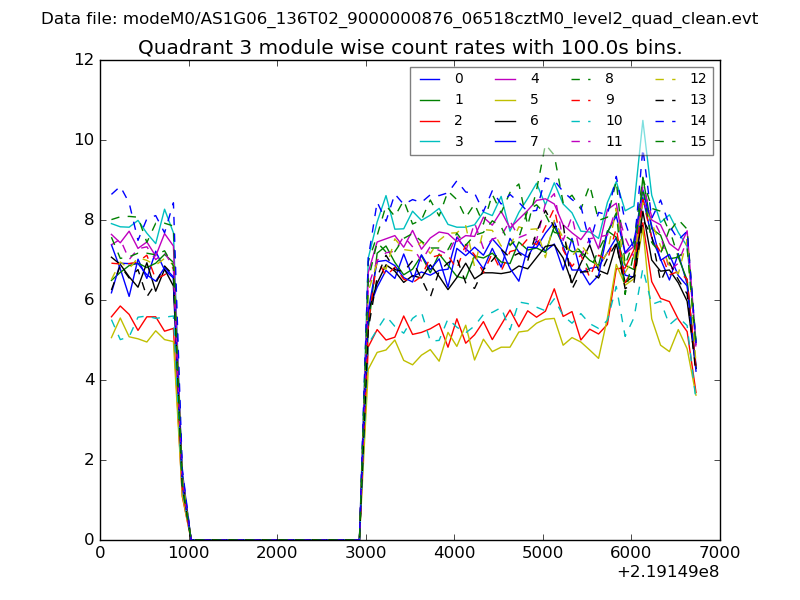
| Module-wise count rates for Quadrant A Data is divided into 100 sec bins |
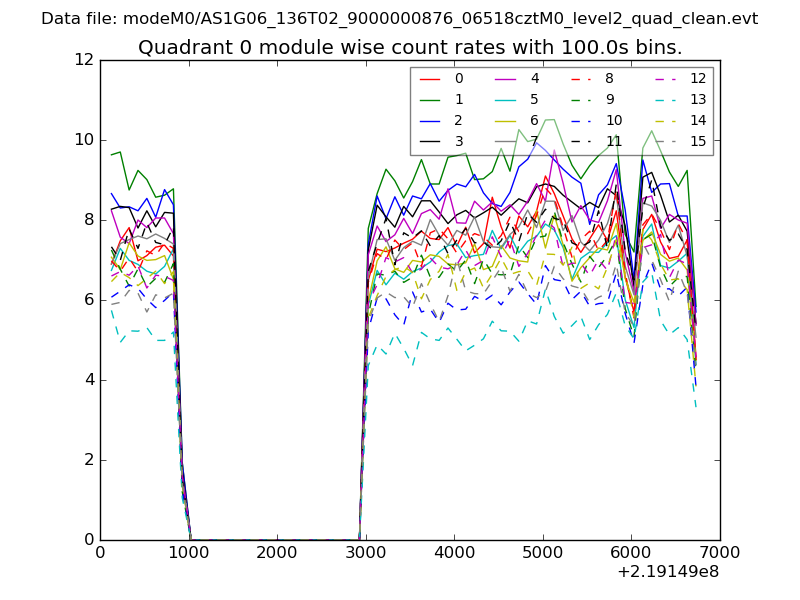 |
 |
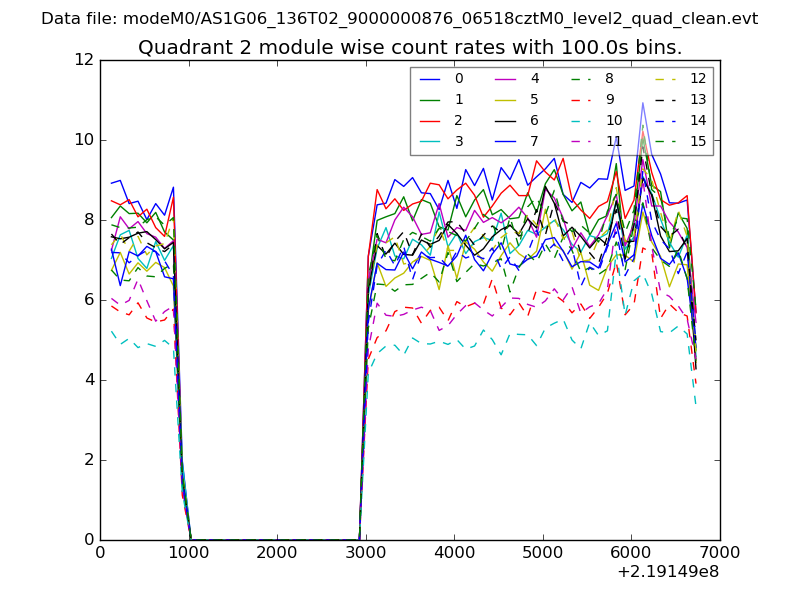
| Module-wise count rates for Quadrant B Data is divided into 100 sec bins |
 |
 |
| Module-wise count rates for Quadrant C Data is divided into 100 sec bins |
 |
 |
| Module-wise count rates for Quadrant D Data is divided into 100 sec bins |
 |
 |
| Parameter | Plot |
|---|---|
| CZT HV Monitor | 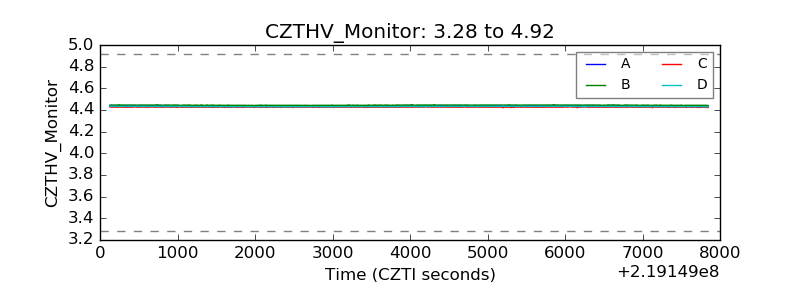 |
| D_VDD | 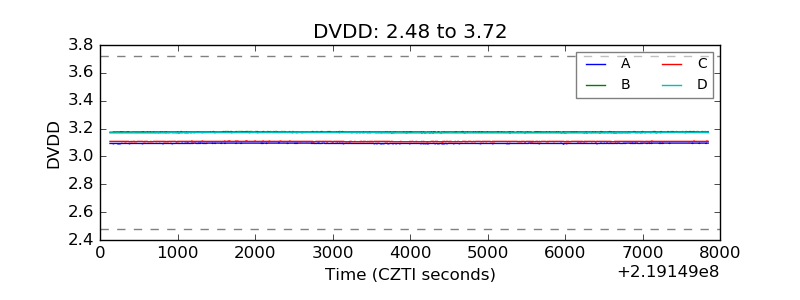 |
| Temperature 1 | 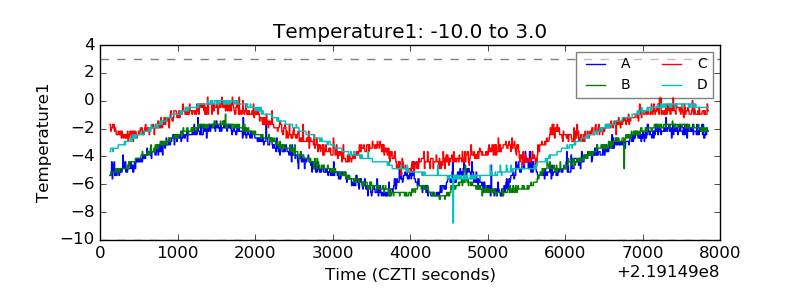 |
| Veto HV Monitor | 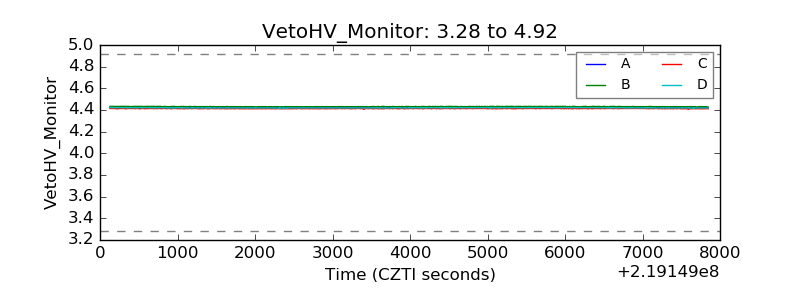 |
| Veto LLD | 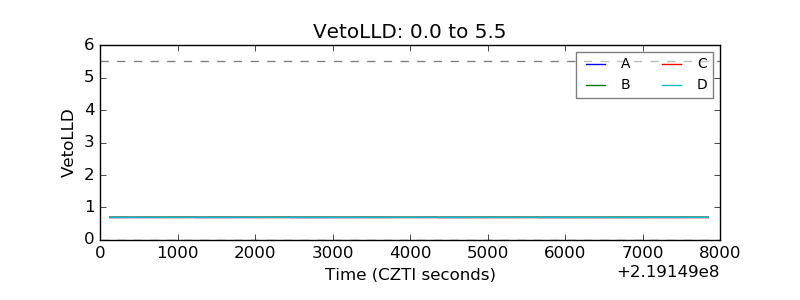 |
| Alpha Counter | 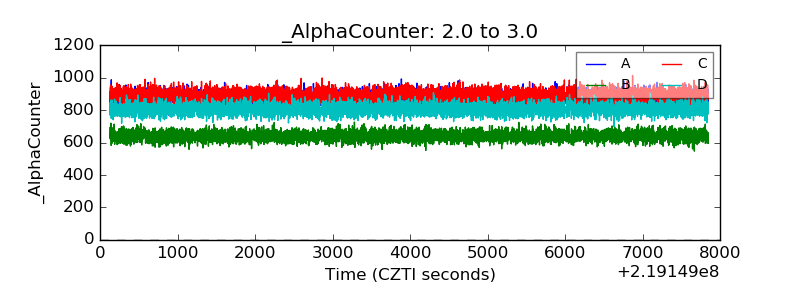 |
| _CPM_Rate | 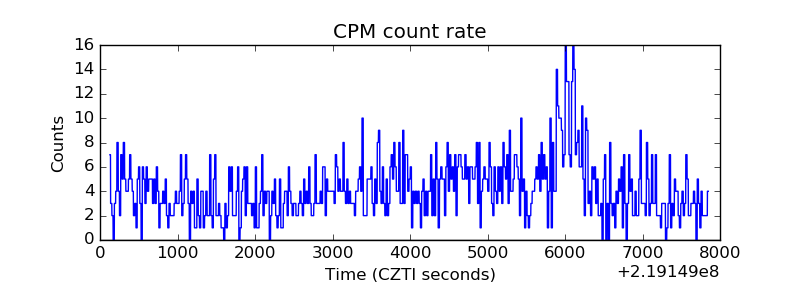 |
| CZT Counter | 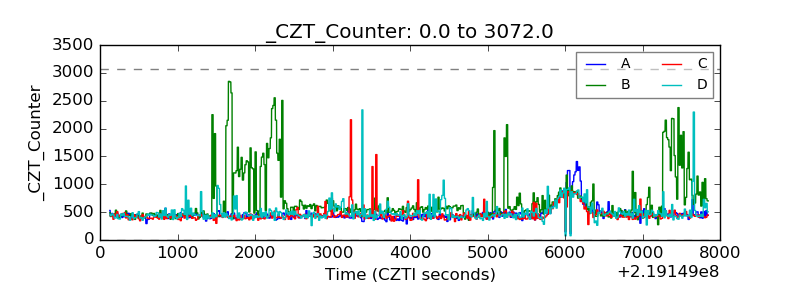 |
| +2.5 Volts monitor |  |
| +5 Volts monitor | 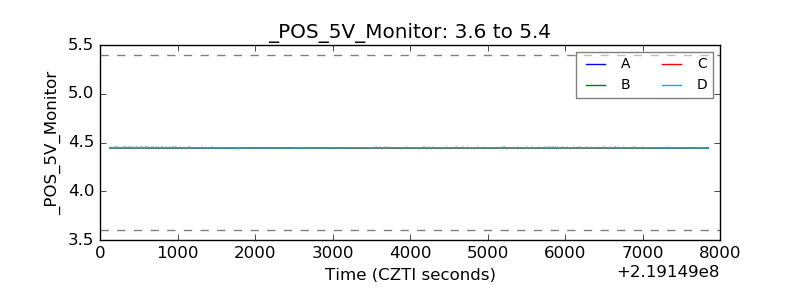 |
| _ROLL_ROT | 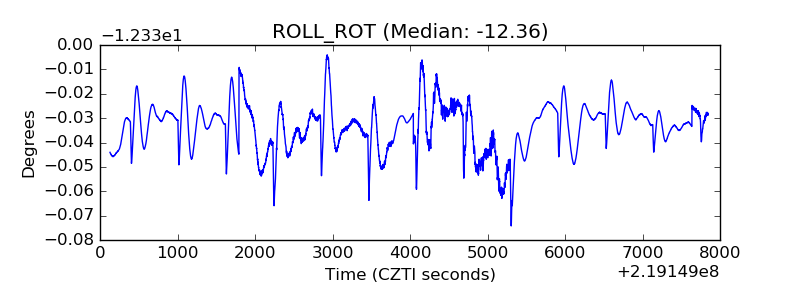 |
| _Roll_DEC | 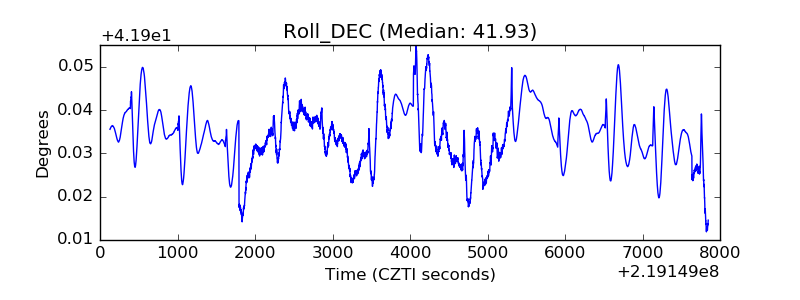 |
| _Roll_RA | 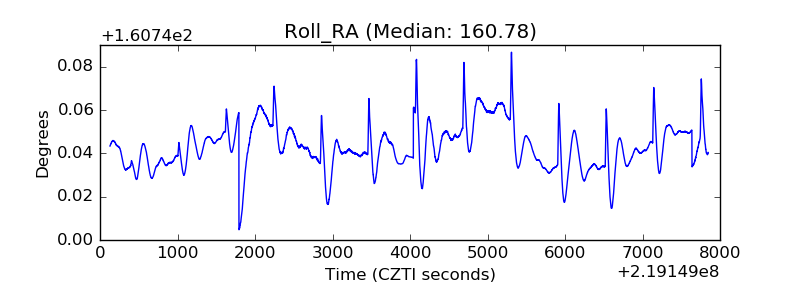 |
| Veto Counter | 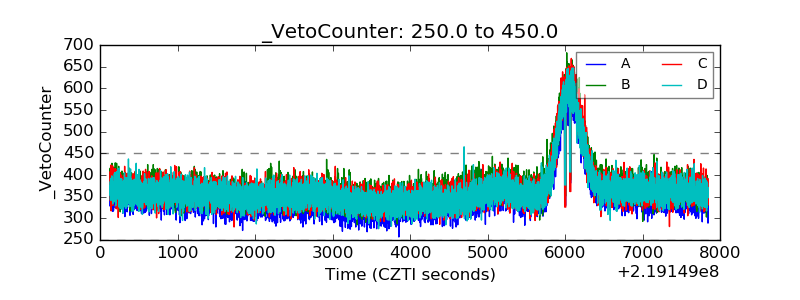 |