| Param | Original file | Final file |
|---|---|---|
| Filename | modeM0/AS1G06_136T02_9000000876_06519cztM0_level2.evt | modeM0/AS1G06_136T02_9000000876_06519cztM0_level2_quad_clean.evt |
| Size (bytes) | 183,214,080 | 11,338,560 |
| Size | 174.7 MB | 10.8 MB |
| Events in quadrant A | 1,099,391 | 41,480 |
| Events in quadrant B | 1,982,972 | 42,189 |
| Events in quadrant C | 1,086,800 | 41,644 |
| Events in quadrant D | 1,209,929 | 40,049 |
| Mode M0 | |||
|---|---|---|---|
| Quadrant | BADHDUFLAG | Total packets | Discarded packets |
| A | 0 | 4948 | 3 |
| B | 0 | 7566 | 5 |
| C | 0 | 4995 | 6 |
| D | 0 | 5255 | 8 |
| Mode SS | |||
|---|---|---|---|
| Quadrant | BADHDUFLAG | Total packets | Discarded packets |
| A | 0 | 50 | 0 |
| B | 0 | 50 | 0 |
| C | 0 | 50 | 0 |
| D | 0 | 50 | 0 |
| Quadrant | Total seconds | Saturated seconds | Saturation percentage |
|---|---|---|---|
| A | 2462 | 3 | 0.121852% |
| B | 2461 | 145 | 5.891914% |
| C | 2460 | 5 | 0.203252% |
| D | 2459 | 7 | 0.284669% |
Noise dominated data is calculated using 1-second bins in cleaned event files. If a bin has >2000 counts, and if more than 50% of those come from <1% of pixels, then it is considered to be noise-dominated and hence unusable.
| Quadrant | # 1 sec bins | Bins with >0 counts | Bins with >2000 counts | High rate bins dominated by noise | Noise dominated (total time) | Noise dominated (detector-on time) | Marked lightcurve |
|---|---|---|---|---|---|---|---|
| A | 2463 | 2463 | 0 | 0 | 0.00% | 0.00% | 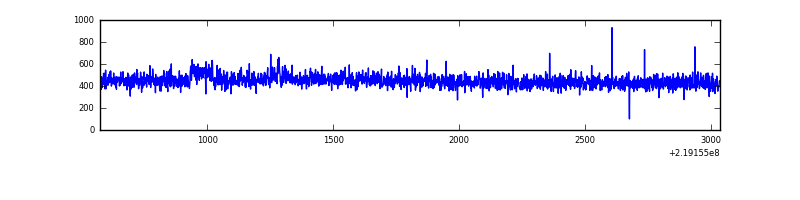 |
| B | 2463 | 2463 | 101 | 101 | 4.10% | 4.10% | 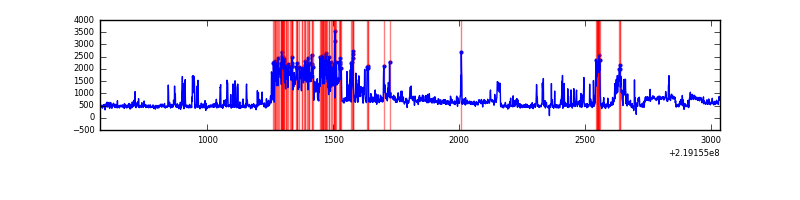 |
| C | 2463 | 2463 | 6 | 6 | 0.24% | 0.24% | 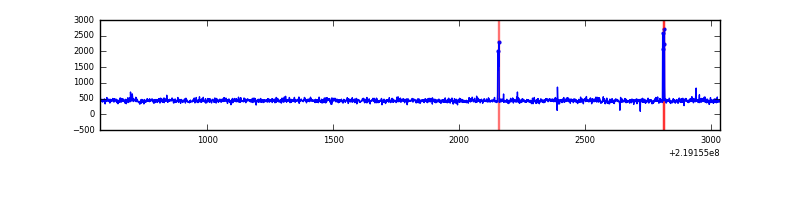 |
| D | 2463 | 2463 | 5 | 5 | 0.20% | 0.20% | 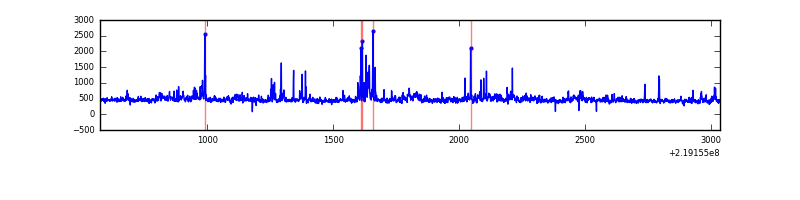 |
Top three noisy pixels from each quadrant. If the there are fewer than three noisy pixels in the level2.evt file, extra rows are filled as -1
| Pixel properties | Quadrant properties | ||||||
|---|---|---|---|---|---|---|---|
| Quadrant | DetID | PixID | Counts | Sigma | Mean | Median | Sigma |
| A | 15 | 236 | 10626 | 175.74 | 280 | 274 | 58.9 |
| A | 8 | 15 | 8940 | 147.12 | 280 | 274 | 58.9 |
| A | 0 | 226 | 2720 | 41.52 | 280 | 274 | 58.9 |
| B | 0 | 228 | 429619 | 7798.42 | 275 | 268 | 55.1 |
| B | 5 | 143 | 386157 | 7009.01 | 275 | 268 | 55.1 |
| B | 0 | 214 | 43568 | 786.47 | 275 | 268 | 55.1 |
| C | 9 | 237 | 29431 | 451.4 | 269 | 270 | 64.6 |
| C | 13 | 61 | 2217 | 30.14 | 269 | 270 | 64.6 |
| C | 12 | 4 | 1883 | 24.97 | 269 | 270 | 64.6 |
| D | 2 | 152 | 68381 | 976.48 | 272 | 263 | 69.8 |
| D | 2 | 136 | 32449 | 461.39 | 272 | 263 | 69.8 |
| D | 12 | 233 | 27244 | 386.78 | 272 | 263 | 69.8 |
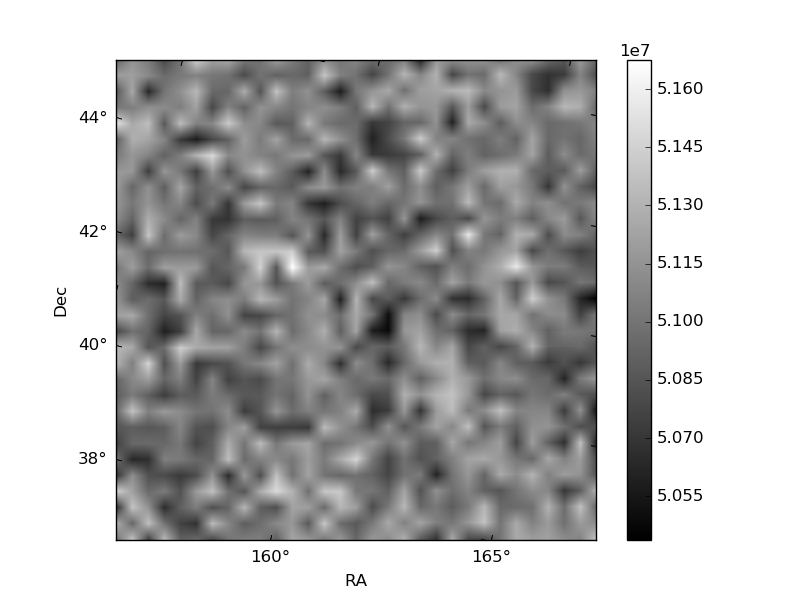
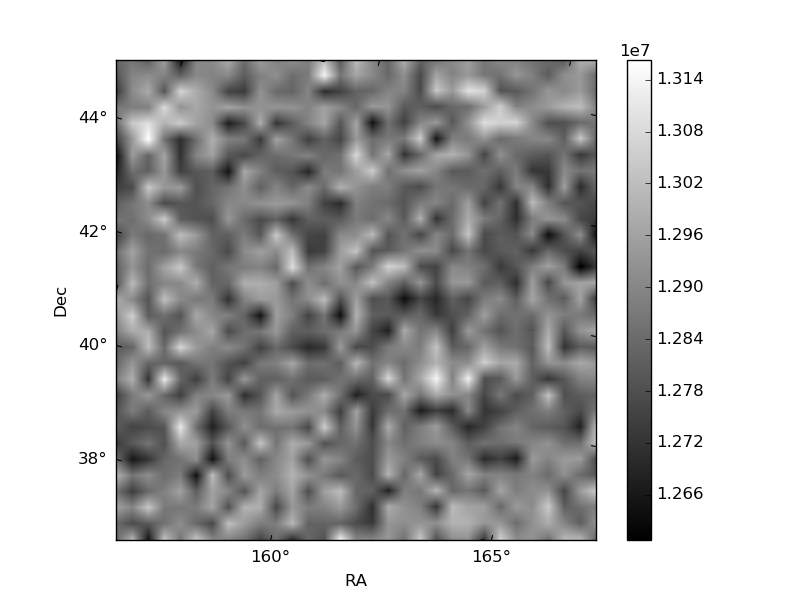
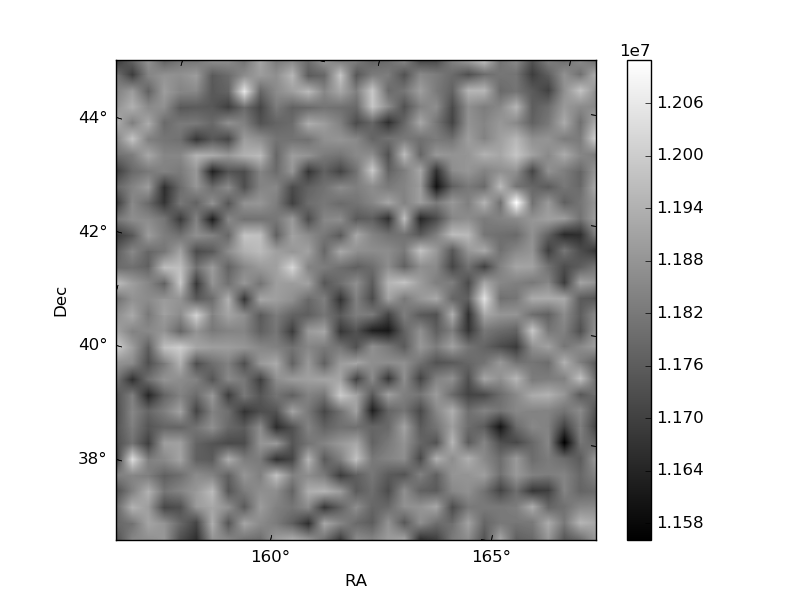
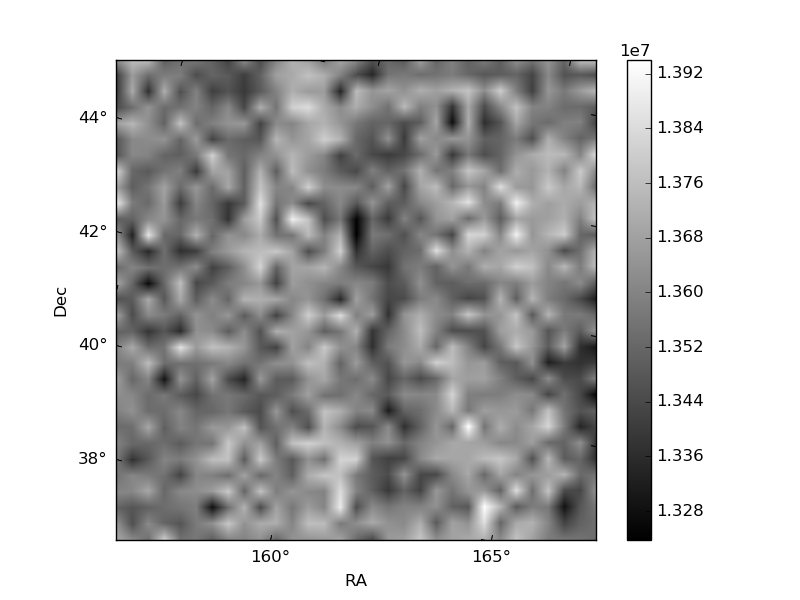
Histogram calculated using DETX and DETY for each event in the final _common_clean file
| Quadrant A | 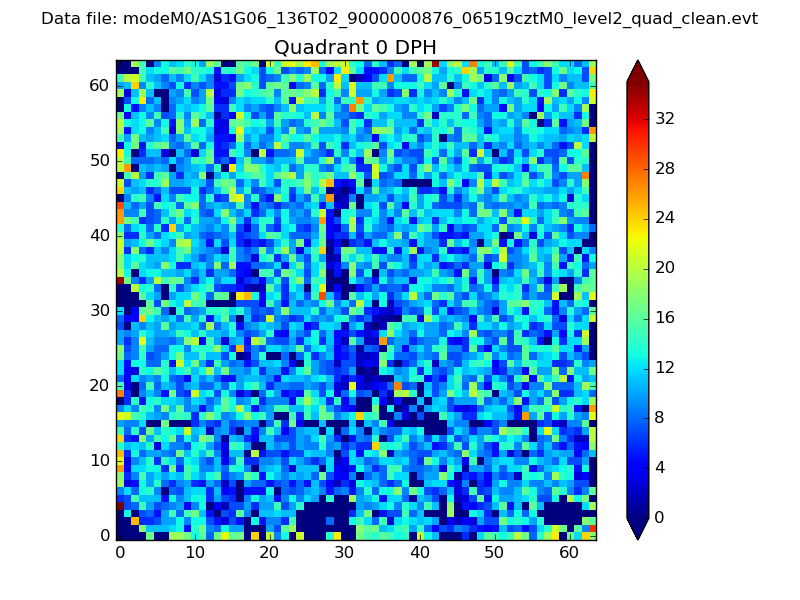 |
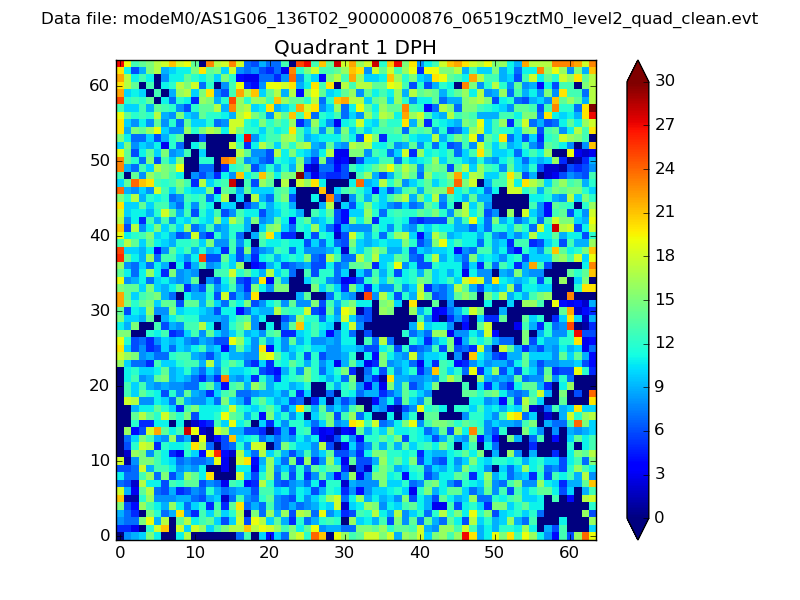 |
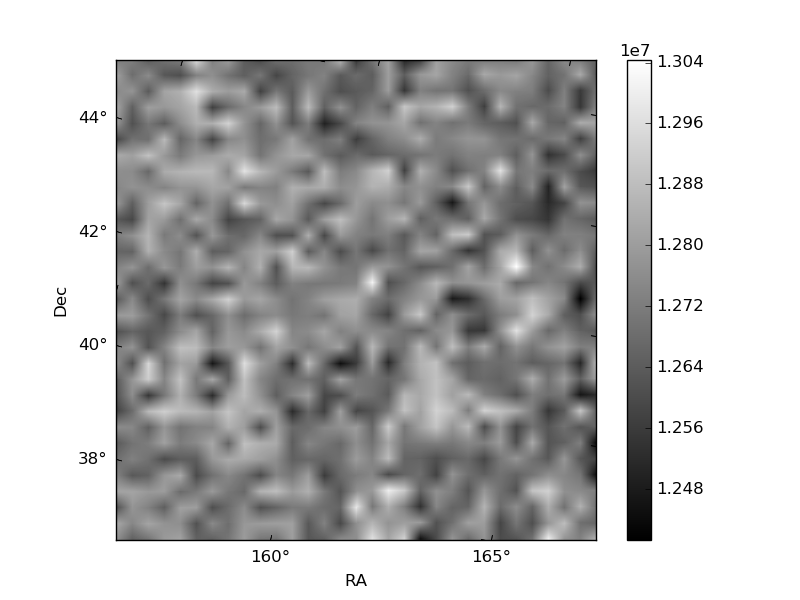
Quadrant B |
|---|---|---|---|
| Quadrant D | 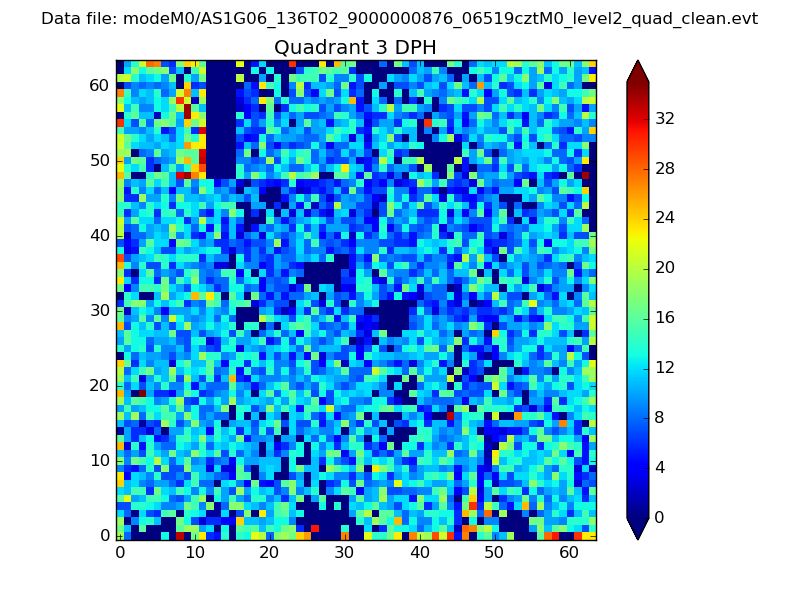 |
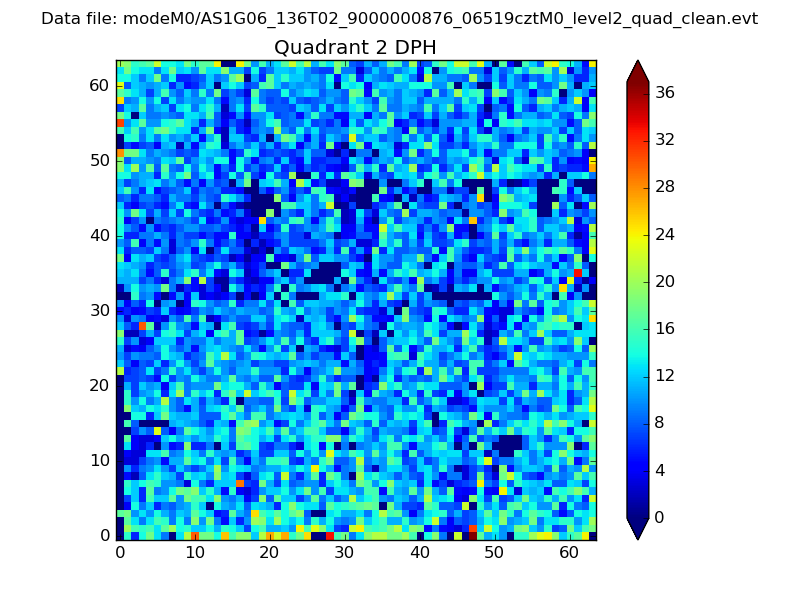 |
Quadrant C |
| Plot type | Count rate plots | Images |
|---|---|---|
| Comparison with Poisson distribution Blue bars denote a histogram of data divided into 1 sec bins. Red curve is a Poisson curve with rate = median count rate of data. |
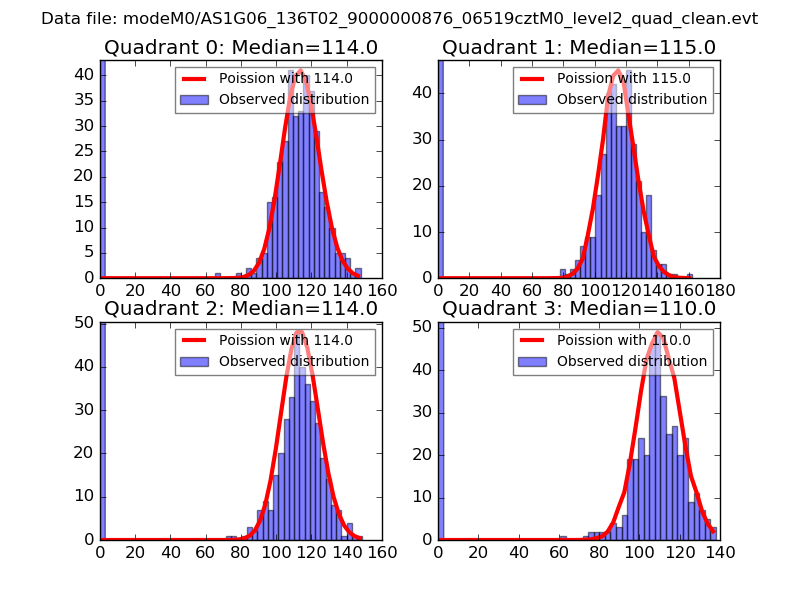 |
 |
| Quadrant-wise count rates Data is divided into 100 sec bins |
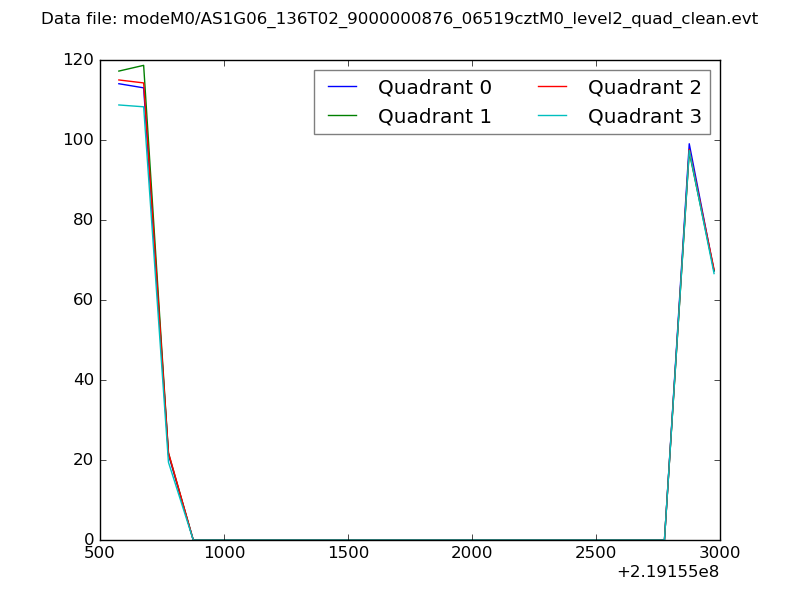 |
|
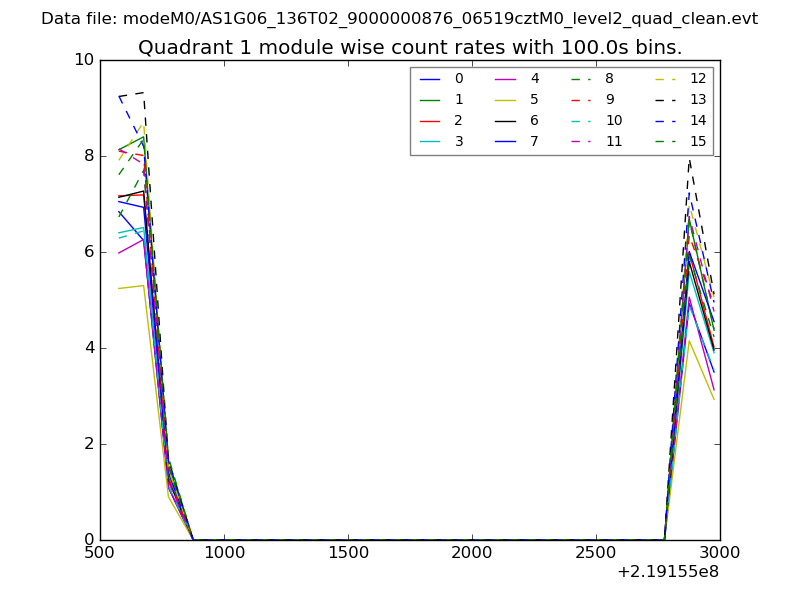
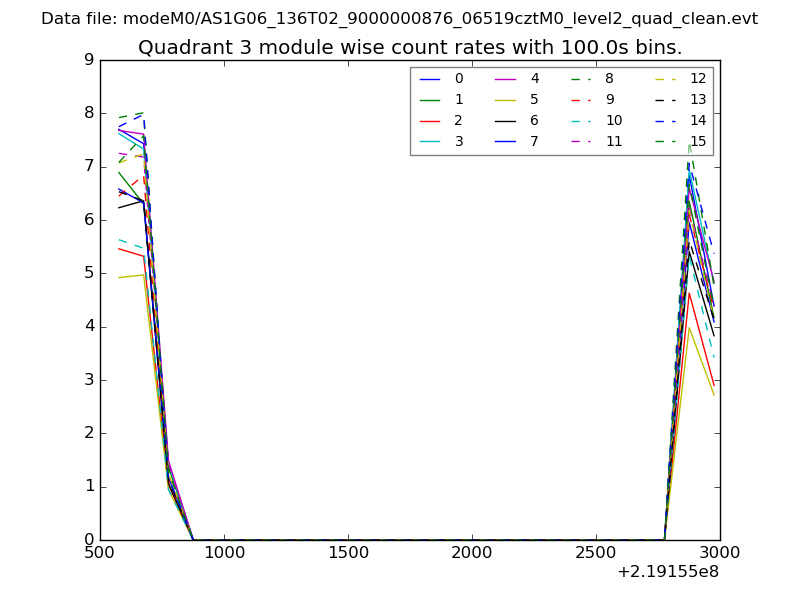
| Module-wise count rates for Quadrant A Data is divided into 100 sec bins |
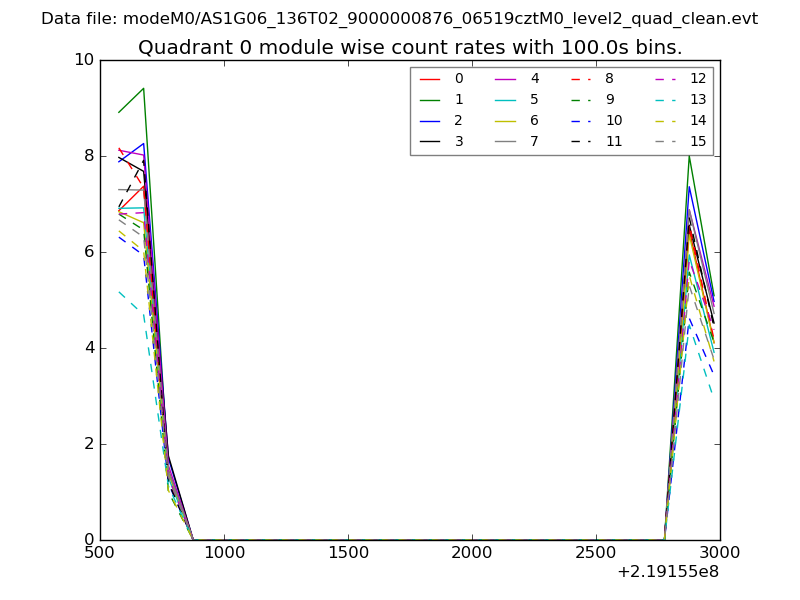 |
 |
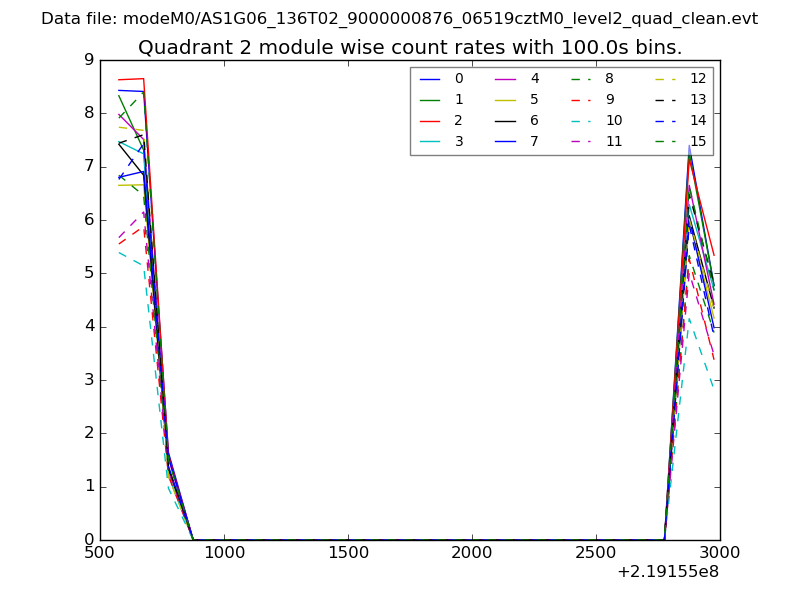
| Module-wise count rates for Quadrant B Data is divided into 100 sec bins |
 |
 |
| Module-wise count rates for Quadrant C Data is divided into 100 sec bins |
 |
 |
| Module-wise count rates for Quadrant D Data is divided into 100 sec bins |
 |
 |
| Parameter | Plot |
|---|---|
| CZT HV Monitor | 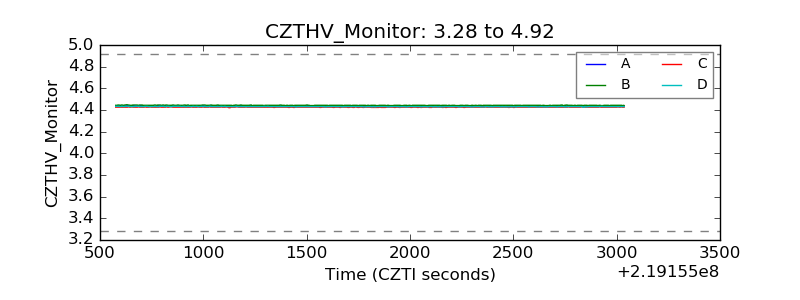 |
| D_VDD | 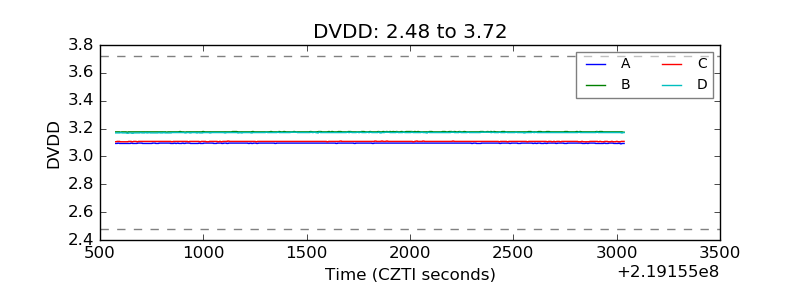 |
| Temperature 1 | 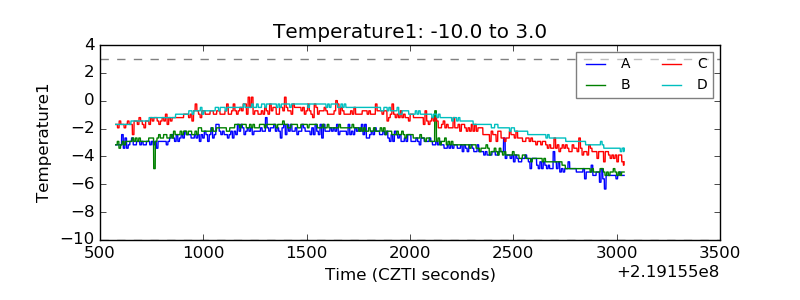 |
| Veto HV Monitor | 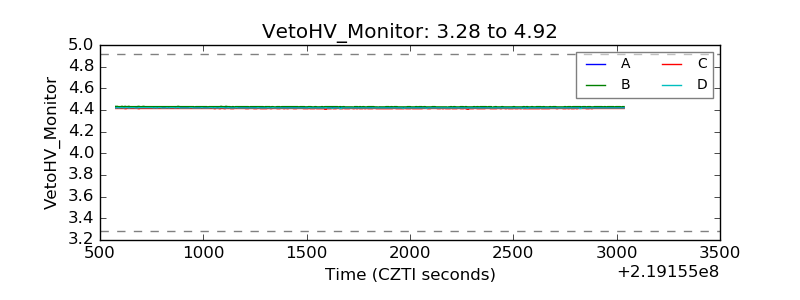 |
| Veto LLD | 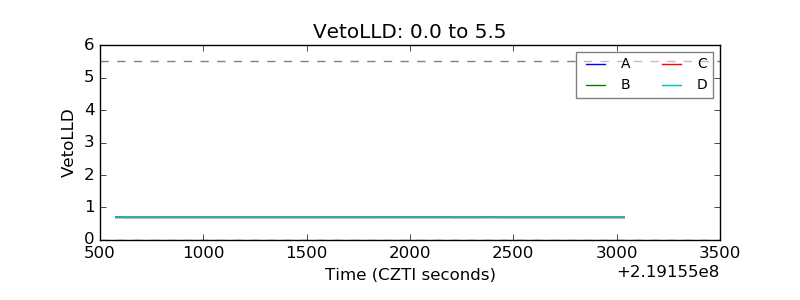 |
| Alpha Counter | 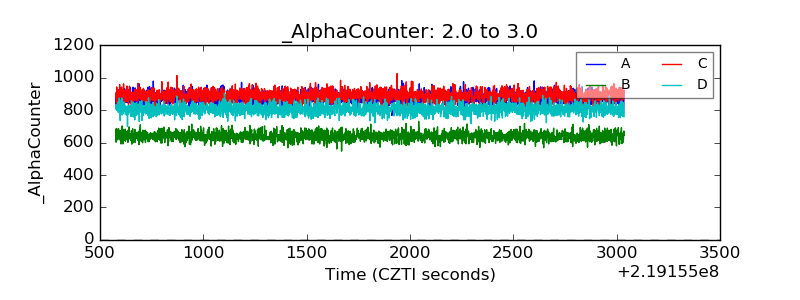 |
| _CPM_Rate | 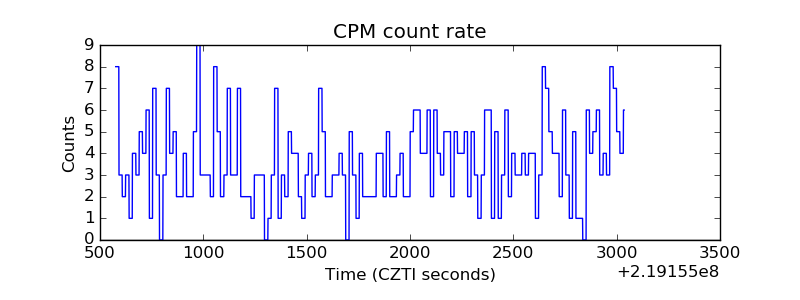 |
| CZT Counter | 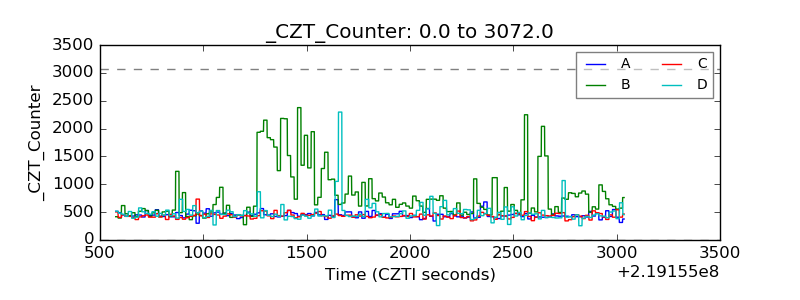 |
| +2.5 Volts monitor |  |
| +5 Volts monitor |  |
| _ROLL_ROT | 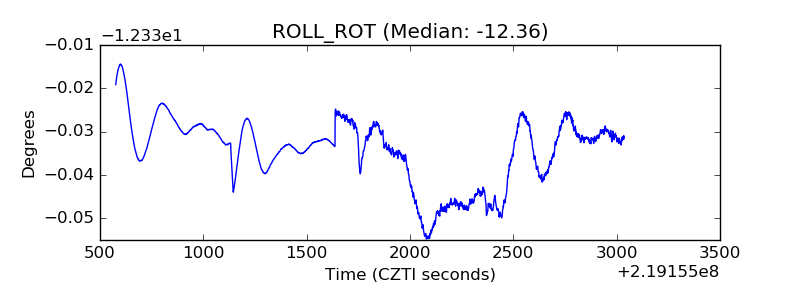 |
| _Roll_DEC | 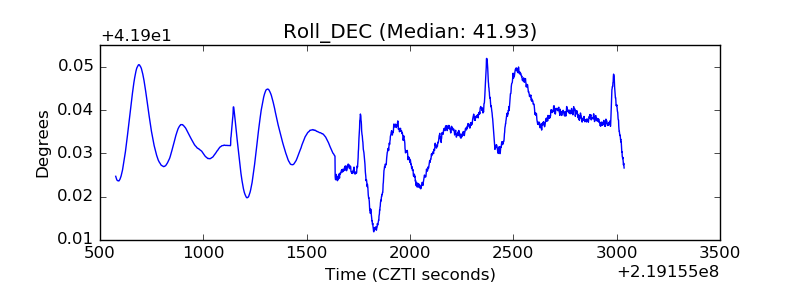 |
| _Roll_RA | 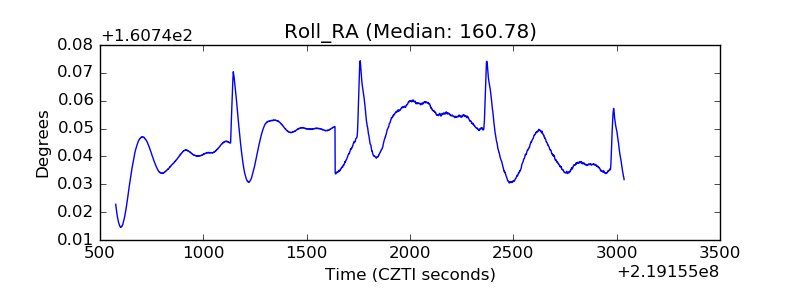 |
| Veto Counter | 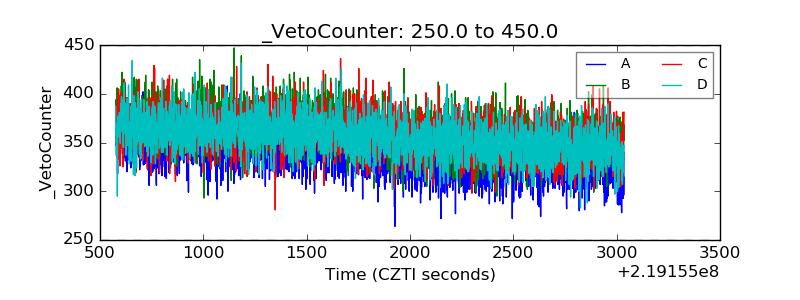 |