| Param | Original file | Final file |
|---|---|---|
| Filename | modeM0/AS1G06_136T02_9000000876_06521cztM0_level2.evt | modeM0/AS1G06_136T02_9000000876_06521cztM0_level2_quad_clean.evt |
| Size (bytes) | 935,775,360 | 188,982,720 |
| Size | 892.4 MB | 180.2 MB |
| Events in quadrant A | 6,696,895 | 1,194,650 |
| Events in quadrant B | 7,171,283 | 1,197,841 |
| Events in quadrant C | 6,672,944 | 1,183,414 |
| Events in quadrant D | 6,820,867 | 1,150,849 |
| Mode M0 | |||
|---|---|---|---|
| Quadrant | BADHDUFLAG | Total packets | Discarded packets |
| A | 0 | 30219 | 17 |
| B | 0 | 31158 | 30 |
| C | 0 | 30442 | 18 |
| D | 0 | 31015 | 19 |
| Mode M9 | |||
|---|---|---|---|
| Quadrant | BADHDUFLAG | Total packets | Discarded packets |
| A | 0 | 10 | 0 |
| B | 0 | 10 | 0 |
| C | 0 | 10 | 0 |
| D | 0 | 10 | 0 |
| Mode SS | |||
|---|---|---|---|
| Quadrant | BADHDUFLAG | Total packets | Discarded packets |
| A | 0 | 292 | 0 |
| B | 0 | 292 | 0 |
| C | 0 | 292 | 0 |
| D | 0 | 292 | 0 |
| Quadrant | Total seconds | Saturated seconds | Saturation percentage |
|---|---|---|---|
| A | 14444 | 126 | 0.872335% |
| B | 14440 | 186 | 1.288089% |
| C | 14443 | 194 | 1.343211% |
| D | 14443 | 151 | 1.045489% |
Noise dominated data is calculated using 1-second bins in cleaned event files. If a bin has >2000 counts, and if more than 50% of those come from <1% of pixels, then it is considered to be noise-dominated and hence unusable.
| Quadrant | # 1 sec bins | Bins with >0 counts | Bins with >2000 counts | High rate bins dominated by noise | Noise dominated (total time) | Noise dominated (detector-on time) | Marked lightcurve |
|---|---|---|---|---|---|---|---|
| A | 15366 | 14453 | 1 | 1 | 0.01% | 0.01% | 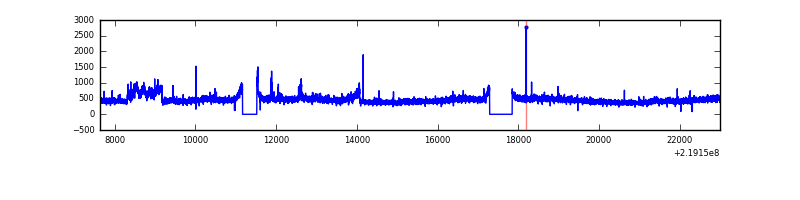 |
| B | 15366 | 14453 | 57 | 57 | 0.37% | 0.39% | 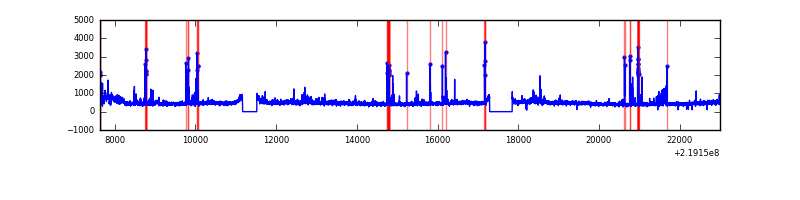 |
| C | 15366 | 14453 | 86 | 86 | 0.56% | 0.60% | 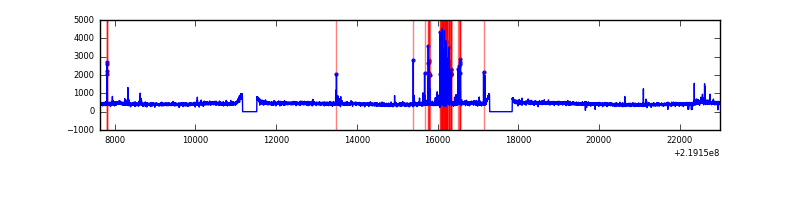 |
| D | 15366 | 14453 | 35 | 35 | 0.23% | 0.24% | 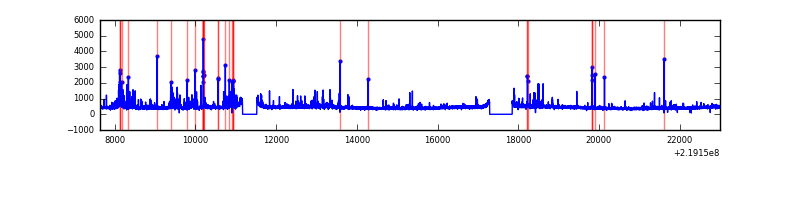 |
Top three noisy pixels from each quadrant. If the there are fewer than three noisy pixels in the level2.evt file, extra rows are filled as -1
| Pixel properties | Quadrant properties | ||||||
|---|---|---|---|---|---|---|---|
| Quadrant | DetID | PixID | Counts | Sigma | Mean | Median | Sigma |
| A | 15 | 236 | 417145 | 1244.73 | 1627 | 1591 | 333.8 |
| A | 0 | 226 | 15758 | 42.44 | 1627 | 1591 | 333.8 |
| A | 12 | 194 | 14812 | 39.6 | 1627 | 1591 | 333.8 |
| B | 5 | 143 | 346062 | 1102.17 | 1636 | 1594 | 312.5 |
| B | 0 | 219 | 118299 | 373.41 | 1636 | 1594 | 312.5 |
| B | 4 | 48 | 95971 | 301.97 | 1636 | 1594 | 312.5 |
| C | 9 | 237 | 456966 | 1249.59 | 1573 | 1578 | 364.4 |
| C | 7 | 247 | 21180 | 53.79 | 1573 | 1578 | 364.4 |
| C | 14 | 222 | 17345 | 43.26 | 1573 | 1578 | 364.4 |
| D | 2 | 136 | 337456 | 876.52 | 1576 | 1525 | 383.3 |
| D | 2 | 14 | 111284 | 286.38 | 1576 | 1525 | 383.3 |
| D | 2 | 152 | 108246 | 278.46 | 1576 | 1525 | 383.3 |
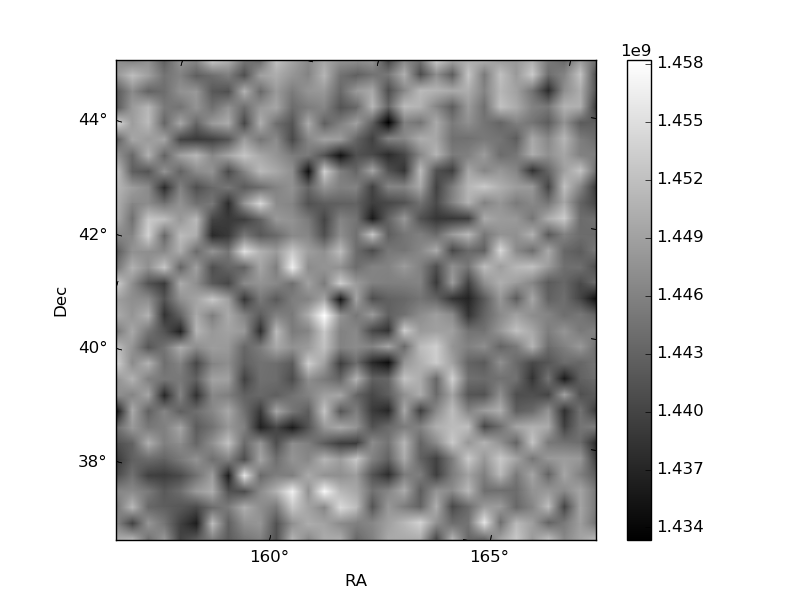
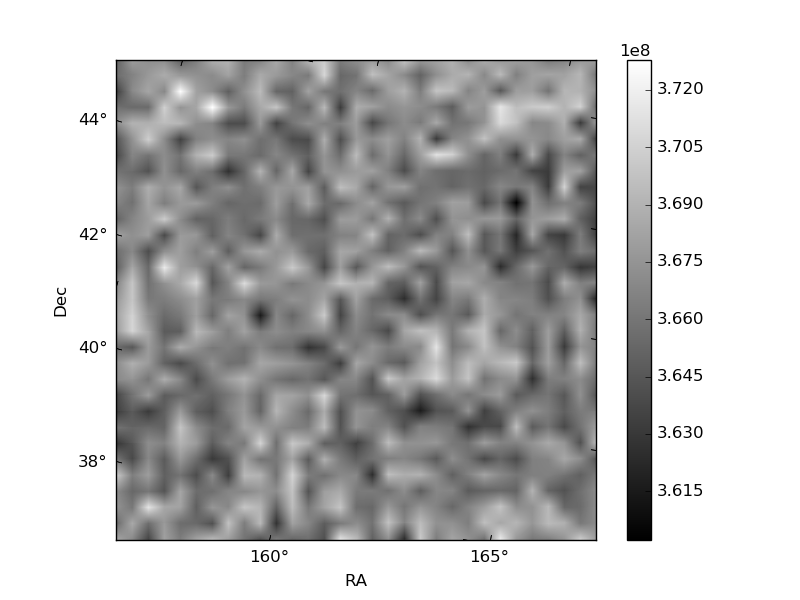
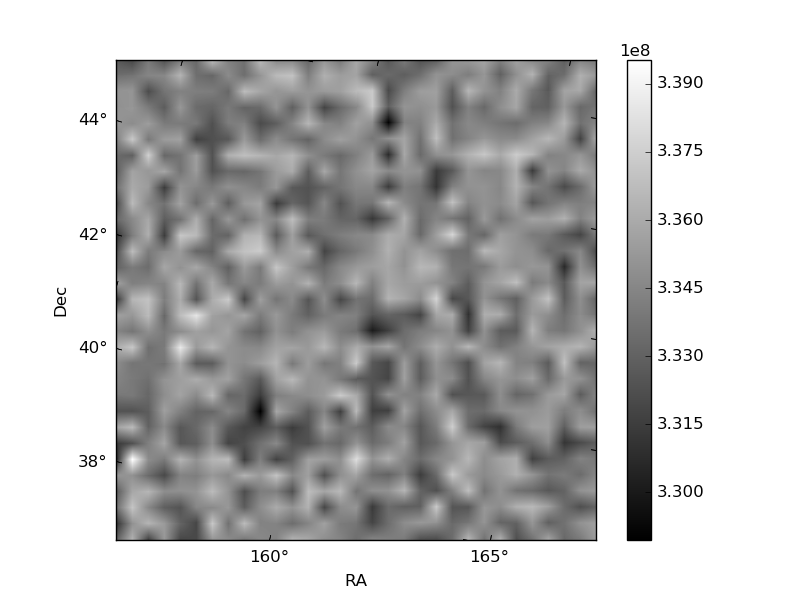
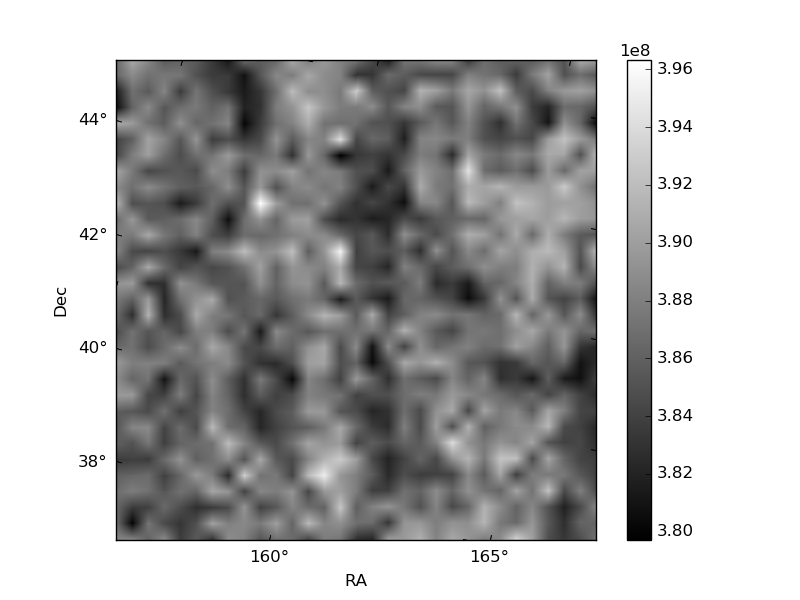
Histogram calculated using DETX and DETY for each event in the final _common_clean file
| Quadrant A | 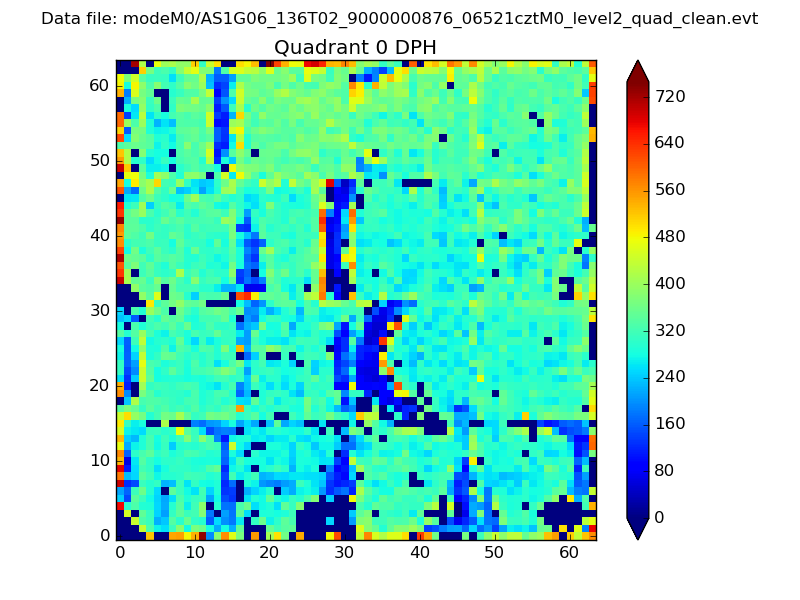 |
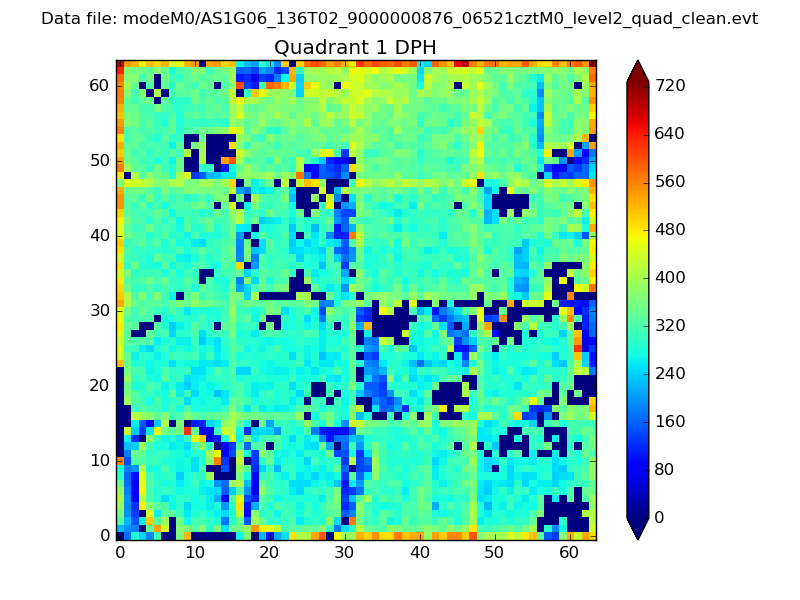 |
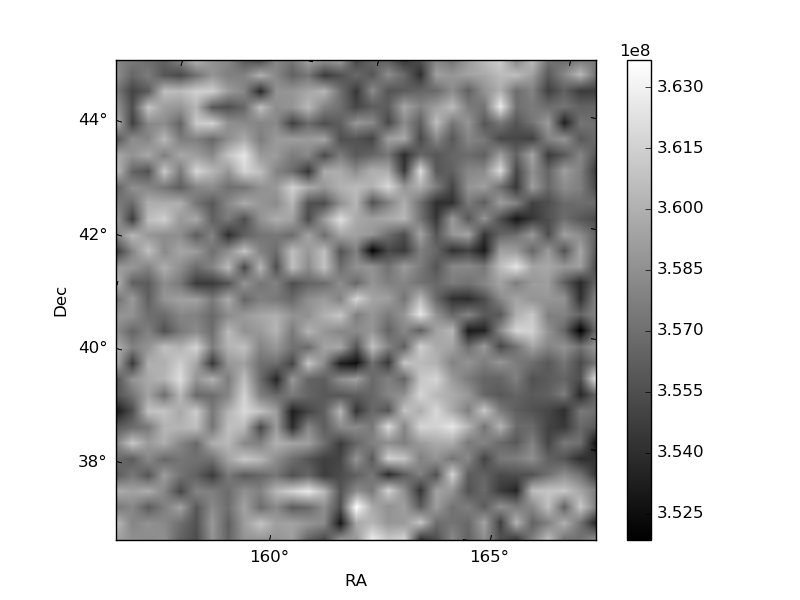
Quadrant B |
|---|---|---|---|
| Quadrant D | 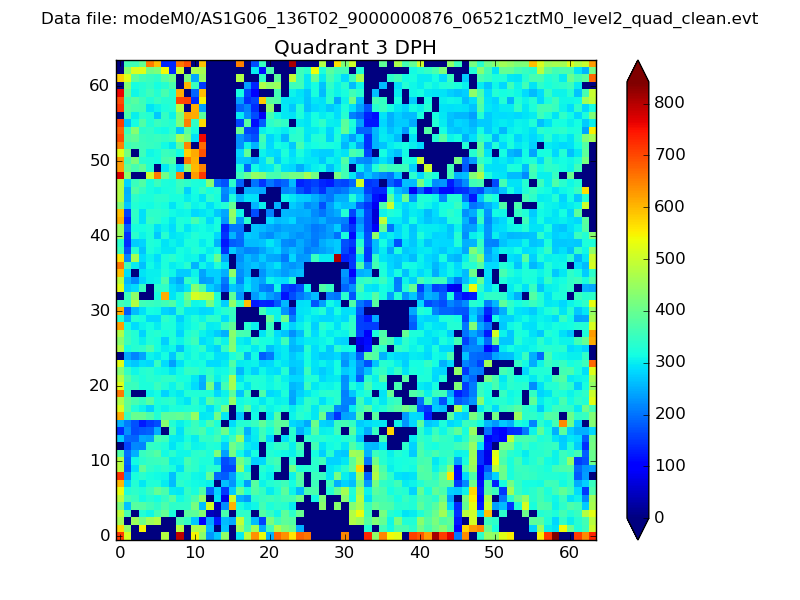 |
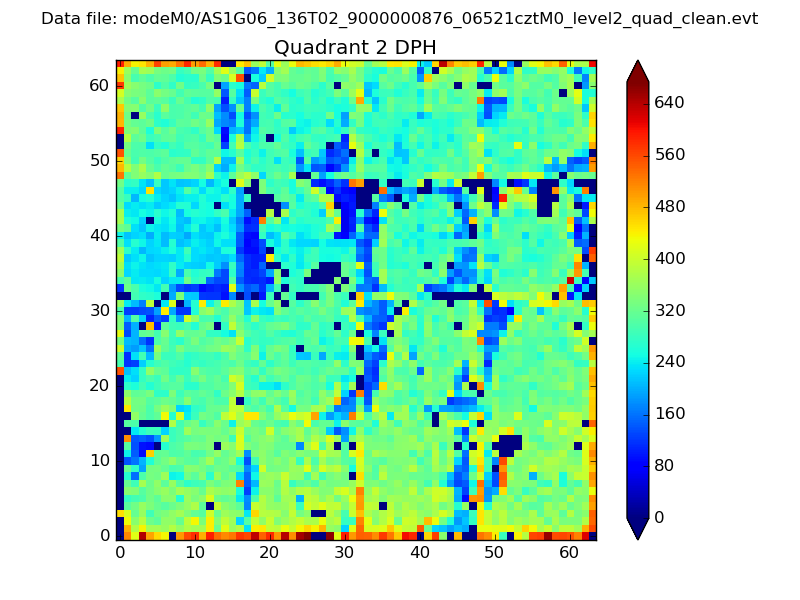 |
Quadrant C |
| Plot type | Count rate plots | Images |
|---|---|---|
| Comparison with Poisson distribution Blue bars denote a histogram of data divided into 1 sec bins. Red curve is a Poisson curve with rate = median count rate of data. |
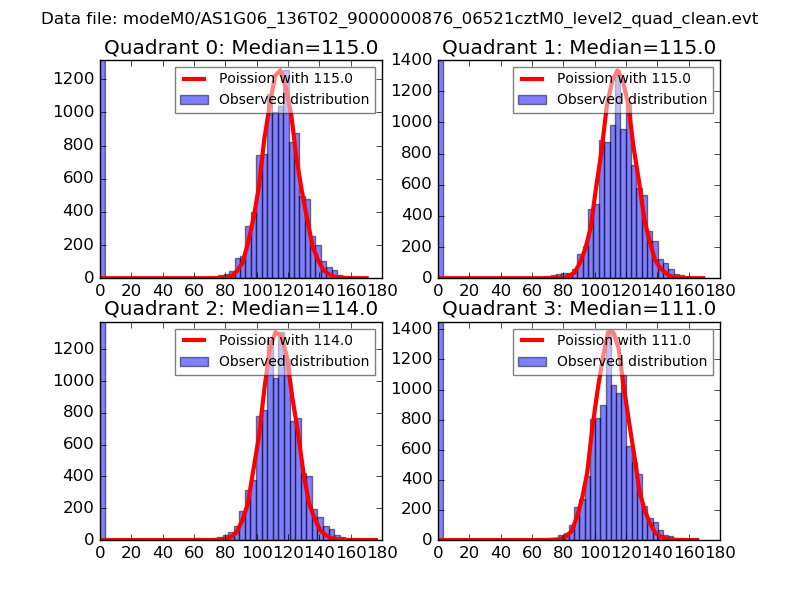 |
 |
| Quadrant-wise count rates Data is divided into 100 sec bins |
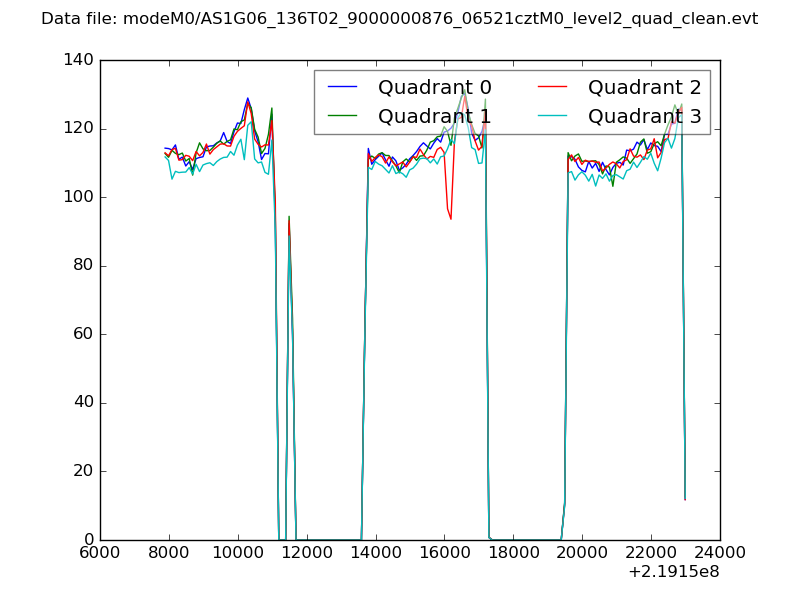 |
|
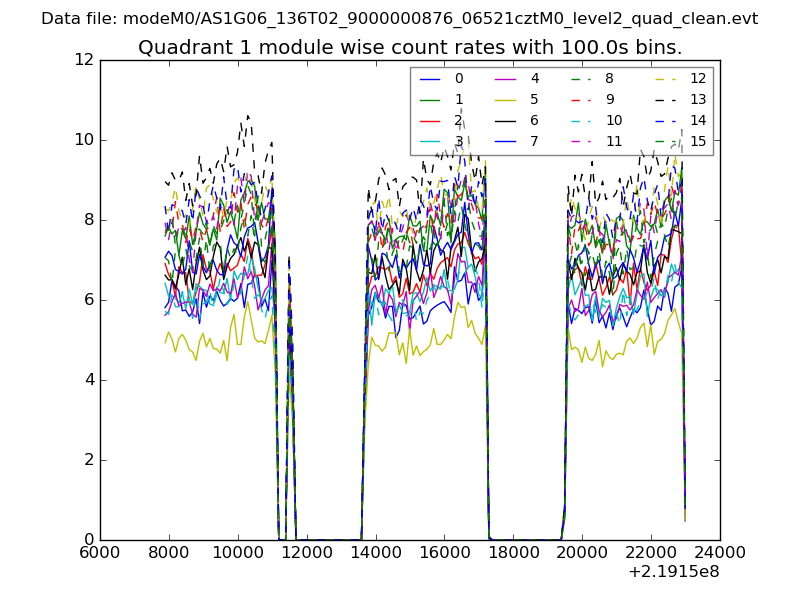
| Module-wise count rates for Quadrant A Data is divided into 100 sec bins |
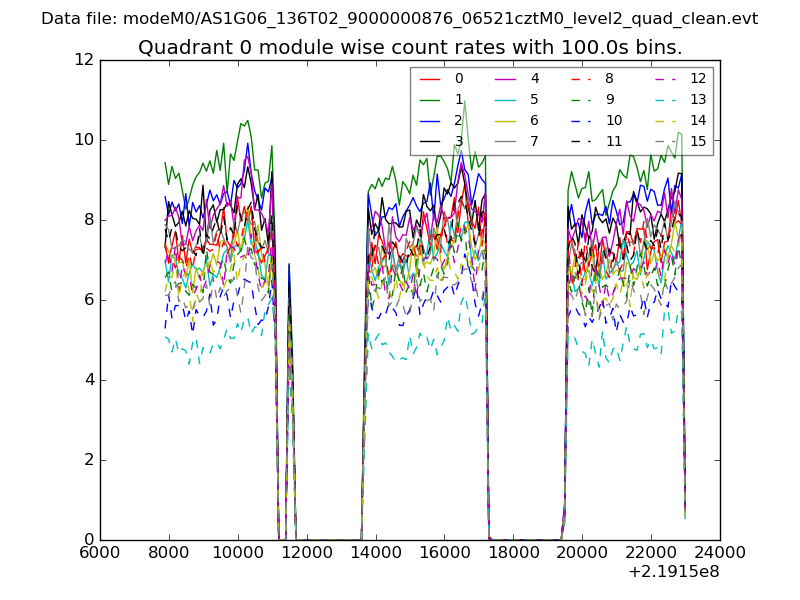 |
 |
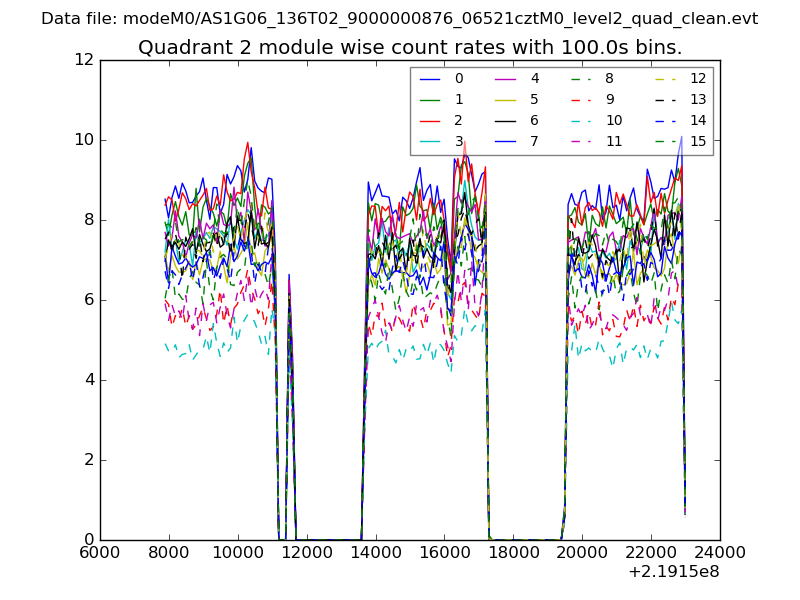
| Module-wise count rates for Quadrant B Data is divided into 100 sec bins |
 |
 |
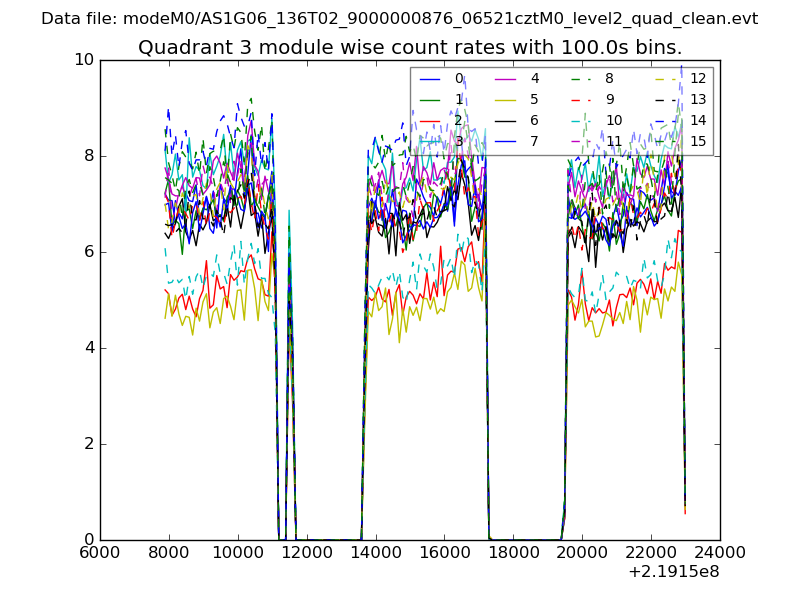
| Module-wise count rates for Quadrant C Data is divided into 100 sec bins |
 |
 |
| Module-wise count rates for Quadrant D Data is divided into 100 sec bins |
 |
 |
| Parameter | Plot |
|---|---|
| CZT HV Monitor | 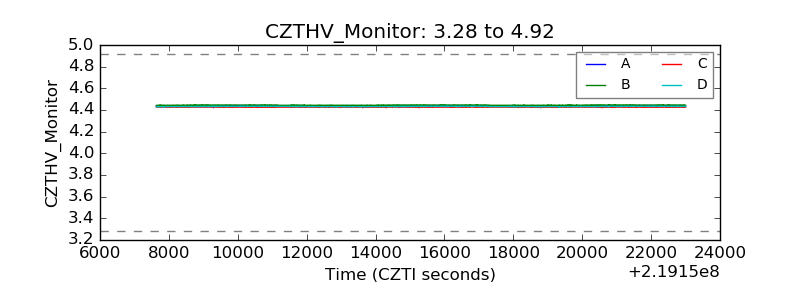 |
| D_VDD | 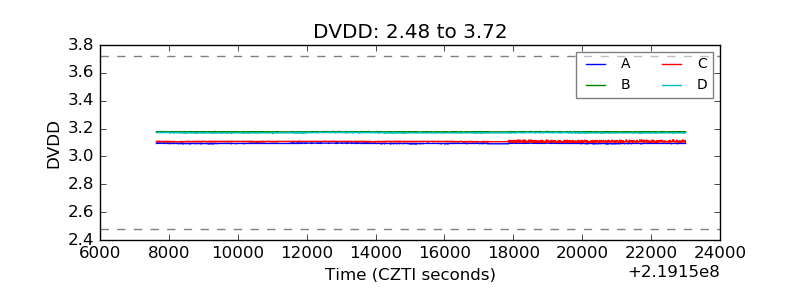 |
| Temperature 1 | 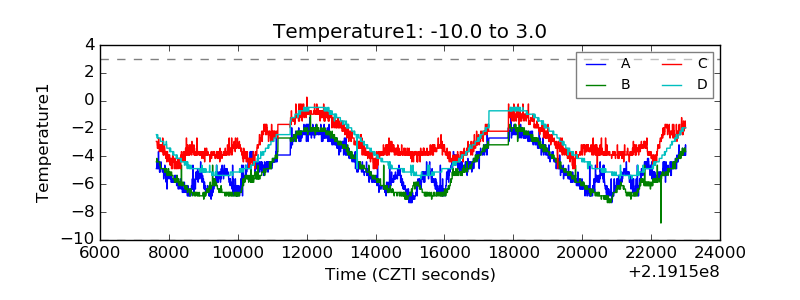 |
| Veto HV Monitor | 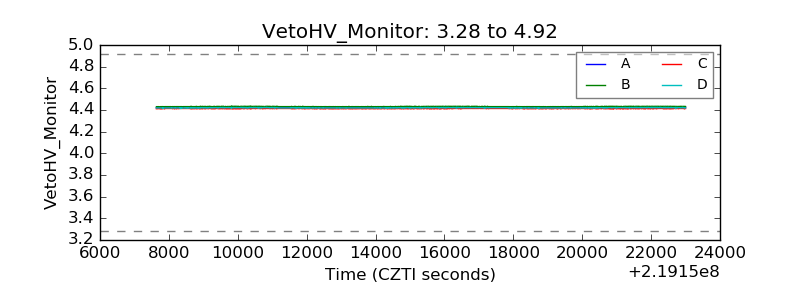 |
| Veto LLD | 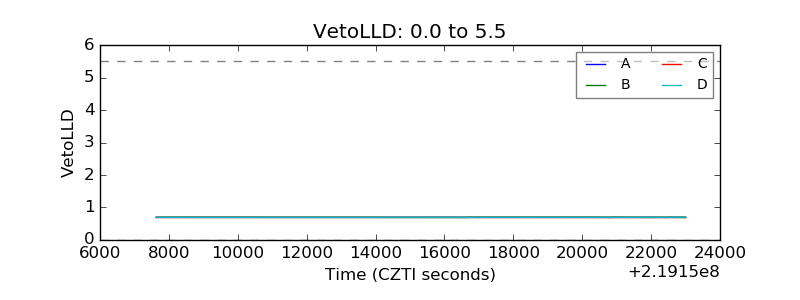 |
| Alpha Counter | 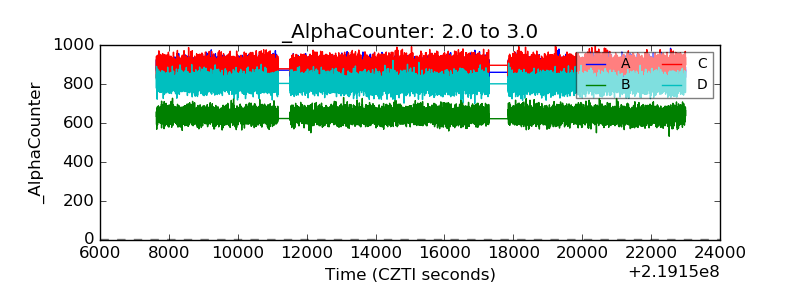 |
| _CPM_Rate | 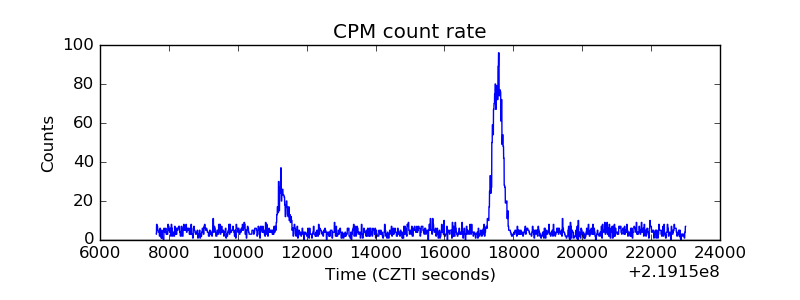 |
| CZT Counter | 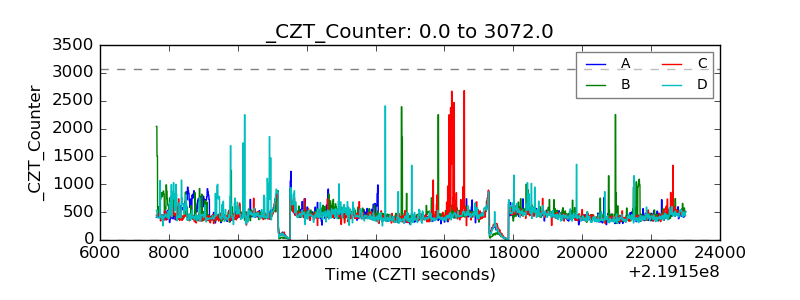 |
| +2.5 Volts monitor |  |
| +5 Volts monitor | 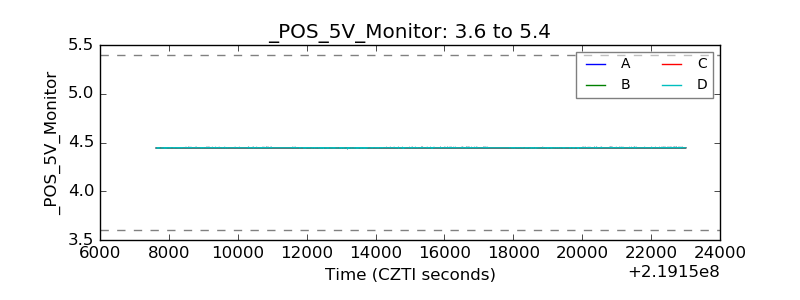 |
| _ROLL_ROT | 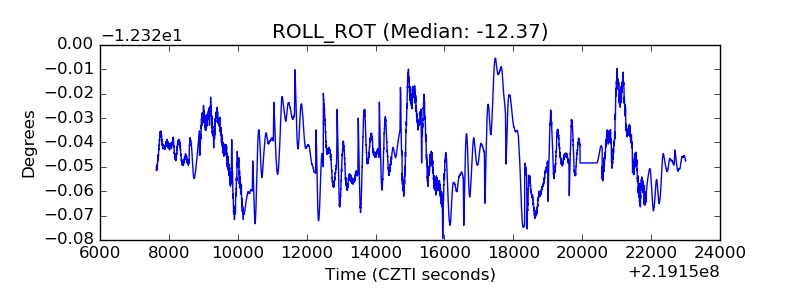 |
| _Roll_DEC | 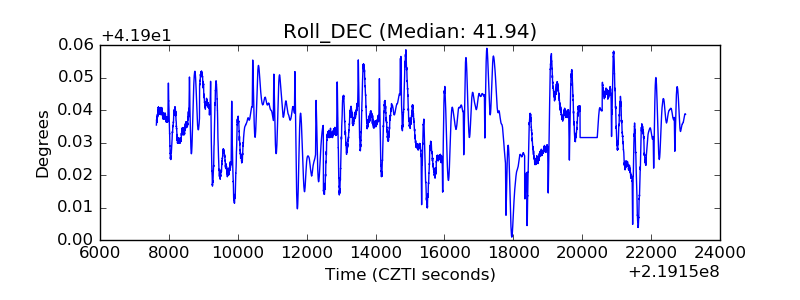 |
| _Roll_RA | 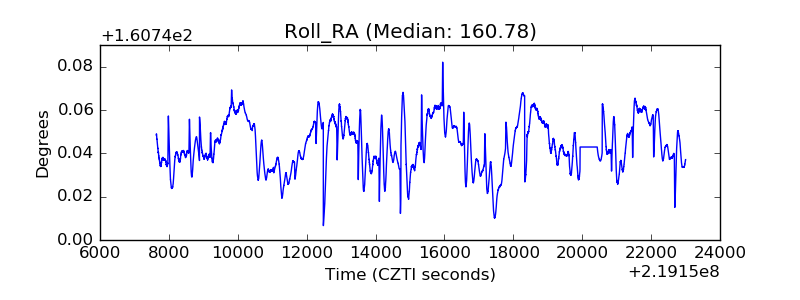 |
| Veto Counter | 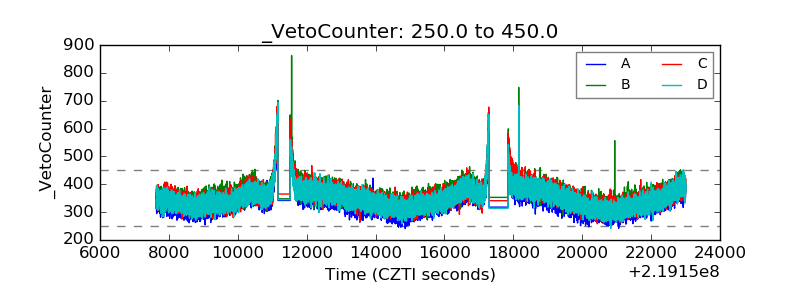 |